(Bloomberg) High Yield Market Highlights
- The US junk bond rally finally broke on Thursday with the biggest one-day loss in four weeks driving the market to its first modest weekly loss since mid February. Data showed inflation continues to be sticky, even as retail sales showed some sluggishness signaling consumer spending may not hold as strong.
- The prices paid to US producers rose the most in six months, pushed by higher fuel and food costs reinforcing broad concerns that the Federal Reserve may not be persuaded to ease its interest-rate policy anytime in the first half of the year.
- While the market is pricing in fewer cuts and Treasury yields have increased markedly, it is a positive for credit, Barclays’ Brad Rogoff and Dominique Toublan wrote in a note Friday.
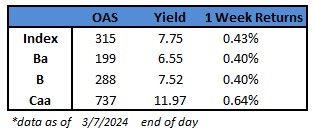
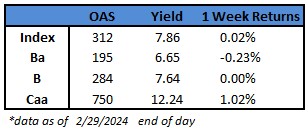
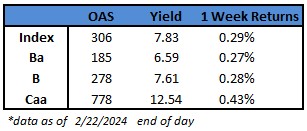
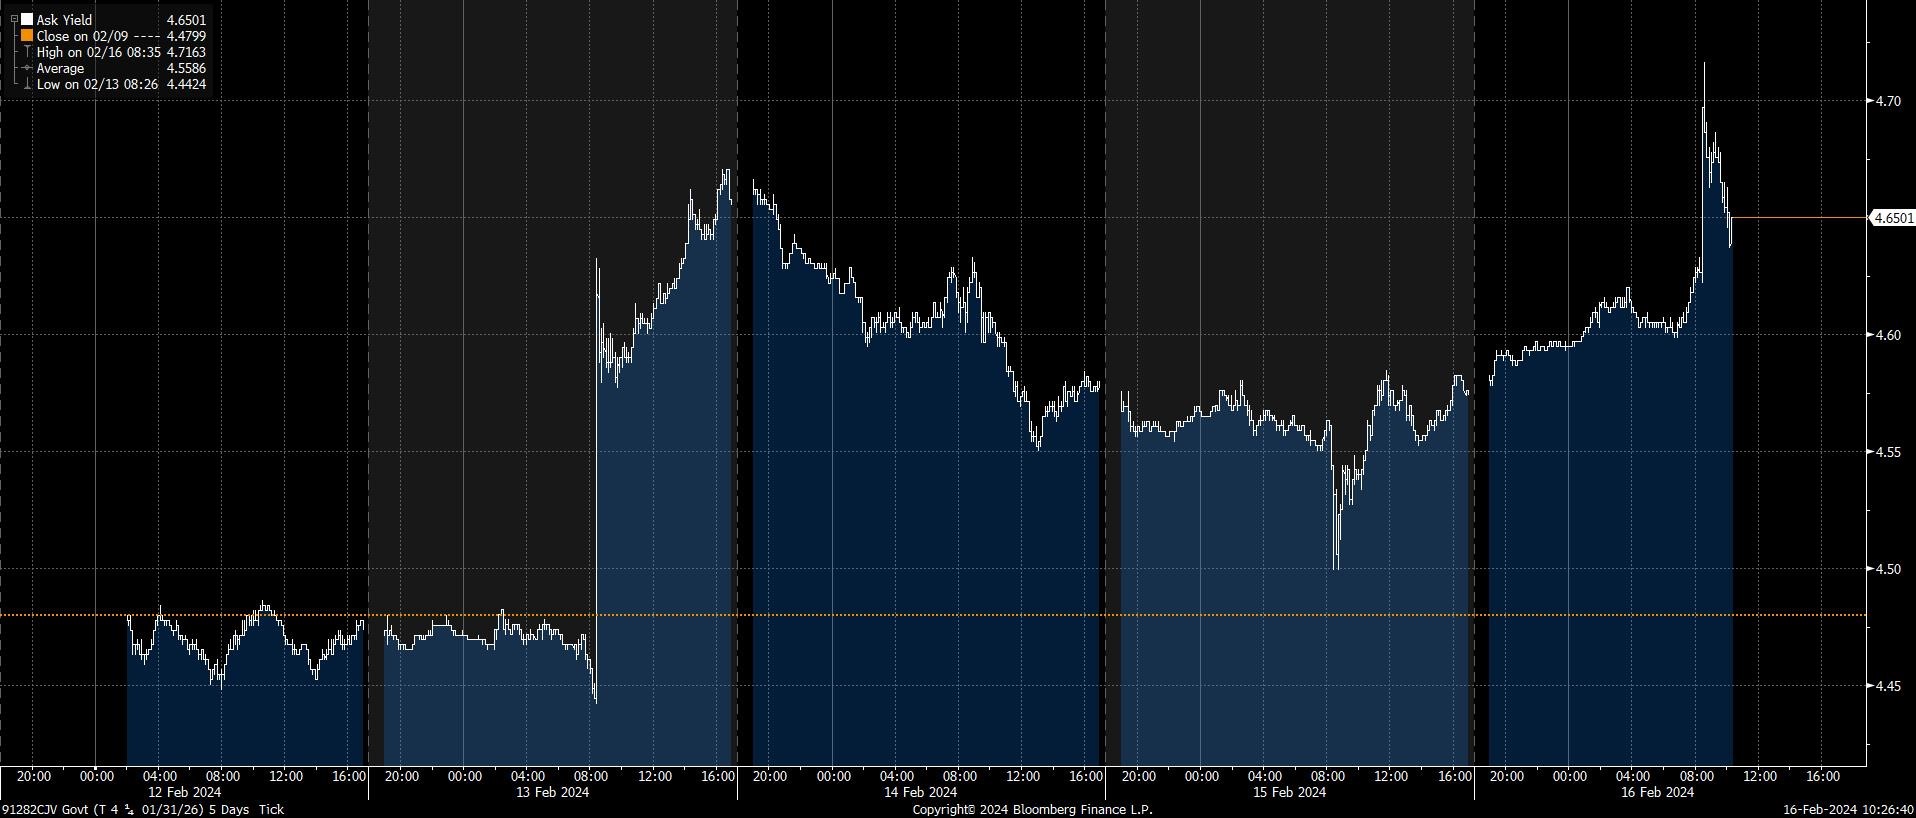
- Junk bond yields have risen six basis points in the last four sessions to 7.78.
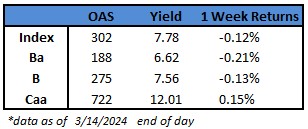
- While yields were higher, though steady in the 7.70%-7.80% range, spreads dropped to 302 basis points, the lowest since January 2022, and a decline of 12 basis points since the beginning of the week.
- Modest losses extended across ratings snapping the 15-day gaining streak in CCCs, the riskiest part of the high yield market. CCCs posted a loss of 0.21% on Thursday, the first in 16 sessions.
- CCC yields rose to 12.01%, a five basis-point increase from last Friday, and the first weekly jump in four weeks.
- CCCs, powered by the 15-day gaining streak, are headed to small gains for the week, bucking the broader trend. The week-to-date gains are 0.15%.
- A resilient economy, a steady labor market and strong corporate balance sheets have drawn borrowers and investors into the market.
- Steady yields and prices below par are inducing borrowers to take advantage of the market. The index price has hovered around $92-$93 this year.
- Four deals for more than $2b priced on Thursday, pushing weekly issuance volume to $4.2b. The month-to-date supply stands at $11.8b.
- Year-to-date supply is $69b.
- The primary market is expected to stay busy in the next two weeks, though it may slow down ahead of the Fed meeting next week.
This information is intended solely to report on investment strategies identified by Cincinnati Asset Management. Opinions and estimates offered constitute our judgment and are subject to change without notice, as are statements of financial market trends, which are based on current market conditions. This material is not intended as an offer or solicitation to buy, hold or sell any financial instrument. Fixed income securities may be sensitive to prevailing interest rates. When rates rise the value generally declines. Past performance is not a guarantee of future results.