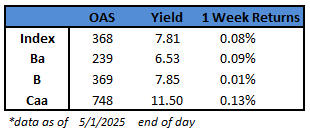
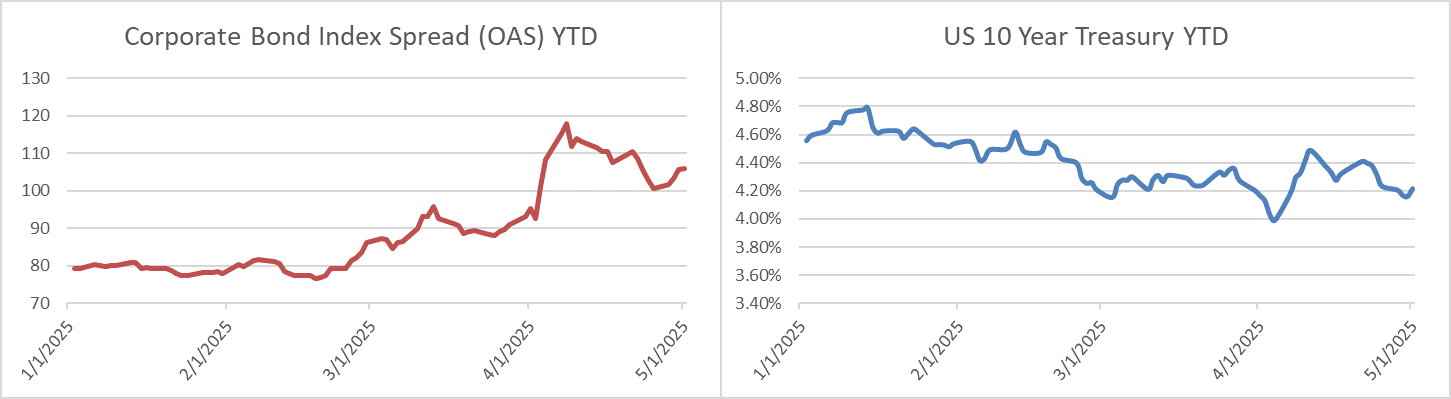
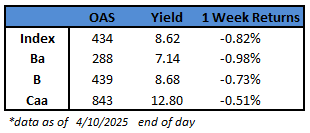
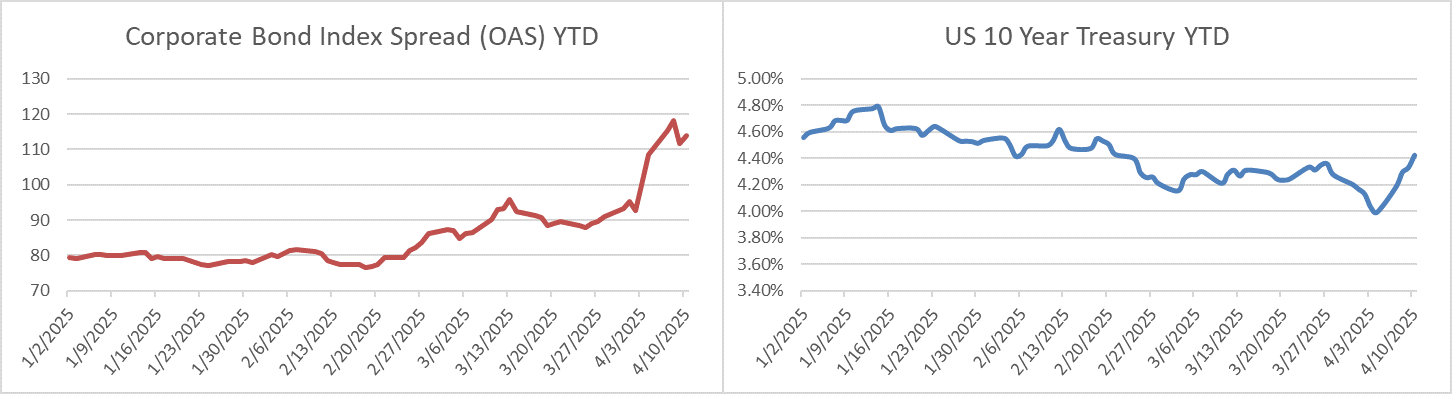
Category: Insight

10 May 2024

CAM High Yield Weekly Insights

(Bloomberg)  High Yield Market Highlights

  • Weekly US junk-bond supply rose to almost $13 billion, making it the busiest week for new bond sales since the week ended Oct. 1, 2021.
  • The supply spurt came after junk bonds racked up the strongest weekly returns since December on expectations that the Federal Reserve may begin to lower interest rates by the end of third quarter as inflation slows while the economy stays resilient.
  • The cascade of new issuance drove the month’s tally to more than $14b in just seven sessions, more than 63% of the full month of May 2023 with three full weeks still to go. Month-to-date volume is up by 59% versus the comparable period a year ago
  • Five companies sold nearly $2b Thursday to take the week’s volume to $12.8b. For the week, 18 borrowers came to market
  • The recent rally stalled after a three-day gaining streak and is poised to close the week with modest gains after strong returns last week
  • Though the rally faded across ratings, US borrowers capitalized on the strong risk appetite with spreads around 300 basis points and yields holding steady below 8% in the context of a strong and resilient economy
  • CCC yields closed at 12.14% and spreads at 723 basis points, up six and seven basis points, respectively, this week so far pushing week-to-date loss to -0.21% and ending the two-week gaining stretch
  • Demand for credit remained robust and investors absorbed the higher-than-expected issuance with limited effects on the secondary market, Brad Rogoff and Dominique Toublan of Barlcays wrote Friday


This information is intended solely to report on investment strategies identified by Cincinnati Asset Management. Opinions and estimates offered constitute our judgment and are subject to change without notice, as are statements of financial market trends, which are based on current market conditions. This material is not intended as an offer or solicitation to buy, hold or sell any financial instrument. Fixed income securities may be sensitive to prevailing interest rates. When rates rise the value generally declines. Past performance is not a guarantee of future results.

06 May 2024

COMENTARIO DEL CUARTO TRIMESTRE

En el primer trimestre del año se produjo una demanda entusiasta de los inversores por bonos corporativos con grado de inversión y diferenciales de crédito más ajustados. El desempeño de los diferenciales se vio contrarrestado por los rendimientos de los bonos del Tesoro, que subieron a lo largo del trimestre a medida que los datos económicos y los mensajes de la Reserva Federal dejaron cada vez más claro que esta sería más deliberada con los recortes de tasas de lo que el mercado había anticipado a principios de 2024. En conjunto, fue un trimestre modestamente negativo en términos de rentabilidad total para el crédito de grado de inversión, pero se trata de una clase de activo que se presta mejor a una visión a más largo plazo. Creemos que el entorno actual presenta una oportunidad. Los elevados rendimientos de los bonos del Tesoro y los sólidos indicadores crediticios en todo el universo de IG tienen el potencial de generar retornos atractivos ajustados al riesgo para los inversores en crédito de IG en un horizonte temporal más largo.

Resumen del primer trimestre

El diferencial ajustado por opciones (Option Adjusted Spread, OAS) en el índice de bonos corporativos de los EE. UU. de Bloomberg abrió el año en 99 y brevemente se negoció más ampliamente durante los primeros 7 días hábiles del año antes de que el estado de ánimo mejorara hasta el punto de que nunca volvería a cotizar barato en su nivel de apertura durante el primer trimestre. El índice cotizó tan ajustado como 88 cerca de finales de marzo, su nivel más estrecho desde noviembre de 2021, antes de terminar el trimestre con un OEA de 90. Quizás el aspecto más sorprendente de este movimiento hacia diferenciales más ajustados es que se produjo en medio de una avalancha récord de oferta de nuevas emisiones, cuando los prestatarios imprimieron $529 mil millones de dólares en nueva deuda corporativa con calificación IG durante el trimestre.

A veces, una gran cantidad de nuevas emisiones en un breve periodo puede tener el efecto de aumentar los diferenciales de crédito a medida que los inversores venden sus participaciones existentes para dejar espacio para asignaciones de nuevas emisiones. Por ejemplo, en 2020 y 2022, cuando la oferta de nuevas emisiones en el primer trimestre superó los $450 millones de dólares, estuvo acompañada de un aumento significativo de los diferenciales de crédito; sin embargo, ese no fue el caso en 2024, ya que la demanda de los inversores fue sólida y los flujos de fondos de IG fueron sólidamente positivos, lo que respaldó diferenciales más ajustados y un mercado sólido para nuevas emisiones.

Pasando a los rendimientos de los bonos del Tesoro, fueron más altos en todos los ámbitos en el primer periodo del año, lo que minó algo de impulso de los rendimientos totales.

Aunque no nos gusta que las tasas suban debido a los obstáculos a corto plazo que esto crea para el rendimiento, creemos que los rendimientos más altos presentan una oportunidad para que los inversores sean compensados por asumir riesgos de duración intermedia. Los rendimientos siguen siendo elevados en relación con el pasado reciente: el rendimiento al vencimiento (Yield To Maturity, YTM) del índice corporativo cerró el primer trimestre en 5.30 %, 180 puntos básicos por encima de su YTM promedio de 3.50 % en los últimos 10 años.

El mercado luchó, pero la Reserva Federal siempre gana

En nuestro comentario de enero escribimos que creíamos que el listón era alto para los recortes de tasas a corto plazo y nuestra opinión sigue siendo la misma. A principios de año, los futuros sobre fondos de la Reserva Federal implicaban siete recortes de tasas de 25 puntos básicos en 2024 para un total del 1.751. Los inversores especularon que el primer recorte se produciría en la reunión de marzo y un recorte adicional en cada reunión posterior (el Comité Federal de Mercado Abierto [Federal Open Market Committee, FOMC] celebra 8 reuniones periódicas al año)2. Esto es lo que estaban descontando los futuros de tasas de interés a principios de enero, a pesar de que en diciembre la Reserva Federal publicó su “Resumen de Proyecciones Económicas” (Summary of Economic Projections, SEP), que incluía el gráfico de puntos que mostraba solo un 0.75 % de recortes de tasas en 2024. Para ser justos, la Reserva Federal tiene cierta responsabilidad por la exuberancia del mercado en enero gracias a su mensaje moderado tras la reunión del FOMC de diciembre.

A medida que avanzaba el primer trimestre, el mercado poco a poco empezó a aceptar la idea de que la Reserva Federal podría actuar con cautela y reducir su tasa de política con más cautela de lo esperado. Como hace cada tres meses, la Reserva Federal emitió un SEP actualizado en su reunión de marzo de 2024, que fue ligeramente más agresivo que el de diciembre, pero aun así mostró recortes de tasas del 0.75 % en 2024. Al final del primer trimestre, los futuros de fondos de la Reserva Federal reflejaron el gráfico de puntos más reciente de marzo, lo que implica una probabilidad del 56.9 % de un recorte en la reunión de junio, con 2 recortes adicionales a seguir en las reuniones de septiembre y diciembre3. En nuestra opinión, esta es una visión mucho más realista de lo que es probable que ocurra. Sin algún tipo de impacto exógeno, o en ausencia de datos que muestren que la economía se está desacelerando de manera significativa, esperamos que la Reserva Federal sea paciente mientras busca aliviar su política restrictiva. Aunque no es nuestro escenario base, creemos que existe una posibilidad razonable de que la Reserva Federal no haga ningún recorte en 2024. Creemos que el resultado más probable es que la Reserva Federal aplique uno o dos recortes de 25 puntos básicos en la segunda mitad del año. La Reserva Federal se enfrenta a un dilema difícil: no puede actuar demasiado rápido ante una economía estadounidense resiliente que sigue creando empleos; pero cuanto más tiempo mantenga las tasas en niveles elevados, mayor será la probabilidad de que la economía caiga en algún tipo de recesión. Tenemos un alto grado de convicción de que a la Reserva Federal le gustaría mucho reducir la tasa de política tan pronto como sea posible, pero no confiamos en que los datos le permitan hacerlo. Por lo tanto, creemos que es más probable que se produzca una recesión modesta antes de finales de 2025 que se deba a una versión ampliada de una política monetaria de “más alto durante más tiempo”.

Valor de la gestión activa

Creemos que una Reserva Federal que esté sesgada hacia la reducción de su tasa de interés oficial es positiva para nuestra estrategia. Somos un gestor intermedio y la mayor parte de nuestra cartera está posicionada en bonos con vencimiento entre 5 y 10 años. Nuestro caso base es el siguiente escenario: la tasa de los fondos de la Reserva Federal disminuye con el tiempo, mientras que los bonos del Tesoro con vencimientos entre 2 y 5 años disminuyen en conjunto; al mismo tiempo, los bonos del Tesoro intermedios que vencen en 5 a 10 años regresan a un nivel normalizado con pendiente ascendente. Este escenario permitiría que la curva de rendimiento recuperara parte de su inclinación clásica y la cartera de CAM se beneficiaría del efecto de “reducción” a medida que los bonos bajan por la curva de rendimiento, acercándose poco a poco al vencimiento cada día que pasa.

El gráfico anterior se remonta a 20 años atrás, hasta finales del primer trimestre de 2024. Como puede ver, la curva del Tesoro 5/10 es casi siempre positiva y ha promediado 56.6 puntos básicos (basis points, bp) de inclinación durante ese periodo en relación con su nivel de cierre de -1 pb a finales de marzo. Si se compra un bono a 10 años con la intención de conservarlo durante 5 años antes de venderlo, y la curva del Tesoro 5/10 promedia 50 bp durante ese periodo, el bono producirá 10 bp de compensación de manera anual en forma de reducción. Las curvas no son estáticas y, en nuestra opinión, se entienden mejor en términos de promedios.

Cuando se habla de crédito IG, es importante recordar que hay dos curvas que deberían interesar a un inversor. Está la curva del Tesoro antes mencionada y luego está la curva de crédito corporativo que cotiza por encima de los bonos del Tesoro; esta es la compensación adicional que recibe un inversor por asumir el riesgo crediticio adicional de poseer un bono corporativo en lugar de un bono del Tesoro. Al igual que las curvas del Tesoro, las curvas de crédito corporativo están en constante evolución y cambian todo el tiempo, por lo que pueden presentar oportunidades para el inversor activo. A diferencia de la curva del Tesoro, que puede invertirse, la curva de crédito corporativo casi nunca se invierte, aunque puede invertirse para emisores de bonos específicos de vez en cuando debido a condiciones crediticias o factores técnicos. Los gestores activos eventualmente aprovecharán estas inversiones hasta que dejen de existir.

Al final del primer trimestre, la curva de crédito corporativo típica para las empresas con calificación A que estamos analizando para nuestras carteras oscilaba entre 20 y 30 puntos básicos, con valores atípicos a ambos ladosiv. Entonces, si elegimos un punto medio de 25 bp, eso significa que un bono a 5 años de un emisor que cotiza con un diferencial de 50/5 años podría esperar que el bono a 10 años de ese mismo emisor se negocie con un diferencial de 75/10 años. Si se comprara un bono a 10 años con la expectativa de venderlo en el plazo de 5 años, produciría 5 bp de reducción del diferencial de crédito por cada año que se mantenga. Esta es solo la compensación que ofrece la curva de crédito corporativo. En entornos normalizados con una curva del Tesoro con pendiente ascendente, la reducción de la curva 5/10 TSY proporcionaría beneficios adicionales además de la compensación recibida de la curva de crédito. Este doble golpe puede amplificar la rentabilidad total, beneficiando a los inversores durante los periodos de curvatura más pronunciada.

Como gestor activo, siempre buscamos formas de maximizar el posicionamiento de los clientes a lo largo de las curvas de crédito y del Tesoro. A veces esto significa que favoreceremos vencimientos más cortos dentro de ese rango de 5 a 10 años y otras veces estaremos en el extremo más largo de ese rango. En algunos entornos, como en el que nos encontramos actualmente, la economía dictará que mantengamos los bonos existentes por más tiempo, hasta que les queden 3 o 4 años hasta su vencimiento, para maximizar la efectividad de una operación de extensión de venta. Aunque vendemos más del 98 % de nuestras participaciones antes del vencimiento, ocasionalmente las matemáticas de los bonos indicarán que es mejor mantener un bono hasta el vencimiento que si lo vendiéramos y compráramos otra cosa. Como gestor activo, nos centramos en el mercado de bonos todo el día, todos los días, evaluando de manera constante las oportunidades y buscando maximizar el valor de la tenencia de cada cliente individual.

Solvencia crediticia: fuerte a bastante fuerte

Nos enorgullecemos de nuestro proceso de investigación ascendente y creemos que es uno de los atributos más importantes que aportamos como gestor. No podemos controlar la dirección de las tasas de interés, pero podemos exhibir un gran control sobre la solvencia crediticia de los bonos de las empresas que incluimos en las carteras de clientes. Las empresas con grado de inversión reciben calificación IG por una razón: sí, las empresas con calificación IG a veces incumplen sus obligaciones de deuda, pero generalmente es un proceso de degradación crediticia que dura varios años y un gestor prudente venderá antes de que se produzca el peor de los casos de incumplimiento; en otras palabras, cuando se analiza el crédito con grado de inversión, no hay muchos bonos malos, pero sí muchos precios malos. Hay muchos bonos en el universo IG que simplemente tienen precios demasiado altos y que no ofrecen una compensación adecuada por unidad de riesgo. Siempre buscamos poblar las carteras de clientes con bonos que estén valorados de manera adecuada en un esfuerzo por reducir la volatilidad y limitar la perspectiva de ampliación de los diferenciales durante periodos difíciles del mercado.

Aunque nos centramos en el análisis de crédito individual, observar las métricas crediticias para el universo IG en su conjunto es instructivo cuando intentamos ilustrar la salud actual del mercado en general y también nos ayuda a juzgar el valor relativo de las oportunidades de inversión. Al final del cuarto trimestre de 2023, las métricas crediticias en todo IG eran sólidas<sup>1</sup>. Los márgenes de ganancias antes de intereses, impuestos, depreciación y amortización (Earnings Before Interest, Taxes, Depreciation, and Amortization, EBITDA) en particular continuaron luciendo impresionantes en relación con la historia y están cerca de máximos históricos, mientras que el crecimiento de EBITDA volvió a ser positivo después de un trimestre de caídas.

El apalancamiento de la deuda neta para el índice IG no financiero se ha mantenido estable durante 5 trimestres consecutivos y ha mejorado desde el primer semestre de 2022. La única métrica crediticia importante que ha disminuido en los últimos trimestres es la cobertura de intereses y eso se debe en gran medida a que las empresas han estado emitiendo nueva deuda con cupones más altos que la deuda que vencíav. En el primer trimestre de 2024, el cupón promedio de las nuevas emisiones de IG fue del 5.33 %, 202 bp más que el cupón promedio de los bonos que vencen, que fue del 3.31 %vi. Para ponerlo en contexto, compare con el 7.24 %, que era la tasa hipotecaria fija promedio a 30 años para un comprador residencial al final del primer trimestre: el costo de capital para las empresas con calificación IG parece muy razonablevii. En pocas palabras, los inversores no necesitan asumir mucho riesgo crediticio o de tasa de interés para generar retornos saludables en el crédito con calificación IG: las métricas crediticias agregadas se encuentran en niveles saludables y el rendimiento del índice es >5 %.

Mirada hacia el futuro

Los últimos años han sido un momento histórico en los mercados crediticios. Desde marzo de 2020 hasta marzo de 2022 experimentamos posiblemente la política de la Reserva Federal más fácil de la historia, con un 0 % de fondos de la Reserva Federal acompañado de un estímulo económico sin precedentes. Luego, la Reserva Federal aumentó su tasa de política 11 veces en 18 meses hasta su rango actual de 5.25 % a 5.5 %, el ritmo más rápido de ajuste en más de 40 añosviii. Una vez más estamos al borde del precipicio de la historia, ya que la Reserva Federal tiene la tarea de terminar la guerra contra la inflación y al mismo tiempo restaurar su tasa de política a un nivel más normativo. Es un entorno de incertidumbre: ¿hacia dónde irá la economía a partir de ahora? Continuaremos centrándonos en nuestro pan de cada día y eso es poblar las carteras de clientes con bonos de empresas que están bien preparadas para navegar en una variedad de entornos económicos. Le agradecemos su interés y su colaboración continua mientras navegamos por el resto del año 2024.

.

Esta información solo tiene el propósito de dar a conocer las estrategias de inversión identificadas por Cincinnati Asset Management. Las opiniones y estimaciones ofrecidas están basadas en nuestro criterio y están sujetas a cambios sin previo aviso, al igual que las declaraciones sobre las tendencias del mercado financiero, que dependen de las condiciones actuales del mercado. Este material no tiene como objetivo ser una oferta ni una solicitud para comprar, mantener ni vender instrumentos financieros. Los valores de renta fija pueden ser vulnerables a las tasas de interés vigentes. Cuando las tasas aumentan, el valor suele disminuir. El rendimiento pasado no es garantía de resultados futuros. El rendimiento bruto de la tarifa de asesoramiento no refleja la deducción de las tarifas de asesoramiento de inversión. Nuestras tarifas de asesoramiento se comunican en el Formulario ADV Parte 2A. En general, las cuentas administradas mediante programas de firmas de corretaje incluyen tarifas adicionales. Los rendimientos se calculan mensualmente en dólares estadounidenses e incluyen la reinversión de dividendos e intereses. El índice no está administrado y no considera las tarifas de la cuenta, los gastos y los costos de transacción. Se muestra con fines comparativos y se basa en información generalmente disponible al público tomada de fuentes que se consideran confiables. No se hace ninguna afirmación sobre su precisión o integridad.

La información suministrada en este informe no debe considerarse una recomendación para comprar o vender ningún valor en particular. No hay garantía de que los valores que se tratan en este documento permanecerán en la cartera de una cuenta en el momento en que reciba este informe o que los valores vendidos no hayan sido vueltos a comprar. Los valores de los que se habla no representan la cartera completa de una cuenta y, en conjunto, pueden representar solo un pequeño porcentaje de las tenencias de cartera de una cuenta. No debe suponerse que las transacciones de valores o participaciones analizadas fueron o demostrarán ser rentables, o que las decisiones de inversión que tomemos en el futuro serán rentables o igualarán el rendimiento de la inversión de los valores discutidos en este documento. Como parte de la educación de los clientes sobre la estrategia de CAM, podemos incluir referencias a tasas y diferenciales históricos. Los ejemplos hipotéticos que hacen referencia al nivel o cambios en las tasas y diferenciales tienen únicamente fines ilustrativos y educativos. No pretenden representar el desempeño de ninguna cartera o valor en particular, ni incluyen el impacto de las tarifas y gastos; tampoco toman en consideración todas las condiciones económicas y de mercado que influyen en nuestra toma de decisiones. Por lo tanto, las cuentas de los clientes pueden experimentar o no escenarios similares a los mencionados en este documento.

En nuestro sitio web se encuentran disponibles las divulgaciones adicionales sobre los riesgos materiales y los posibles beneficios de invertir en bonos corporativos: Enlace de Divulgación de CAM.

i Bloomberg, 28 de marzo de 2024 “High‐Grade Bond Sales on Easter Pause After Record First Quarter” (“Ventas de bonos de alta
calidad en pausa de Pascua después de un primer trimestre récord”)
ii Bloomberg WIRP, 29 de diciembre de 2023 “Fed Funds Futures” (“Futuros de los fondos de la Reserva Federal”)
iii Bloomberg WIRP, 29 de marzo de 2024 “Fed Funds Futures” (“Futuros de los fondos de la Reserva Federal”)
iv Raymond James & Associates, 28 de marzo de 2024 “Fixed Income Spreads” (“Diferenciales de renta fija”)

v Barclays Bank PLC, 13 de marzo de 2024 “US Investment Grade Credit Metrics, Q24 Update: No Concerns” (“Métricas crediticias de
grado de inversión de los EE. UU., actualización del trimestre de 2024: sin preocupaciones”)
vi JP Morgan, 3 de abril de 2024 “US High Grade Corporate Bond Issuance Review” (“Revisión de la emisión de bonos corporativos de
alto grado de los EE. UU.”)
vii Índice Bloomberg ILM3NAVG, 28 de marzo de 2024 “Bankrate.com US Home Mortgage 30 Year Fixed National Avg”
(“Bankrate.com: promedio nacional de la hipoteca de vivienda en los EE. UU. a 30 años fija”)
viii CNBC, 13 de diciembre de 2023 “The Federal Reserve’s period of rate hikes may be over. Here’s why consumers are still reeling”
(“El periodo de subidas de tasas de la Reserva Federal puede haber terminado. Aquí le contamos por qué los consumidores siguen
conmocionados”)

03 May 2024

CAM Investment Grade Weekly Insights

Credit spreads stuck to a tight range during the week and are looking as though they will finish the period relatively unchanged from where they began.  The Bloomberg US Corporate Bond Index closed at 87 on Thursday May 2 after closing the week prior at the same level.  The 10yr Treasury yield is lower this week, trading at 4.51% this Friday afternoon after closing last week at 4.66%. Through Thursday, the corporate bond index YTD total return was -2.20% while the yield-to-maturity for the benchmark was 5.60% relative to its 5-year average of 3.67%.

Economics

It was a busy week for data with the two main events being the FOMC on Wednesday and the April payroll report on Friday.  The Fed release was in-line with expectations although Chairman Powell was clear that the committee does not anticipate additional rate hikes. The prospect for additional hikes was a theme that some investors had been latching onto in recent weeks so it was reassuring for the dovish camp to hear Powell address this specifically.  The Fed then got the type of data point they have been looking for with Friday’s jobs report: average hourly earnings came in cooler than expectations and job gains for April slowed to 175,000 versus the survey estimate of 240,000.  This was the lightest monthly print for payrolls since October of last year.  Next week is an extremely light week for economic data with the only meaningful prints in the latter half of the week with jobless claims and consumer confidence releases.

Issuance

It was a reasonably busy week for issuance considering the backdrop of earnings and the FOMC meeting as IG-rated companies printed $19bln of new debt.  Syndicate desks are looking for a busier week next week with an estimate of $30bln.  The window for new issuance will start to open up as earnings season winds down and with the lack of the aforementioned “market-moving” economic releases.  Year-to-date issuance stands at $636bln.

Flows

According to LSEG Lipper, for the week ended May 1, investment-grade bond funds reported a net inflow of +$812mm.  IG funds have seen positive flows 17 of the past 18 weeks.  YTD flows into IG stand at +$33.7bln.


This information is intended solely to report on investment strategies identified by Cincinnati Asset Management. Opinions and estimates offered constitute our judgment and are subject to change without notice, as are statements of financial market trends, which are based on current market conditions. This material is not intended as an offer or solicitation to buy, hold or sell any financial instrument. Fixed income securities may be sensitive to prevailing interest rates. When rates rise the value generally declines. Past performance is not a guarantee of future results.

03 May 2024

CAM High Yield Weekly Insights

(Bloomberg)  High Yield Market Highlights

  • US junk bonds gained for the second session in a row, pushing yields down 10 basis points to a three-week low after Fed Chair Powell indicated on Wednesday that a hike in interest-rates was unlikely. However, he also suggested that higher-than-expected inflation readings have reduced the central bank’s confidence that price pressures are easing.
  • The US high-yield market is headed toward a second week of positive returns, partly fueled by Chair Powell’s reiteration that the Fed is not mulling a hike in rates, while also expressing hopes that rate cuts could happen later in the year.
  • The broader junk bond index yields dropped to 8.01% , falling 12 basis points week-to-date, the second straight week of decline
  • BBs notched up gains of 0.37% on Thursday, the strongest one-day returns since December and on track for a second consecutive week of gains. The week-to-date advance is 0.56%, the most in six weeks
  • BB yields dropped nine basis points on Thursday to 6.77%, and 11 basis points week-to-date
  • Single B yields also slid 11 basis points week-to-date to 7.85%, driving gains of 0.49%
  • CCC yields fell 19 basis points on Thursday to 12.29% and 13 basis points week-to-date. Tumbling yields drove gains of 0.44% in the first four days
  • The primary market resumed normal business after the Fed meeting, pricing $1.3b on Thursday amid strong economic data, attractive all-in yields and tight spreads


(Bloomberg) US Jobs Post Smallest Gain in Six Months as Unemployment Rises

  • US employers scaled back hiring in April and the unemployment rate unexpectedly rose, suggesting some cooling is underway in the labor market after a strong start to the year.
  • Nonfarm payrolls advanced 175,000 last month, the smallest gain in six months, a Bureau of Labor Statistics report showed Friday. The unemployment rate ticked up to 3.9% and wage gains slowed.
  • Friday’s report signaled further evidence that demand for workers is moderating, but the data likely don’t amount to “an unexpected weakening” that Federal Reserve Chair Jerome Powell said would warrant a policy response.
  • After holding interest rates steady for a sixth straight meeting this week, Powell said he thinks policy is restrictive as seen by weaker demand for labor, though it still exceeds the supply of available workers. As inflation has largely receded from its 2022 peak, officials are now also focused on ensuring maximum employment, he said Wednesday.
  • Treasury yields and the dollar fell, while stock futures rose after the report.
  • Aggregate weekly payrolls, a broad measure of employment, hours and earnings, were unchanged from a month earlier. That snapped three straight years of monthly advances and, if sustained, raises the risk of a downshift in consumer demand.
  • The very gradual cooling in hiring and wage growth is part of the reason why policymakers have indicated they’re in no rush to bring interest rates down from a two-decade high.
  • The participation rate — the share of the population that is working or looking for work — held steady at 62.7%. The rate for workers aged 25-54 ticked up to 83.5%, matching the highest level in two decades. Increased participation will help to restrain wage growth.


This information is intended solely to report on investment strategies identified by Cincinnati Asset Management. Opinions and estimates offered constitute our judgment and are subject to change without notice, as are statements of financial market trends, which are based on current market conditions. This material is not intended as an offer or solicitation to buy, hold or sell any financial instrument. Fixed income securities may be sensitive to prevailing interest rates. When rates rise the value generally declines. Past performance is not a guarantee of future results.

26 Apr 2024

CAM High Yield Weekly Insights

(Bloomberg)  High Yield Market Highlights

  • US junk bonds extended their decline Thursday, logging their biggest one-day loss in the more than a week as slowed economic growth and a higher inflation rating curbed soft-landing hopes.
  • Yields jumped 10 basis points to 8.21%, though they still remain lower for the week
  • Ahead of today’s PCE reading, the inflation component in the 1Q GDP report fueled worries the Federal Reserve may further delay rate cuts to late this year
  • BB yields climbed 8 basis points to 6.96% as such notes lost27%
  • Single B yields jumped 12bps to 8.03%, with a loss of 0.3%
  • CCCs also lost 0.3%, though yields rose just 3bps to 12.55%
  • Tight spreads against the backdrop of a resilient economy continues to draw new bond sales
  • This month’s supply is at $24b, up 28% from the full month of April 2023


(Bloomberg)  US Economy Slows and Inflation Jumps, Damping Soft-Landing Hopes

  • US economic growth slid to an almost two-year low last quarter while inflation jumped to uncomfortable levels, interrupting a run of strong demand and muted price pressures that had fueled optimism for a soft landing.
  • Gross domestic product increased at a 1.6% annualized rate, below all economists’ forecasts, the government’s initial estimate showed. The economy’s main growth engine — personal spending — rose at a slower-than-forecast 2.5% pace. A wider trade deficit subtracted the most from growth since 2022.
  • A closely watched measure of underlying inflation advanced at a greater-than-expected 3.7% clip, the first quarterly acceleration in a year, the Bureau of Economic Analysis report showed Thursday.
  • The figures represent a notable loss of momentum at the start of 2024 after the economy wrapped up a surprisingly strong year. With the inflation pickup, Federal Reserve policymakers — who were already expected to hold interest rates at a two-decade high when they meet next week — may face renewed pressure to further delay any cuts and even to consider whether borrowing costs are high enough.
  • “The hot inflation print is the real story in this report,” Olu Sonola, head of US economic research at Fitch Ratings, said in a note. “If growth continues to slowly decelerate, but inflation strongly takes off again in the wrong direction, the expectation of a Fed interest rate cut in 2024 is starting to look increasingly more out of reach.”
  • The first-quarter pickup in inflation was driven by a 5.1% jump in service-sector inflation that excludes housing and energy, nearly double the prior quarter’s pace.
  • Stripping out inventories, government spending and trade, inflation-adjusted final sales to private domestic purchasers — a key gauge of underlying demand — rose at a 3.1% rate.
  • The GDP report showed outlays for services rose by the most since the third quarter of 2021, fueled by health care and financial services. Spending on goods decreased for the first time in more than a year, restrained by motor vehicles and gasoline.
  • At next week’s Fed meeting, traders will parse Chair Jerome Powell’s comments for clues about the latest thinking around easing policy.


This information is intended solely to report on investment strategies identified by Cincinnati Asset Management. Opinions and estimates offered constitute our judgment and are subject to change without notice, as are statements of financial market trends, which are based on current market conditions. This material is not intended as an offer or solicitation to buy, hold or sell any financial instrument. Fixed income securities may be sensitive to prevailing interest rates. When rates rise the value generally declines. Past performance is not a guarantee of future results.

26 Apr 2024

CAM Investment Grade Weekly Insights

Credit spreads battled through some volatility this week before moving tighter near the end of the period.  The Bloomberg US Corporate Bond Index closed at 89 on Thursday April 25 after closing the week prior at 92.  The 10yr Treasury yield is up slightly on the week, trading at 4.67% this Friday afternoon after closing last week at 4.62%. Through Thursday, the corporate bond index YTD total return was -3.22% while the yield-to-maturity for the benchmark was 5.75% relative to its 5-year average of 3.66%.

Economics

Most of the big economic news of the week occurred in the second half of the period.  Durable goods orders were released on Wednesday with a headline number for March that was in-line with consensus but accompanied by a significant revision downward in February’s number.  GDP data on Thursday was very weak relative to expectations, coming in at +1.6% versus the survey of +2.5% which caused a sizeable selloff in equities and ironically sent Treasury yields higher as the inflationary component of GDP advanced higher relative to expectations.  Friday saw the release of personal spending data as well as PCE data with both coming in hot versus economist estimates.  Taking it all together, there was something for both hawks and doves but none of these numbers are likely to be a game changer for the Fed in its zeal to cut rates.  The FOMC releases its May rate decision next Wednesday and interest rate futures are currently implying just a 2.6% probability of a cut as we go to print this Friday afternoon.  The ride on the road to policy easing continues to be a long and complicated journey.

Issuance

It was the slowest week of the year for new issue with only four borrowers tapping the market for a total of $11.6bln.  The consensus estimate of $20-$25bln was obviously too optimistic especially considering 32% of the S&P 500 reported earnings this week.  Next week is another busy one for earnings and with a Fed meeting on Wednesday prognosticators are only looking for $15bln in new supply.  Year-to-date issuance stands at $616.8bln, up >40% relative to 2023.

Flows

According to LSEG Lipper, for the week ended April 24, investment-grade bond funds reported a net outflow of -$607mm.  This was the first outflow of 2024, breaking a streak of 18 consecutive weeks of inflow for IG funds.  YTD flows into IG stand at +$32.9bln.

This information is intended solely to report on investment strategies identified by Cincinnati Asset Management. Opinions and estimates offered constitute our judgment and are subject to change without notice, as are statements of financial market trends, which are based on current market conditions. This material is not intended as an offer or solicitation to buy, hold or sell any financial instrument. Fixed income securities may be sensitive to prevailing interest rates. When rates rise the value generally declines. Past performance is not a guarantee of future results.

19 Apr 2024

CAM Investment Grade Weekly Insights

Spreads finally took a breather this week as the market moved modestly wider throughout the period.  The Bloomberg US Corporate Bond Index closed at 92 on Thursday April 18 after closing the week prior at 89.  The 10yr Treasury yield is higher again this week and is trading at 4.63% this Friday morning after closing last week at 4.52%. Higher Treasury yields have been a headwind for IG returns so far this year –through Thursday, the index YTD total return was -3.07% while the yield-to-maturity for the benchmark was 5.73% relative to its 5-year average of 3.65%.

Economics

Things got off to a hot start right away on Monday morning as March retail sales data beat expectations in a big way.  Some economists have argued that an early Easter may have pulled some spending forward from April into March but there is no denying that it was a very solid number and yet another data point showing a resilient economy. Federal Reserve chairman Jerome Powell may finally be coming around to the realization that the Fed will have difficulty justifying near term rate cuts.  At an economic forum on Tuesday, Powell commented on rate cuts: “The recent data have clearly not given us greater confidence and indicate that it is likely to take longer than expected to achieve that confidence.” Not all the data was rosy this week as Thursday’s existing home sales release showed a 4.3% decline from February, the biggest monthly drop in over a year.  Additionally, higher Treasury yields caused the average rate on the standard 30-year fixed rate mortgage to surge to 7.1%. Next week we get plenty of data with the grand finale on Friday morning when Core PCE will hit the tape.

Issuance

Issuance was on the screws relative to estimates on the week as volume came in at just over $31bln, although there was not much diversity with the financial sector accounting for 90% of that number.  Syndicate desks are looking for $20-$25bln of new bonds next week.  Year-to-date issuance stands at $605.2bln, up +42% relative to 2023.  It “feels” like new issue concessions showed some improvement on the week but the reality is that it has not yet shown up in the numbers.  Even still, data did show that 66% of deals priced this week rallied in the secondary market.

Flows

According to LSEG Lipper, for the week ended April 17, investment-grade bond funds reported a net inflow of +$170mm.  This was the 18th consecutive weekly inflow for IG funds.  YTD flows into IG stand at +$33.5bln.

This information is intended solely to report on investment strategies identified by Cincinnati Asset Management. Opinions and estimates offered constitute our judgment and are subject to change without notice, as are statements of financial market trends, which are based on current market conditions. This material is not intended as an offer or solicitation to buy, hold or sell any financial instrument. Fixed income securities may be sensitive to prevailing interest rates. When rates rise the value generally declines. Past performance is not a guarantee of future results.

19 Apr 2024

CAM High Yield Weekly Insights

(Bloomberg)  High Yield Market Highlights

  • US junk bonds are headed for the third weekly loss — and the biggest since January — as yields soar to a more than four-month high on geopolitical tensions and concerns about interest rates staying higher for longer and stubborn inflation. Yields, which have risen for seven straight sessions, are at 8.30% and spreads widened to 325 basis points.
  • Rising yields and widening spreads against the backdrop of strong data and decent corporate earnings have fueled supply. The primary market has seen more than $8b priced this week
  • Month-to-date supply stands at $21b and year-to-date volume to $106b
  • The primary market seemed resilient even after Federal Reserve Chair Jerome Powell signaled that the Fed will wait longer than previously anticipated to cut interest rates after a series of surprisingly high inflation readings
  • The market also shrugged off geopolitical conflicts on expectations that diplomacy will prevail and escalation would be stopped in its tracks
  • Losses spanned across ratings. CCC yields approached 13%, a four-month high, after advancing 50 basis points week-to-date. Yields have risen for seven days in a row, the longest rising stretch in more than a year. Spreads jumped to an eight-week high of 786 basis points
  • CCCs suffered losses for the seventh consecutive session and are headed toward the third week of losses. Week-to-date losses stood at 1.06%, the most in a week since early January


(Bloomberg)  Bond Funds Dangling 5% Yields Lure Cash to Active Managers

  • About $90 billion flowed into active bond funds in the first quarter, the most for any three-month period since mid-2021. With yields now at their highest in almost two decades, fund managers see a window of opportunity for investors to lock in outsize returns before the Federal Reserve fulfills its promise to cut rates.
  • The fresh inflows mark the start of “a longer multi-quarter and potentially multi-year trend out of cash,” said Ryan Murphy, head of fixed-income business development at Capital Group, the Los Angeles-based bond colossus. While many investors are still cautiously favoring cash, the rising payouts on debt securities should encourage more to shift their money into bonds, according to Murphy. “Investors are getting the best compensation on fixed income in 20 years,” Murphy said.
  • While the sums are substantial, the real prize for bond managers is getting investors to shift out of money-market funds, which had been holding more than $6 trillion. It’s dropping now — the latest data Thursday showed the largest weekly decline in short-term cash holdings since September 2008.
  • Bond buying right now is a tricky calculus for individual investors, in part because the timing and number of rate cuts keeps getting pushed back, with the latest delay signaled by Fed Chair Jerome Powell in an April 16 discussion. It also takes no small effort to sort through distorted bond prices and credit quality to find real opportunities.
  • All of that favors active managers. “The big picture is that yields are attractive and you need to be an active manager in this environment,” Lindsay Rosner, head of multi-sector fixed income investing at Goldman Sachs Asset Management, said in an interview last week.

    This information is intended solely to report on investment strategies identified by Cincinnati Asset Management. Opinions and estimates offered constitute our judgment and are subject to change without notice, as are statements of financial market trends, which are based on current market conditions. This material is not intended as an offer or solicitation to buy, hold or sell any financial instrument. Fixed income securities may be sensitive to prevailing interest rates. When rates rise the value generally declines. Past performance is not a guarantee of future results.

12 Apr 2024

CAM Investment Grade Weekly Insights

Spreads inched tighter during the week with the Bloomberg US Corporate Bond Index at its narrowest level of the year.  The index closed at 87 on Thursday April 11 after having closed the week prior at 89.  The 10yr is trading at 4.52% this Friday morning after closing last week at 4.40%. Through Thursday, the index YTD total return was -2.40% while the yield-to-maturity for the benchmark was 5.62% relative to its 5-year average of 3.65%.

Economics

It was an active week for economic data with the highlight of the week being another firmer than anticipated CPI print on Wednesday.  This caused a sell-off in Treasuries with the 2-year leading the way as its yield finished the day 23bps higher.  At the end of Wednesday, rates across the board were at the highest levels of 2024 but have since come off the highs and the entire curve is rallying to the tune of about 10bps as we go to print this Friday morning.  These short term moves should not distract corporate bond investors from the bigger picture: this is an asset class that is well poised to deliver solid returns in the future, in our opinion.  This entire year we have been saying that we felt that the bar was quite high for the Fed to begin cutting rates because the economy was simply too strong and the economic data too good.  We were quite puzzled in January when interest rate futures were pricing 6 or 7 cuts despite a Fed dot plot that indicated 3 cuts at the median.  The market has now come around to our view with futures pricing just shy of 2 cuts in 2024 as of this Friday morning.  It is clear from its messaging that the Fed wants to cut and we know it is coming at some point.  We believe that cuts would be a positive for our strategy as we think that it would be an important catalyst for Treasury curves to regain some upward positive slope.  The Fed will cut when the data that it depends on will allow it to cut.  It is as simple as that.  In the interim, we believe that this backup in rates has created an opportunity for long term credit investors.  We would not be surprised if we were to look back a year or two from now and long for the yields that are available to corporate credit investors today.


Issuance

Issuance was in-line with estimates on the week as companies priced $20.2bln of new debt.  Next week dealers are estimating $30bln of new supply with banks leading the way as they report earnings and exit their blackout periods.  Year-to-date issuance stands at $573.7bln, up 39% relative to 2023.

Flows

According to LSEG Lipper, for the week ended April 10, investment-grade bond funds reported a net inflow of +$3.2bln.  This was the 17th consecutive weekly inflow for IG funds.  YTD flows into IG stand at +$33.3bln.

This information is intended solely to report on investment strategies identified by Cincinnati Asset Management. Opinions and estimates offered constitute our judgment and are subject to change without notice, as are statements of financial market trends, which are based on current market conditions. This material is not intended as an offer or solicitation to buy, hold or sell any financial instrument. Fixed income securities may be sensitive to prevailing interest rates. When rates rise the value generally declines. Past performance is not a guarantee of future results.

12 Apr 2024

CAM High Yield Weekly Insights

(Bloomberg)  High Yield Market Highlights

  • US junk bonds are headed for their second straight weekly loss as yields jump to a four-month high after the March core consumer price index rose for the third straight month, fueling fresh concerns that the Federal Reserve could delay interest-rate cuts to the end of year.
  • Junk-bond yields breached the 8% level, climbing to 8.02% on 04/11. Week-to-date losses hit 0.47% after the biggest one-day loss in two months on Wednesday. Losses spanned across ratings as investors pulled cash out of the asset class.
  • On Thursday, the producer price index also rose 2.1% from a year earlier, the biggest gain in 11 months, though some of the incorporating data sets in this index were a touch softer offering some relief after the surprise rise in the consumer price index
  • BB yields advanced to a new four-month high of 6.83% and are poised to rise for the third week in a row. Yields have risen 19 basis points in the last four sessions, prompting a loss of 0.55% this week so far
  • BBs are on track to end the week with losses and could be the biggest since mid-January
  • CCC yields rose 25 basis points since last Friday to 12.37%, a more than six-week high. Rising yields also pushed week-to-date losses to 0.28%.
  • Spreads held steady even while US Treasury yields soared. The 10- and 5-year US Treasury yields have risen 18 and 23 basis points, respectively, since last Friday to close at 4.59% and 4.63%
  • With much of the credit investor base focused on yield buying, spreads have benefited from the rate impact on all-in yields, Brad Rogoff and Dominique Toublan of Barclays wrote in a Friday note
  • Junk bond spreads closed at 301 basis points, a drop of 2 basis points week-to-date
  • BB spreads were still far below 200 basis points at 185, unchanged for the week
  • CCC spreads closed at a two-year low of 714 basis points, down just five basis points
  • Attractive yields and still-tight spreads against the backdrop of a strong and resilient economy drew borrowers into the market
  • April supply is near $13b and year-to-date at $97b


This information is intended solely to report on investment strategies identified by Cincinnati Asset Management. Opinions and estimates offered constitute our judgment and are subject to change without notice, as are statements of financial market trends, which are based on current market conditions. This material is not intended as an offer or solicitation to buy, hold or sell any financial instrument. Fixed income securities may be sensitive to prevailing interest rates. When rates rise the value generally declines. Past performance is not a guarantee of future results.