CAM Investment Grade Weekly
09/28/2018
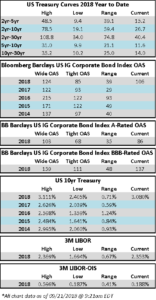
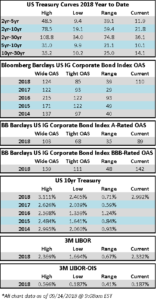
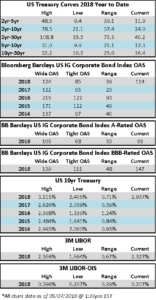
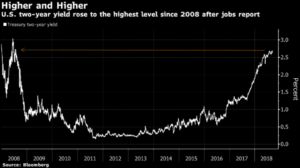
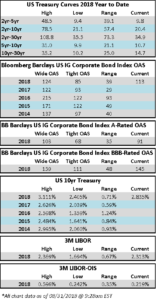
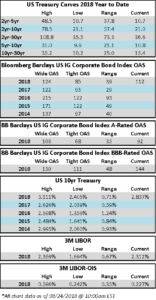
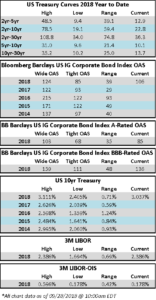
Corporate credit spreads are largely unchanged on the week. As expected, the Fed increased the Federal Funds Target Rate by 25 basis points on Thursday to an upper bound of 2.25%. This was the third rate hike of 2018 and the 8th increase in the current tightening cycle which began in December of 2015. Notably, the 10yr Treasury has trended modestly lower on the back of the Fed announcement –it was as high as 3.07% at noon on Thursday but today it is at 3.04% as we go to print.
According to Wells Fargo, IG fund flows decelerated once again during the week of September 20-September 26 and were +$779 million during the week. IG fund flows are now +$97.141 billion YTD.
According to Bloomberg, issuance on the week is going to come in at $12.7bln, as there is a small deal pending this Friday morning. This brings the September new issuance tally to $122.9bln and the YTD tally to over $895bn. September has now passed January as the month with the most issuance so far in 2018.
(Bloomberg) Why Comcast Is Paying Dearly for Britain’s Sky
- Pay-TV subscriptions are still growing in Europe, and Comcast’s $39 billion purchase of Sky Plc gives it global reach.
- The Sky deal would propel Comcast’s debt to at least $100 billion, placing the company among a small group that have borrowed that much, including AT&T Inc., which in June closed on its $85 billion purchase of Time Warner Inc. The debt could go even higher now that Fox on Sept. 26 said it will sell Comcast its 39 percent stake in Sky, worth more than $15 billion—a decision that required approval from Walt Disney Co., which is buying most of Fox.
- Comcast executives say they’re confident they can generate enough cash flow to pay down their debt over time. For now, the company’s credit ratings are unchanged, though an S&P Global Ratings analyst has given it a negative outlook. But the success of the deal depends on continued strength at its U.S. business and the combined TV giants fending off the global rise of streaming rivals Netflix Inc. and Amazon.com Inc.
- Sky is essentially Comcast’s European twin, with about 23 million customers, mostly in the U.K. and Ireland. With Sky, the U.S. company would almost double its customer base. Like Comcast and its X1, Sky sells a box called Sky Q, which has a slick interface that makes it easier to find what to watch—and provides a rich source of data on customer viewing habits. Unlike Comcast, Sky is still gaining video customers.
- The two companies could benefit from being under the same roof. For instance, Comcast and Sky could have their studios team up to create more original TV shows for Sky’s online service. That could provide a bulwark against the rise of Netflix, Amazon, and Home Box Office Inc., which are spending billions of dollars in a global race for online TV customers, especially in Europe. Perhaps most important, as more Americans drop their cable-TV subscriptions, Sky offers Comcast a foothold on a continent where cord-cutting hasn’t taken off yet.
(Bloomberg) Abbott Laboratories EU3.42b Debt Offering in 3 Parts
- Use Of Proceeds: To repay all or portions of Abbott’s outstanding 2.00% notes due 2020, 4.125% notes due 2020, 3.25% notes due 2023, 3.4% notes due 2023, and 3.75% notes due 2026, and for fees, expenses, and other costs associated therewith
- CAM Comment: According to BVAL the OAS on ABT 3.75% 2026 has tightened 25bps in the month of September 2018
(Bloomberg) All four of the Vogtle 3 & 4 co-owners vote to move forward with construction of nuclear expansion project
- All four of the Vogtle 3 & 4 project co-owners (Georgia Power, Oglethorpe Power, MEAG Power and Dalton Utilities) have voted to continue construction of the two new nuclear units near Waynesboro, Ga.
- The new units are the first to be built in the United States in more than 30 years and the only new nuclear units currently under construction in America. Expected on-line in November 2021 (Unit 3) and November 2022 (Unit 4), the new units are expected to generate enough emission-free electricity to power approximately 500,000 homes and businesses.
(Bloomberg) AerCap takes Delivery of its First Boeing 737 MAX
- AerCap Holdings N.V. has today announced that it has taken delivery of its first 737 MAX 8. The aircraft will be leased to China Southern Airlines, the first of 5 aircraft to go on lease to the airline from AerCap’s 737 MAX order book with Boeing.
- AerCap has a total of 104 Boeing 737 MAX aircraft owned and on order, delivering through 2022.
(Bloomberg) Bill Ford Sees No Crisis While Fitch Warns of Challenging Times
- Ford Motor Co. has work to do to reverse its declining fortunes but isn’t a company in crisis, Executive Chairman Bill Ford said Thursday, while the Fitch Ratings service warned of challenging times ahead for the automaker.
- “I don’t think it’s even close to a crisis — we’re making good profitability,” Ford told reporters at a centennial celebration of the company’s Rouge manufacturing complex near its headquarters in Dearborn, Michigan. “Do we still have work to do? Yes, we do. But we are investing heavily in the product. We’re investing heavily in the future. And there’s nothing that we want to do that we can’t do.”
- Fitch Ratings today warned of risks Ford faces in its $11 billion restructuring, which the automaker said could take five years. Moody’s Investor Service lowered Ford’s credit rating last month to one notch above junk on concerns about executing that overhaul.
- “The company has entered a challenging period, despite a strong liquidity position,” Stephen Brown, Fitch senior director, wrote in a note on Ford. “With the recent cost pressures, there is less headroom in the ratings, which heightens the potential for a negative rating action if it appears the transformation program is not meeting expected milestones.”
