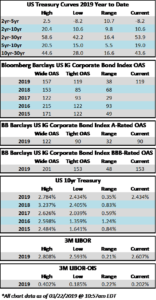
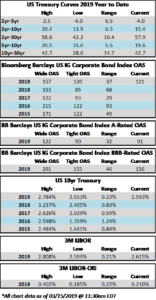
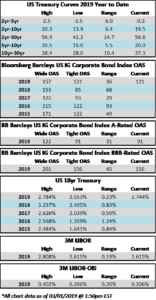
Fund Flows & Issuance: According to Wells Fargo, IG fund flows for the week of April 26-May 2 were positive, with an inflow of $2.6 billion. According to data analyzed by Wells Fargo, IG funds have garnered $59.1 billion in net inflows YTD.
According to Bloomberg, $21.775bn in new corporate debt priced during the week. This brings the YTD total to $430.595bn.
The Bloomberg Barclays US IG Corporate Bond Index closed on Thursday with an OAS of 111, a new YTD wide. The 10yr treasury rallied this week and now sits at 2.914% as we go to print, after reaching a high of 3.026% the week prior.
(Bloomberg) U.S. Payrolls Rebound to 164,000 Gain; Jobless Rate Hits 3.9%
U.S. hiring rebounded in April and the unemployment rate dropped below 4 percent for the first time since 2000, while wage gains unexpectedly cooled, suggesting the labor market still has slack to absorb.
Payrolls rose 164,000 after an upwardly revised 135,000 advance, Labor Department figures showed Friday. The jobless rate fell to 3.9 percent, the lowest since December 2000, after six months at 4.1 percent. Average hourlyearnings increased 0.1 percent from the prior month and 2.6 percent from a year earlier, both less than projected.
Despite the softer-than-expected wage reading, an unemployment rate drifting further below Federal Reserve officials’ estimates of levels sustainable in the long run may in their view add to upward pressure on wages and inflation. That would keep the central bank on track to raise interest rates in June for the second time this year and potentially one or two more times after that in 2018.
The results may also reinforce forecasts for a rebound in economic growth this quarter after a slowdown in the first three months of the year, with the labor market supporting gains in consumer spending that may be further fueled by tax cuts. Companies in industries from services to manufacturing are hungry for workers, indicating hiring is likely to stay solid.
The median estimate of analysts was for a gain of 193,000 jobs, with projections ranging from 145,000 to 255,000. Revisions to prior reports added a total of 30,000 jobs to payrolls in the previous two months, according to the figures, resulting in a three-month average of 208,000.
(Bloomberg) High-Grade Index Sets New 2018 Wide
Credit continues to leak wider, underscored by the Bloomberg Barclays IG OAS index setting a new 2018 wide mark of +111 Thursday, a level not seen since September. The HY index also closed at the widest level in nearly a month. The IG primary market was active yesterday with more than $8 billion pricing, dominated by corporate borrowers.
(Bloomberg) Flipkart Board Is Said to Approve $15 Billion Walmart Deal
The board of Flipkart Online Services Pvt has approved an agreement to sell about 75 percent of the company to a Walmart Inc.-led group for approximately $15 billion, according to people familiar with the matter, an enormous bet by the American retailer on international expansion.
Under the proposed deal, SoftBank Group Corp. will sell all of the 20-plus percent stake it holds in Flipkart through an investment fund at a valuation of roughly $20 billion, said the people, asking not to be named because the matter is private. Google-parent Alphabet Inc. is likely to participate in the investment with Walmart, said one of the people. A final close is expected within 10 days, though terms could still change and a deal isn’t certain, they said.
That would seal a Walmart triumph over Amazon.com Inc., which has been trying to take control of Flipkart with a competing offer. Flipkart’s board ultimately decided a deal with Walmart is more likely to win regulatory approval because Amazon is the No. 2 e-commerce operator in India behind Flipkart and its primary competitor. Amazon is out of the running unless Walmart hits unforeseen trouble.
If completed, the deal will give Bentonville, Arkansas-based Walmart a leading position in the growing market of 1.3 billion people and a chance to rebuild its reputation online. The world’s largest retailer has struggled against Amazon as consumers increase their spending on the internet. India is the next big potential prize after the U.S. and China, where foreign retailers have made little progress against Alibaba Group Holding Ltd.
Fund Flows & Issuance: According to Wells Fargo, IG fund flows for the week of April 19-April 25 were positive, with an inflow of $3.5bn, driven primarily by ETFs, which posted their largest net inflow in over a year. According to data analyzed by Wells Fargo, IG funds have garnered $56.4 billion in net inflows YTD.
According to Bloomberg, $20.95bn in new corporate debt priced during the week. This brings the YTD total to $413.12bn. Historically, May is typically a robust month for new corporate bond issuance and the general consensus on the street is that issuance will pick up in the month of May as companies exit earnings blackout.
The Bloomberg Barclays US IG Corporate Bond Index closed on Thursday with an OAS of 108, while the 10yr treasury breached the 3.00% threshold this week for the first time since January of 2014.
(Bloomberg) BofA Says Rising Rates Boost Appeal of High-Grade Bonds For Now
The highest Treasury yield since 2014 is good news for the investment-grade corporate bond market, bringing back investors who’ve been put off by low payouts previously, Hans Mikkelsen, high-grade bond strategist at Bank of America Merrill Lynch, said in phone interview.
“If you look at credit spreads, rates at these levels are positive for the investment-grade market, especially in the back end of the yield curve,” Mikkelsen said. “This market actually has quite a lot of yield-sensitive investors who buy more when rates go up, which makes it different than other asset classes.”
These include insurance companies, pension funds, and foreign buyers, which will buy more since the rate rise this time is modest, controlled, and fairly contained, he said. “It would take a much further uptick for them to sell.”
On the other hand, If returns deteriorate, “there might be more of a negative feedback loop” for bond funds and ETFs, because those funds would typically buy less, Mikkelsen added. “And if we went to 4% within two weeks, that wouldn’t be good either, as interest-rate volatility and uncertainty matters more to IG investors than the interest rate level itself.”
Investment-grade spreads widened last night following the market close Wednesday. Treasury yields have fallen from highs yesterday, with 10-year back below 3%
(Advisor Perspectives) Dan Fuss – Only Two Things Can Stop Rates from Rising
As his 60-year tenure attests, Dan Fuss is one of the most respected bond investors. In my interview with Fuss last week, he explained why it would take either a geopolitical crisis or an economic collapse to drive rates lower. Fuss also said investors should exercise caution in bond ETF markets that are exposed to liquidity shocks.
According to Fuss, existing deflationary forces in the global economy would not be enough to drive rates lower.
This is not the first time Fuss has forecasted higher rates. In October 2017, Fuss advised investors to exercise caution by building reserves, and suggested that they position themselves for an environment of rising interest rates. He also did so in October 2015, March 2015, and October 2013, causing his fund to miss the full benefit of bond rally in 2014. In April 2012 he made a similar, but incorrect, prediction.
(WPO) What Comcast’s $31 Billion Offer for a U.K. TV Company Tells Us About the Cable Giant’s Ambitions
Comcast said Wednesday that it’s offering $31 billion to buy the British TV provider Sky, officially starting a bidding war between the U.S. cable giant and 21st Century Fox, which has offered $16.5 billion for the company.
But why is a U.K.-based television company such a sought-after piece of property, and what could a deal mean for Comcast’s customers?
The answer can be found in Comcast chief executive Brian Roberts’s remarks to investors on an earnings call Wednesday morning.
“It’s a unique asset,” Roberts said. “It fits well with the assets we’ve already got. … A benefit is, you’d get new geographies and additional scale that gives you optionality.”
In other words, a deal would give Comcast access to a bigger overseas audience and — according to industry analysts — new TV programming.
Media and entertainment companies are increasingly consolidating — Time Warner, for example, is seeking to merge with AT&T for $85 billion. And it looks as though Comcast also is seeking additional opportunities in this space
But unlike AT&T-Time Warner, which AT&T casts as a make-or-break bet as the telco tries to compete with Google and Facebook with a data-driven ad business, Comcast is emphasizing the optional nature of its offer for Sky. It’s simply a good opportunity and the best use of Comcast’s money right now, Roberts told analysts on the call.
Fund Flows & Issuance: According to a Wells Fargo report, flows week to date were -$2.0 billion and year to date flows stand at -$25.1 billion. New issuance for the week was $6.2 billion and year to date HY is at $75.2 billion, which is -22% over the same period last year.
(Bloomberg) High Yield Market Highlights
Despite another week of substantial fund outflow, junk bonds appear to have found support. BB yields fell the most in more than five months as Treasuries firmed, equities rebounded, the VIX fell and oil steadied.
Stung by the recent rise in Treasury yields and equity volatility, nervous high yield investors once again withdrew cash from high yield funds
High yield primary looked resilient as new issues saw strong demand this week
WeWork, a single-B credit with uncertain cash flow, got orders of ~$2.5b-$3b
Flora Food increased size of issuance and priced at tight end of talk
Jagged Peak Energy had orders 5x the size of the original offering, also priced at tight end of talk
CCCs continued to outperform BBs and single-Bs, with positive YTW returns of 1.11%, reflecting willingness of investors to add credit risk
(Reuters) T-Mobile, Sprint make progress in talks, aim for deal next week
S. wireless carriers T-Mobile US Inc and Sprint Corp have made progress in negotiating merger terms and are aiming to successfully complete deal talks as early as next week, people familiar with the matter said on Thursday.
The combined company would have more than 127 million customers and could create more formidable competition for the No.1 and No.2 wireless players, Verizon Communications Inc and AT&T Inc, amid a race to expand offerings in 5G, the next generation of wireless technology.
T-Mobile majority-owner Deutsche Telekom and Japan’s SoftBank Group Corp, which controls Sprint, are considering an agreement that would dictate how they exercise voting control over the combined company, two of the sources said.
This could allow Deutsche Telekom to consolidate the combined company on its books, even without owning a majority stake, the sources added. Deutsche Telekom owns more than 63 percent of T-Mobile, while SoftBank owns 84.7 percent of Sprint.
Deutsche Telekom and T-Mobile are also in the process of finalising the debt financing package they will use to fund the deal, the sources said.
Spectrum Brands reported results from continuing operations for the second quarter of fiscal 2018 and lowered its fiscal 2018 full-year guidance.
Separately this morning, the Company announced that Executive Chairman David M. Maura has been named Chief Executive Officer, effective immediately, replacing Andreas Rouvé, who has stepped down as CEO and a Director, and that its Board of Directors has authorized a new three-year, $1 billion share repurchase program.
Spectrum Brands announced on January 3, 2018 that it was exploring strategic options for its Global Batteries & Appliances (GBA) businesses with the intention to sell the units by December 31, 2018. As a result, effective with the Company’s fiscal 2018 first quarter financial results, the GBA segment has been reclassified as held for sale and is now reported as discontinued operations for the second quarter and six months of fiscal 2018 and the comparable prior-year periods.
“While our second quarter performance was very disappointing, we believe it is in no way reflective of the underlying earnings power of our continuing operations,” said David Maura, Chief Executive Officer of Spectrum Brands Holdings.
“The challenges related to our two greenfield manufacturing and distribution projects were meaningfully greater than we expected. As we brought our East Coast distribution center into our new Hardware & Home Improvement facility in Edgerton, Kansas at the end of February, we experienced facility-wide disruptions which hampered distribution capabilities materially in March,” Maura said. “Our Global Auto Care facility in Dayton struggled at higher production levels in March, which led to significant inefficiencies and shipping challenges.
“Given these issues, sales of about $30 million from in-house orders could not be shipped by quarter-end due to higher customer order backlogs at our HHI and GAC facilities, and we are working to return them to normal efficiency levels,” he said. “In addition, cold and wet weather in March hurt Home & Garden revenues by about $10 million as POS declined and retailers delayed orders into April.
“Our Pet business was impacted, as expected, by the exit of a European pet food customer tolling agreement and from lost rawhide distribution from our recall of last spring that we will lap in June,” Maura said. “Together, these items total about $12 million of revenues in our Pet business.
“In addition, external cost headwinds and mix combined to deliver a significant negative impact on our sales and margins,” Maura said. “While we expect improvement in the back half of the year, the magnitude of our second quarter shortfall and manufacturing and distribution center start-up inefficiencies has caused us to lower our full-year adjusted EBITDA guidance from continuing operations by $57 million at the mid-point and adjusted free cash flow on a total company basis by $135 million.”
Fund Flows & Issuance: According to Wells Fargo, IG fund flows for the week of April 12-April 18 were negative, posting an outflow of $1.2bn. According to data analyzed by Wells Fargo, IG funds have garnered $53 billion in net inflows YTD, which is less than half the amount of net inflows recorded in the first four months of 2017.
The IG new issue calendar saw its most active week since the week ending March 9th. U.S. banks led the way as they began to bring new bond deals coincident with earnings reports. According to Bloomberg, $36.4bn in new corporate debt priced during the week. This brings the YTD total to $392.17bn, which is down 14% year over year. 2018 issuance will see a significant impact pending regulatory reviews of large M&A deal such as AT&T/Time Warner and Bayer/Monsanto, among others.
The Bloomberg Barclays US IG Corporate Bond Index opened on Friday with an OAS of 106.
(Bloomberg) Dealers Kicking Abbott Debt to Curb Missed Out on Outperformance
Abbott Laboratories’ debt has outperformed peers in 2018 following Moody’s upgrade and positive outlook in February.
The Abbott Labs’ bonds have outperformed similarly dated BBB tier health-care and pharmaceutical debt by about 90 bps in 2018, including issues from Thermo Fisher, CVS and Mylan, driven by debt pay down and an upgrade by Moody’s in February.
Dealers have been net sellers of Abbott debt over the past three months, notably at the front-end of the curve, including the 2.35% bonds due in 2019, 2.9% bonds due in 2021 and 3.75% bonds of 2026.
(WSJ) Morgan Stanley Posts Record Earnings, Revenue
Morgan Stanley MS on Wednesday reported record quarterly profits, the last of the big U.S. banks to benefit from a potent cocktail of lower taxes, active markets, lower expenses and economies growing in lockstep.
The Wall Street firm’s first-quarter profits of $2.6 billion and revenues of $11.1 billion were both record highs after reflecting accounting adjustments and jettisoned businesses. Morgan Stanley’s traders had their best quarter since 2009, riding a wave of increased volume and volatility that also aided rivals, including Goldman Sachs Group Inc. and JPMorgan Chase & Co.
Combined profits at the six largest U.S. banks, which all reported first-quarter results in recent days, rose 24% from a year ago, outpacing an 18% rise in revenues. Meanwhile, the banks’ level of profitability as measured by the return they generate on their equity—a key gauge for shareholders—rose to its highest level in years.
The first quarter is typically the strongest of the year for banks. Investors put on new positions, which boost trading results, and companies raise money to fund new projects, which spurs lending and underwriting.
(WSJ, Press Release) Crown Castle Reports First Quarter 2018 Results and Raises Outlook for Full Year 2018
“After another quarter of very good financial and operating performance in the first quarter, we remain excited about the opportunities for our business to support growing data demand in the U.S.,” stated Jay Brown, Crown Castle’s Chief Executive Officer.
“We continue to see tremendous activity across our unique portfolio of infrastructure assets. In our tower business, we have recently signed comprehensive leasing agreements with several of our largest customers, which we believe signals the beginning of a sustained period of infrastructure investments by our customers.
In our fiber business, the volume of small cell bookings in the first quarter was comparable to what we booked during all of 2016, resulting in an increase in our contracted pipeline to more than 30,000 nodes. We also continue to make very good progress on integrating our recent fiber acquisitions.
We believe our unique value proposition as a shared communications infrastructure provider will allow us to translate the growing demand for data into growth in cash flows and, thus, deliver on our 7% to 8% annual growth target in dividends per share.”+
Crown Castle owns, operates and leases more than 40,000 cell towers and approximately 60,000 route miles of fiber supporting small cells and fiber solutions across every major U.S. market. This nationwide portfolio of communications infrastructure connects cities and communities to essential data, technology and wireless service – bringing information, ideas and innovations to the people and businesses that need them.
(Bloomberg) Global Yield Surge Defies Skepticism on Inflation’s Momentum
Rising inflation expectations in the world’s biggest economy are pushing up U.S. benchmark yields, putting pressure on rates to climb around the world and causing more than a few heads to swivel.
Federal Reserve officials may be attempting to tamp down concern of a U.S. price surge, but it hasn’t stopped yields from Tokyo to Frankfurt and New Yorkticking higher. In fact the yield of a $51 trillion Bloomberg Barclays index of global sovereigns and corporate debt is nearing a four-year high of 1.949 percent.
Yet even as April’s surge in raw materials drives inflation bets and those higher yields, the moves are relatively gentle. Treasury long-bond rates remain below February highs, and that suggests bond traders are so far taking events in stride.
“Actually there’s no overconcern yet in the market of inflation drifting dramatically higher — if you look at long, medium or short Treasuries,” said Joe Lovrics, Citigroup Inc.’s Iberia Markets head in Madrid. “In fact there’s a growing group talking about the U.S. economy actually cooling now.”
Although Fed official Loretta Mester mentioned inflation 18 times in a preparedspeech Thursday, she concluded it probably won’t pick up sharply even as unemployment is likely to fall below 4 percent this year and remain there through 2019.
In Europe, where the European Central Bank’s unconventional stimulus has been crushing rates since 2015, ECB President Mario Draghi is seen taking longer to lay out its plan to exit that program as protectionism threatens the euro-area outlook, economists said in a Bloomberg survey.
While there has been some market excitement this year over the potential return of inflation and a possible bond bear market, a number of other factors having been fueling yield increases, according to Lovrics.
“We’ve had an unexpected rally in oil, tax stimulus, strong employment in the U.S. plus Fed remarks about rising inflation, and this kind of feeds on itself,” he said.
Fund Flows & Issuance: According to a Wells Fargo report, flows week to date were $0.6 billion and year to date flows stand at -$23.6 billion. New issuance for the week was $3.7 billion and year to date HY is at $65.0 billion, which is -27% over the same period last year.
(Bloomberg) High Yield Market Highlights
Junk bond spreads tightened the most in nine weeks and CCC yields fell to a 5-week low as U.S. funds saw inflows and the year-to-date return turned positive.
Yields dropped across ratings in 6 of the last 9 sessions and have fallen for 4 consecutive sessions this week, amid strong technicals boosted by light supply, and WTI oil at a 40-month high
Spreads have narrowed in seven of last nine sessions
Year-to-date returns for junk bonds turned positive for the first time since early February, with a gain of 0.05% in the index, compared to a 2.38% loss in IG
Resilient junk bonds brought investors home after more than 10 weeks of no material inflow
Rebounding equities, steadily declining volatility — with the VIX hovering near and below 20 for last two weeks — boosted junk bonds
Supply is expected to be light as the earnings season was in progress
New issue pricing reinforced the strength of high yield as Drax Finco and J.B. Poindexter priced at the tight end of talk, with orders more than 3x the offer
Earlier this week, TopBuild advanced its pricing schedule, increased the size of the offer, priced at the middle of talk, suggesting junk investors were not avoiding risk
CCCs continued to outperform BBs and single Bs, with positive YTD returns of 1.25%, BBs were the worst with negative YTD returns of 0.92%, single-Bs turned positive with 0.54%
(Reuters) Icahn to sell Federal-Mogul to Tenneco for $5.4 billion
Activist investor Carl Icahn said on Tuesday he was selling auto parts maker Federal-Mogul to Tenneco Inc in a $5.4 billion deal, unloading an investment he has held for nearly two decades and picking up a new stake in Tenneco.
Tenneco plans to separate into two independent, publicly traded companies – one focusing on powertrain products and the other on auto parts such as suspensions and axle dampers – after the deal closes.
The new bulked up powertrain technology company will likely benefit from the fact that internal combustion engine parts and tailpipe exhaust scrubbing technology will be needed by automakers for a long time to come, before they can be replaced by newer technologies such as fully electric cars.
The aftermarket parts company would provide a potentially steady cash flow.
“Going to market with well-recognized brands, more product categories, greater coverage and expanded distribution capabilities is a strong formula for capturing growth, particularly in China,” Tenneco Executive Chairman Gregg Sherrill said.
(Forbes) Why T-Mobile And Sprint Are Rekindling Their Merger Talks
Sprint and T-Mobile appear to be back at the negotiating table, marking the third time that the two companies are exploring a potential combination. While a potential merger is likely a net positive for both companies and the broader U.S. wireless industry, it remains unclear as to how much has changed since the two companies called off their last round of merger talks in 2017.
The biggest reason the two carriers are looking to restart talks is likely to avoid the duplication of future capital expenditures, as the wireless industry transitions from 4G technology to next-generation 5G technology. Sprint has a deep portfolio of 2.5 GHz spectrum holdings that could be used for 5G deployment, allowing the combined company to avoid some outlays that they may otherwise have to undertake individually. Moreover, wireless is a very high fixed cost business, on account of sizable network operation and maintenance costs as well as sales and marketing expenses. The present value of synergies stemming from a deal could stand at upwards of $20 billion.Additionally, the carriers may also have better pricing power in a saturating wireless market if a deal goes through.
The last round of talks fell through in late 2017, as the two companies were unable to agree on who would have control over the combined entity, and it’s not clear how much has changed since last year. T-Mobile’s majority owner Deutsche Telekom (which owns a ~63% stake) apparently views its ability to consolidate T-Mobile’s earnings with its financials as key, given that the U.S. carrier is one of its most valuable assets. This means that the company could be willing to put in more money to increase its effective stake in the joint entity and retain control. While Sprint is likely to have less bargaining leverage in a potential deal, considering its comparatively challenging financial position, with over $30 billion in long-term debt, its parent Softbank may still want to keep control of the joint entity. Softbank has been doubling down on the Internet of Things space, and it’s likely that it views Sprint as a crucial part of this plan, given its nationwide wireless network in the U.S.
(Wall Street Journal) Wynn Resorts in Early Talks to Sell Boston-Area Casino Project to MGM
Wynn Resorts has been in talks to sell its partially built Boston-area casino project to rival MGM Resorts International, MGM according to people familiar with the matter, as Massachusetts regulators continue their investigation into the company’s handling of sexual-misconduct allegations against founder Steve Wynn.
The talks, which are over the Wynn Boston Harbor property and no other parts of the company’s gambling empire, are at an early stage and may not result in a deal, the people said.
Regulatory issues surrounding any potential deal would be complex, since Massachusetts forbids companies from operating more than one casino in the state, and MGM is planning to open one in Springfield soon, they added.
Wynn Resorts estimates the Massachusetts project, scheduled to open next year, will cost a total of $2.5 billion to build, making it one of the largest U.S. casino projects ever undertaken outside Las Vegas.
Fund Flows & Issuance: According to a Wells Fargo report, flows week to date were -$0.2 billion and year to date flows stand at -$24.2 billion. New issuance for the week was $1.8 billion and year to date HY is at $60.0 billion, which is -28% over the same period last year.
(Bloomberg) High Yield Market Highlights
Junk bond yields continued to head south as they dropped to a two-month low at close, with the biggest decline in more than seven weeks. Yields fell across ratings for three consecutive sessions.
Spreads also tightened across ratings and saw the largest move in more than seven weeks as stocks continued to climb; the VIX dropped to a two-week low
Strength and resilience of the market was also reflected in the pricing of two drive-by offerings amid 11 weeks of outflows from retail funds
Two drive-by bond offerings were from the energy sector – Resolute Energy and Targa Resources; Targa Resources had orders of more than $3b and priced in the middle of talk
Primary market priced four deals for $1.8b, which suggested junk bond investors were not heading to the exit
While yields dropped and spreads tightened, junk investors have turned increasingly cautious and selective in credit-picking, a mood reflected in the pricing of American Greetings Corp yesterday
AM was the second deal this week after McDermott International to price at a deep discount and offer double-digit yields
CCCs continued to beat BBs and single-Bs with positive YTD returns of 0.55%
CCCs still beat stocks and investment-grade bonds, with IG’s YTD returns negative 2.68%
BBs were the worst with negative YTD returns of 1.41%, followed by single-Bs negative 0.24%
The default rate should move lower in 2018 amid a growing economy and improving credit conditions in the commodity sector, Moody’s John Puchalla wrote in note
(Business Wire) Wireless Carrier Selects Zayo for Significant National Expansion
A major wireless carrier has selected Zayo for fiber-to-the-tower (FTT) to new macro towers in 30 markets across 21 states. The deal is an expansion of an agreement announced in September 2016. Inclusive of both contracts, Zayo will connect thousands of macro towers for the customer. The contract is Zayo’s largest mobile infrastructure contract to date.
The solution includes deployment of dark fiber infrastructure, in some cases replacing legacy Ethernet. The new infrastructure will support the carrier’s strategy of improving coverage and capacity across its network to accommodate increasing traffic and to prepare for 5G. The deployment will leverage Zayo’s existing fiber network and includes construction of hundreds of route miles of fiber.
“This undertaking is the result of a trusted relationship with the customer,” said Dan Caruso, chairman and CEO of Zayo. “As they continue to densify to meet the growing demand for bandwidth, dark fiber provides the optimal long-term solution.”
This agreement pertains to macro towers. Under other contracts, Zayo is deploying small cell infrastructure for this customer. In many cases, these are full turnkey implementations, including RF design, site acquisition, permitting and installation of equipment.
(Bloomberg) AMC Cinemas Tiptoes Into Saudi Arabia as Theater Ban Lifted
AMC Entertainment, controlled by China’s Dalian Wanda, was granted the first cinema license in Saudi Arabia and plans to open 100 theaters with the country’s Public Investment Fund.
AMC, the world’s largest exhibitor, and the Development & Investment Entertainment Co., a subsidiary of Saudi Arabia’s PIF, plan to open as many as 40 cinemas within five years and 60 more by 2030, according to a statement Wednesday from the Leawood, Kansas-based company.
There are no commercial theaters in Saudi Arabia and plans to open them present challenges for the conservative kingdom, such as whether men and women can sit together and what types of movies will play. The partners are aiming for “50 percent market share of the Saudi Arabian movie theater industry,” the parties said. The first AMC in Saudi Arabia will open in the capital Riyadh on April 18.
The announcement coincides with the U.S. visit by Crown Prince Mohammed bin Salman, who is looking to burnish his image as the leader of a more open Saudi economy.
(Modern Healthcare) Dialysis industry on alert as Calif. union pushes for reimbursement cap
A California fight between dialysis clinics and a major hospital workers’ union has healthcare industry investors and stakeholders jittery as the union gets ready to push a ballot initiative to cap private insurance reimbursements for dialysis.
The Service Employees International Union–United Healthcare Workers West, one of the country’s largest hospital workers’ unions, has gathered more than 600,000 voter signatures for a statewide ballot measure to cut off dialysis clinics’ commercial insurance reimbursement at 115% of care costs, which would slash their current rates.
The union claims the proposal would pressure clinics to improve care for dialysis patients by reinvesting extra revenue into staffing and other efforts to raise standards in order to bump up the cost of care.
But critics of the initiative say the measure could spur reverberating losses for corporate dialysis giants, hospitals and even state and federal coffers.
Most of dialysis market in California belongs to Colorado-based DaVita Healthcare Partners and the German company Fresenius Medical Care, who have about 70% of the state market share. The 30% remaining market share belongs to independent or not-for-profit clinics. California has just under 600 dialysis clinics.
California has an extra high rate of growth in dialysis patients — about 5% every year — and there are already more than 68,000 dialysis patients in the state.
But SEIU members say dialysis clinic regulations are far too lax, and facilities have been plagued by issues like rat and cockroach infestations or staffing shortages that leave technicians with only minutes to clean up stations before another patient receives treatment.
“With regards to staffing it’s a free-for-all,” said union member and longtime dialysis technician Emanuel Gonzales, who is helping to lead the union campaign and has worked in several dialysis centers across San Bernardino County and the Inland Empire in California. “They pretty much operate anyway they like. If something happens, they could blame workers.”
The first quarter of 2018 saw credit spread volatility for the first time since early 2016. The Bloomberg Barclays US Investment Grade Corporate Bond Index started the year at a spread of 93 basis points over treasuries and narrowed to 85 on February 2nd which was the tightest level since 2007. From mid‐February onward, spreads finished the quarter wider, increasing to a spread of 109 basis points over treasuries. Recall that, if Treasury rates are held constant, tighter spreads mean bonds have increased in value while wider spreads mean those valuations have decreased. Treasury rates also impacted the performance of corporate bonds in the quarter. The 10yr Treasury started the year at 2.41% and closed as high as 2.95% on February 21st, before it finished the quarter at 2.74%. The combination of credit spreads that were 16 basis points wider and a 33 basis point increase in the 10yr Treasury was too great of a headwind for corporate credit during the quarter, and as a result the Bloomberg Barclays IG Corporate Index posted a negative return of ‐2.32%. This compares to CAM’s gross total return of ‐ 2.50%. By design, relative to the index, CAM is overweight higher quality credit (A‐rated) and underweight lower quality credit (BBB‐rated). Even though the index posted negative returns for the first quarter of 2018, the lower quality portions of the index outperformed the higher quality portions, a trend that has persisted since 2017.
As we have stated in previous commentaries, we expect that, over the longer term, this trend will reverse, and those investors who have favored higher quality and avoided the temptation of “reaching for yield” will be rewarded with outperformance over a longer time horizon.
Generally speaking, the economy has been stable and the backdrop for corporate credit has not deteriorated, yet this was the worst first quarter for corporate credit since 1996, when returns for the index started the year at ‐ 2.58%. So why then did corporate credit perform poorly during the first quarter? First, credit spreads experienced 16 basis points of spread widening, which has a negative impact on performance. Spreads generally go wider because investors are demanding more compensation for credit risk. As you can see from the above chart, a 16 basis point change in spreads is not that significant compared to the ranges that we have seen throughout the last 4 full years. What can impact credit as much or more than spreads is the overall level of interest rates. A 33 basis point move higher in the 10yr Treasury during the quarter, and a 35 basis point move higher in the 5yr Treasury are significant moves given the overall low level of interest rates. A concept called duration comes into play when
discussing these rate moves. The duration of The Investment Grade Corporate Bond Index at the end of March was 7.56. What this means is that, all else being equal, a 100 basis point increase in interest rates would yield a 7.56% drop in the value of a bond portfolio. So, a 50 basis point increase, all else being equal, would yield a 3.78% drop in the value of a bond portfolio. Conversely, a decrease in Treasury rates would increase the value of your bond portfolio. Now, rarely in the real world, do all other things remain equal, but the power of duration was the main driver of poor returns for corporate bonds during the quarter.
At Cincinnati Asset Management, our view on interest rates is that of an agnostic. We consistently position the portfolio in intermediate maturities that are 5 to 10yrs from maturity. Over the medium and longer term time horizons we have observed that this is the ideal place from the standpoint of maximizing the steepness of both the yield curve and the corporate credit curve. A key point to note regarding duration is that it decreases over time. With each passing day, a bond gets closer to its final maturity date, and the bond valuation gets closer to its par value as it approaches maturity – after all, a bond is a contractual agreement where the company that issued the bond has agreed to make a series of semiannual coupon payments to the holder over a specified period of time and it has also agreed to return the par value of the bond at maturity. The 9yr bond that was purchased in your account yesterday will be an 8.5 year bond in 6 months. Someday, it will be a 5yr bond, at which point it likely makes sense to extend from 5yrs back to somewhere in the 7‐10yr portion of the curve, depending on what offers the most attractive valuation at that point in time. We at CAM are extremely confident that we cannot predict where rates will go next. We only know that they will go higher, lower or stay the same. Now, to be sure, we will always select the shortest maturity in that 5‐10yr range that maximizes valuation along the Treasury curve. We have been finding quite a bit of value in 8‐9 year bonds so far in 2018 whereas there are other points in time where 10yr or 7yr bonds make more sense. Where we add the most value for our clients is in the assessment and ongoing monitoring of credit risk. Rates are going to do what they are going to do, but the credit risk associated with individual companies can be studied, researched and managed. When you invest your money with CAM, you are not buying an unmanaged, passive index. Our goal is to populate each client portfolio with the bonds of individual companies that offer the most compelling risk reward at that particular point in time.
As we turn to the second quarter we are seeing what we believe are reasonably compelling valuations in corporate credit. Higher underlying Treasury rates coincident with somewhat wider spreads have served to create some attractive entry points into defensive credits. Some of these same defensive credits were trading at unattractive valuations just a few short months ago when spreads were tighter and rates were lower. We are also finding value in the financial sector, as those valuations are compelling relative to the industrial sector and the economy is set up well for banks and non‐bank financials to report healthy earnings growth which in turn leads to stable and/or improving balance sheets for financial companies. New issue supply in the market is down 11.3% from 2017i but new issue concessions have risen to an average of 11.5bps which is the highest level in over 2 yearsii. A “new issue concession” is the compensation provided to a buyer of a newly issued corporate bond. For example, if a company has a 10yr bond outstanding with a yield of 4%, and it wants to issue a new 10yr bond to finance a plant expansion, then it will have to provide a concession to investors in the form of extra compensation to incentivize investors to purchase the new bond in the primary market instead of the existing bond in the secondary market. If we take the average concession of 11.5bps then the new bond would have a coupon of 4.115% which would make it attractive relative to the existing bond with a coupon of just 4%. Our access to the institutional primary market is one of the ways which we provide value to our client accounts. During the 1st quarter of 2018, about 25% of our purchase volume was new issuance. This is despite the fact that we did not find a single attractive new issue to purchase during the entire month of March. In other words, we remain even more selective than usual when it comes to primary market opportunities, but we believe we will have plenty of chances in the coming months if concessions remain attractive. Ideally, we would like to make 30‐35% of our purchases at attractive levels in the primary market.
A recurring theme for us in our commentaries is the proliferation of lower rated (BBB) credit in the investment grade universe in recent years, as BBB rated debt has increased from 33% to 50% of the index in the past decade. We are pleased to see that this topic is garnering some coverage in the mainstream financial press as the WSJ recently pointed out some of the risks associated with this phenomenon and there are two salient points from a recent article that we believe should give investors pause:
The growth of BBB rated debt to $2.5 trillion from $1.3 trillion 5 years ago, and
The yield premium on BBB debt relative to treasuries which stood at 1.34% at the end of March 2018 down from over 2.75% at the beginning of 2016iii.
At CAM we target a weighting of less than 30% for our allocation to the riskier portion of the investment grade universe, which is BBB rated credit. Our concern with the growth in this lower rated portion of the market is the question of what could happen when the current credit cycle runs its course. If we were to experience a shock to the credit markets or a recession, then there is a portion of the corporate bond universe that is rated low‐single‐A that would be at risk of falling to BBB, further increasing the weighting of the risker portion of the market. More than that, there is a risk that many companies, who are rated low‐BBB, or barely investment grade, would be in danger of falling to high yield. The risk profile of a credit that is investment grade versus high yield can be dramatically different over a longer time horizon. According to Moody’s Investors Service annual default study, the 10yr cumulative default rate for Baa rated credit is just under 4% but that cumulative default rate jumps to north of 16% for credits rated Ba (high yield). This is the type of default risk that our investors are simply not bargaining for when they choose to invest in a high quality investment grade rated portfolio that targets an average credit quality of A3/A‐. These are the type of risks that we attempt to mitigate through our bottom up research process and our focus on the higher quality segment of the investment grade credit market.
In closing, we thank you for your business and your continued confidence in managing your portfolios.
This information is intended solely to report on investment strategies identified by Cincinnati Asset Management. Opinions and estimates offered constitute our judgment and are subject to change without notice, as are statements of financial market trends, which are based on current market conditions. This material is not intended as an offer or solicitation to buy, hold or sell any financial instrument. Fixed income securities may be sensitive to prevailing interest rates. When rates rise the value generally declines. Past performance is not a guarantee of future results. Gross of advisory fee performance does not reflect the deduction of investment advisory fees. Our advisory fees are disclosed in Form ADV Part 2A. Accounts managed through brokerage firm programs usually will include additional fees. Returns are calculated monthly in U.S. dollars and include reinvestment of dividends and interest. The index is unmanaged and does not take into account fees, expenses, and transaction costs. It is shown for comparative purposes and is based on information generally available to the public from sources believed to be reliable. No representation is made to its accuracy or completeness.
i Barclays, April 2nd 2018 “Investment Grade New Issue Supply Analysis”
ii Credit Suisse, April 2nd 2018 “CS Credit Strategy Daily Comment”
iii The Wall Street Journal, April 1st 2018 “The Danger Lurking in a Safe Corner of the Bond Market”
During the first quarter of 2018, the High Yield Market gave back a modest amount of the gains seen in 2016 & 2017. The first quarter return of the Bloomberg Barclays US Corporate High Yield Index (“Index”) return was ‐0.86%. While the total return was negative, the return still bested most of the other asset classes within fixed income.i As seen last year, once again the lowest quality portion of high yield, CCC rated securities, outperformed their higher quality counterparts. As we have stated many times previously, it is important to note that during 2008 and 2015, CCC rated securities recorded negative returns of 49.53% and 12.11%, respectively. We highlight these returns to point out that with outsized positive returns come outsized possible losses, and the volatility of the CCC rated cohort may not be appropriate for many clients’ risk profile and tolerance levels. During the quarter, the Index option adjusted spread widened 11 basis points moving from 343 basis points to 354 basis points. While the Index spread did break the multi‐year low of 323 basis points set in 2014 by reaching 311 basis points in late January, it is still a ways off from the 233 basis points reached in 2007. Every quality grouping of the High Yield Market participated in the spread widening as BB rated securities widened 26 basis points, B rated securities widened 21 basis points, and CCC rated securities widened 28 basis points.
The Other Financial, Transportation, and Other Industrial Sectors were the best performers during the quarter posting returns of 1.03%, .06%, and .00%, respectively. On the other hand, Banking, Consumer Cyclical, and REITs were the worst performers posting returns of ‐2.49%, ‐1.15%, and ‐1.13%, respectively. At the industry level, tobacco, wirelines, retailers, and healthcare all posted strong returns. The tobacco industry (1.92%) posted the highest return. However, restaurants, wireless, supermarkets, and food & beverage had a rough go of it during the quarter. The restaurant industry (‐2.75%) posted the lowest return.
During the first quarter, the high yield primary market posted $72.7 billion in issuance. Importantly, almost three‐quarters of the issuance was used for refinancing activity. That was the highest level of refinancing since 2009. Issuance within Energy comprised just over a quarter of the total issuance. The 2018 first quarter level of issuance was relative to the $98.7 billion posted during the first quarter of 2017. The full year issuance for 2017 was $328.1 billion, making 2017 the strongest year of issuance since the $355.7 posted in 2014.
The Federal Reserve increased the Federal Funds Target Rate three times during 2017. In the first quarter of 2018, Chairman Jerome Powell took over for outgoing Chair Janet Yellen. So far, the Fed has increased the Target Rate just once in 2018 at the March meeting. While the outlook is for three increases this year, Chair Powell plans to “strike a balance between the risk of an overheating economy and the need to keep growth on track.”ii Naturally, the Fed is quite data dependent and the outlook can change as 2018 progresses. While the Target Rate increases tend to have a more immediate impact on the short end of the yield curve, yields on intermediate Treasuries increased 33 basis points over the quarter, as the 10‐year Treasury yield was at 2.74% at March 31st, from 2.41% at the beginning of the quarter. The 5‐year Treasury increased 34 basis points over the quarter, moving to 2.56% at March 31st, from 2.21% at the start of the year. Intermediate term yields more often reflect GDP and expectations for future economic growth and inflation rather than actions taken by the FOMC to adjust the Target Rate. It was the cropping up of inflation concern that was the main driver of the intermediate term yield increase.iii The revised fourth quarter GDP print was 2.9%, and the consensus view of most economists suggests a GDP for 2018 in the upper 2% range with inflation expectations at or above 2%.
Digging into the monthly details a bit should be beneficial in understanding the dynamics of the quarter. January and February were almost entirely about higher rates and inflation fears, with spreads hitting tights at the end of January and then correcting quite a bit in early February. Mid to late February saw spreads begin to come back down to help offset the continued increase of higher Treasury rates. The return of higher spreads in March was more about tempered growth enthusiasm as retail sales growth continued to be sluggish, January durable goods were weak, Atlanta FED’s GDPNow forecasts continued to slide lower, and fears that global trade wars would slow growth further. Interestingly, the 10 year Treasury yield peaked on February 21st versus the 5 year Treasury peaking a month later on March 20th. That flattening is telling as growth expectations came down while the Fed continues a less accommodative posture. According to Wells Fargo, global quantitative easing has been reduced by 50% from the fourth quarter of 2017 to the first quarter of 2018. Lower rated CCC credits underperformed in March after the outperformance displayed in January and February. As the second quarter gets under way, Treasuries are down from the highs, high yield spreads are off the lows, and higher quality credit seems compelling as lower rated credit has finally started to underperform.
The chart to the left is sourced from Bloomberg and is the Chicago Board Options Exchange Volatility Index (“VIX”). The VIX is a market estimate of future volatility in the S&P 500 equity index. It is quite clear that the market has entered a period of higher volatility. In fact, the equity market through the first quarter of 2018 is already much more volatile than all of 2017 as measured by the number of positive and negative 1% days.iv In addition to the volatility witnessed throughout the markets during the first quarter, there have been a few transitions in high profile government posts as well. Jerome Powell began a four‐year term as Chair of the Federal Reserve following the end of Janet Yellen’s single term in that role; economist Larry Kudlow succeeded to director of the National Economic Council after Gary Cohn’s resignation; and Mike Pompeo and John Bolten were nominated as Secretary of State and National Security Adviser, respectively, after Rex Tillerson and HR McMaster were dismissed from the roles.
See Accompanying Endnotes
The Administration has taken action to impose tariffs on steel and aluminum. These actions were taken after a US Department of Commerce report on section 232 of the Trade Expansion Act suggested that the tariffs were justified. Several countries are currently exempt from the tariffs, including Canada and Mexico, likely because of the ongoing NAFTA negotiations. However, there seems to be a fair amount of flexibility going forward to manage the duties as the Administration sees fit. China is taking exception to the tariffs and has responded by imposing their own tariffs on 128 different products.v While 128 products is a seemingly high number, it only amounts to about $3 billion which is just a fraction of total trade between the US and China. This appears to be a negotiation tactic and clearly a developing story over the balance of 2018.
Being a more conservative asset manager, Cincinnati Asset Management remains significantly underweight CCC and lower rated securities. For the first quarter, that focus on higher quality credits was a detriment as our High Yield Composite gross total return underperformed the return of the Bloomberg Barclays US Corporate High Yield Index (‐1.83% versus ‐0.86%). The higher quality credits that were a focus tended to react more negatively to the interest rate increases. This was an additional consequence also contributing to the underperformance. Our credit selections in the food & beverage and home construction industries were an additional drag on our performance. However, our credit selections in the cable & satellite and leisure industries were a bright spot in the midst of the negative first quarter return.
The Bloomberg Barclays US Corporate High Yield Index ended the first quarter with a yield of 6.19%. This yield is an average that is barbelled by the CCC rated cohort yielding 9.24% and a BB rated slice yielding 5.09%. The Index yield has become more and more attractive since the third quarter of 2017. While the volatility discussed earlier does lend itself to spread widening and higher yields, there are still positives in the environment to keep in mind. First, the current administration is viewed as pro‐business and the tax reform bill that was passed should provide benefits throughout 2018. Additionally, High Yield has displayed a fundamental backdrop that is stable to improving.vi The default volume did tick up during the first quarter, and the twelve month default rate is currently 2.36%.vii However, the current default rate is still significantly below the historical average. Also, a total of twelve issuers defaulted in the first quarter. Three of those issuers accounted for 74% of the default total. iHeart Communications was the largest to default accounting for 55% of the total. Separate from the uptick in the default ratio, the volume of distressed bonds did tick down in March. That was only the seventh downtick within the past two years. Finally, from a technical perspective, the high yield market generates close to $80 billion in coupon income every year. That is a nice supporting demand factor when facing a more volatile market environment. Due to the historically below average default rates and the higher income available in the High Yield market, it is still an area of select opportunity relative to other fixed income products.
Over the near term, we plan to stay rather selective. The selectiveness should serve our clients well as we navigate the higher volatility environment. Further, if the High Yield market begins to break down, our clients should accrue the benefit of our positioning in the higher quality segments of the market. The market needs to be carefully monitored to evaluate that the given compensation for the perceived level of risk remains appropriate on a security by security basis. It is important to focus on credit research and buy bonds of corporations that can withstand economic headwinds and also enjoy improved credit metrics in a stable to improving economy. As always, we will continue our search for value and adjust positions as we uncover compelling situations.
This information is intended solely to report on investment strategies identified by Cincinnati Asset Management. Opinions and estimates offered constitute our judgment and are subject to change without notice, as are statements of financial market trends, which are based on current market conditions. This material is not intended as an offer or solicitation to buy, hold or sell any financial instrument. Fixed income securities may be sensitive to prevailing interest rates. When rates rise the value generally declines. Past performance is not a guarantee of future results. Gross of advisory fee performance does not reflect the deduction of investment advisory fees. Our advisory fees are disclosed in Form ADV Part 2A. Accounts managed through brokerage firm programs usually will include additional fees. Returns are calculated monthly in U.S. dollars and include reinvestment of dividends and interest. The index is unmanaged and does not take into account fees, expenses, and transaction costs. It is shown for comparative purposes and is based on information generally available to the public from sources believed to be reliable. No representation is made to its accuracy or completeness.
i Credit Sights April 1, 2018: “US Monday Meeting Notes”
ii Reuters February 27, 2018: “First Congressional Testimony by Fed Chair Powell”
iii USA Today February 12, 2018: “U.S. Treasury yields rise to a new 4‐year high as inflation concerns drag on” iv Marketwatch March 28, 2018: “The Dow and S&P 500 have already doubled the number of 1% moves seen in all of 2017”
v CNN April 2, 2018: “China hits the United States with tariffs on $3 billion of exports”
vi Bloomberg March 20, 2018: “Historical Fundamentals – High Yield Corporates”
vii JP Morgan April 2, 2018: “Default Monitor”
Fund Flows & Issuance: According to Wells Fargo, IG fund flows for the week of March 15-March 21 were a positive $167 million, though flows have slowed now for four consecutive weeks. The data analyzed by wells shows that longer duration funds are gathering flows at the expense of shorter duration funds. This is in contrast to Lipper data, where IG saw a solid inflow of $3.5bn versus the 4-wk Lipper average of +$1.6bn. HY outflows continue, with Lipper reporting an outflow of $1.17bn taking YTD outflows to nearly $18bn for the HY asset class.
The IG new issue calendar saw $26.875bn price on the week, as Anheuser-Busch InBev led the way with a $10bn print across six tranches. Corporate issuance is down 18% y/y but there are several large M&A related deals waiting in the wings that could narrow this gap substantially in the coming weeks. It is also likely that the market tone and renewed volatility in stocks and rates are keeping some issuers on the sidelines for the time being.
The Bloomberg Barclays US IG Corporate Bond Index opened on Friday with an OAS of 109, which is widest level yet seen in 2018.
(WSJ) ‘Rolldown’ Shows Why the Bond Market Is an Unfriendly Place to Hide
For bond investors, a concept called “rolldown” is like a virtuous form of financial gravity, a force that generates returns without doing much work. A flattening yield curve, however, is threatening the physics that investors rely upon.
The signals sent by the Federal Reserve Wednesday suggests the yield curve could flatten further: Its rate increases will raise short-dated yields, but there is still skepticism that rates in the long term will be materially higher.
When the yield curve is steep, investors benefit from the yield on a long-term bond “rolling down” the curve. As a 10-year bond over time becomes a nine-year bond, all else being equal, its yield falls and its price rises, producing a gain above the initial yield when the bond is purchased. That offers protection for bond investors in a rising-rate environment, notes TwentyFour Asset Management.
The U.S. yield curve still slopes upwards, with 10-year Treasurys yielding 0.57 percentage point more than two-year securities. But the further out you go, the flatter the curve gets. There is now only a 0.07 percentage-point gap between seven- and 10-year Treasury yields, a gap that has more than halved from a year ago. The potential for rolldown gains is small.
A similar phenomenon is showing up in U.S. corporate bond markets too, with the gap between short- and long-maturity bonds shrinking in both yield and spread terms. A number of forces are potentially at play here, as with the rise in Libor rates.
Higher U.S. Treasury bill issuance is competing for investors’ cash. And the pool of funding for short-dated debt may also have shrunk due to corporate cash repatriation, Citigroup suggests: if dollars can be repatriated and spent, they don’t need to be tied up in bond investments.
By contrast, steeper curves in eurozone government and corporate bond markets may make them attractive to investors. The European Central Bank’s negative-rate policy, which it is in no rush to change, is acting as an anchor for yields, reassuring bond investors. Coupled with the cost for foreign investors to hedge dollar-denominated bonds, U.S. bonds lose out despite their higher yields. All of that may lead to tighter U.S. financial conditions.
(Bloomberg) Bayer Hopes to Close $66 Billion Deal With Monsanto in 2Q18
Bayer continues to await antitrust clearance from the U.S. Department of Justice to close its proposed $66 billion purchase of Monsanto after having obtained all other necessary approvals. A DOJ decision is likely in 2Q. While Bayer agreed to sell or license about $7 billion worth of assets to BASF to ease antitrust concerns, additional measures may be needed for approval. Though this is more likely than not to be secured, if antitrust issues prevent it, Bayer will owe Monsanto a $2 billion fee.
Bayer also has ongoing patent suits against generic-drug makers with respect to Xarelto (with J&J), Beyaz/Safyral, Betaferon/Betaseron, Damoctocog alfa pegol, Finacea, Nexavar and Staxyn. It’s involved in product liability litigation with respect to Yasmin, Mirenac and Xarelto. Other legal issues include environmental and tax matters.
(Bloomberg) PG&E Has a Plan to Prevent More Deadly Wildfires
Five months after wildfires ripped through Northern California’s wine country, PG&E Corp. has developed a plan to lower the risk of another outbreak.
PG&E will establish new guidelines for proactively turning off power lines in areas where there’s extreme fire risk — a practice that regulators had asked about after last year’s events. The company will also keep trees and limbs farther away from power lines to meet new standards and expand its practice of disabling some equipment during fire season, according to an emailed statement Thursday.
The announcement comes as state investigators probe whether PG&E power lines played a role in causing fires in Napa and Sonoma counties that destroyed thousands of structures and killed at least 40 people. The San Francisco-based company has lost more than a third of its market value amid investor concern that its equipment may have sparked the deadly blazes. No cause has been determined.