Category: Insight

01 Mar 2019

CAM Investment Grade Weekly Insights

CAM Investment Grade Weekly
03/01/2019

The investment grade credit markets are barreling toward year-to-date tights as the week comes to a close.  The OAS on the corporate index closed at 121 at the end of February, which marks a new low for spreads in 2019.  Risk assets continue to perform well even as Treasuries have inched higher.  The 10yr Treasury is 9 basis points higher as we go to print and sits just a few basis points lower than the 2019 high water mark.

In what seems to be a recurring them, it was yet another solid week of issuance as companies raised nearly $25bln in new debt during the last week of the month.  Concessions on new issuance remain thin as most order books are well oversubscribed to the tune of 3-5x deal sizes.  $98.21bln of new corporate debt was priced during the month of February, bringing the YTD total to $202.573bln.

According to Wells Fargo, IG fund flows during the week of February 21-February 27 were +$5.6 billion. This brings YTD IG fund flows to +$35.345bln.  Flows at this point in the year are modestly outpacing 2018 numbers.


22 Feb 2019

CAM High Yield Weekly Insights

CAM High Yield Market Note

2/22/2019


Fund Flows & Issuance:  According to a Wells Fargo report, flows week to date were $0.6 billion and year to date flows stand at $10.7 billion.  New issuance for the week was $2.1 billion and year to date HY is at $29.1 billion, which is -12% over the same period last year.


(Bloomberg)  High Yield Market Highlights


  • S. junk bond spreads and yields were resilient amid wavering stocks as oil prices held steady and funds reported more cash inflows. Spreads continued to tighten after falling below 400 basis points for the first time since mid-November and yields were flat to little changed.
  • This was the fourth straight week of inflows and the seventh of the last eight weeks
  • Junk bond index rose for eighth straight day to new record high
  • Return is 5.7% YTD, making it the best fixed income performer
  • CCCs turned negative yesterday, have returned 6.03% YTD
  • High yield beats IG, which returned 2.44% YTD, and leveraged loans which are up 3.53%
  • Supply continued to trickle in, with a drive by offering from USAC
  • Size was increased by $250m after receiving orders of more than $2b for a $500m offering
  • Priced at lower end of talk
  • Several deals have priced this week, all were drive bys, had orders more than 3x size of offering, suggesting risk appetite is strong
  • Supply expected to remain light overall as there has been no big acquisitions or buyouts recently and a good part of refinancing has already been done
  • S. junk bonds operate against the backdrop of strong technicals as reflected in slow issuance activity, net cash inflows, low default rate, steady corporate earnings


22 Feb 2019

CAM Investment Grade Weekly Insights

CAM Investment Grade Weekly
02/22/2019

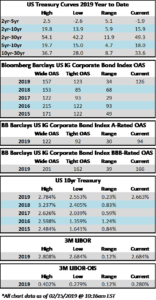
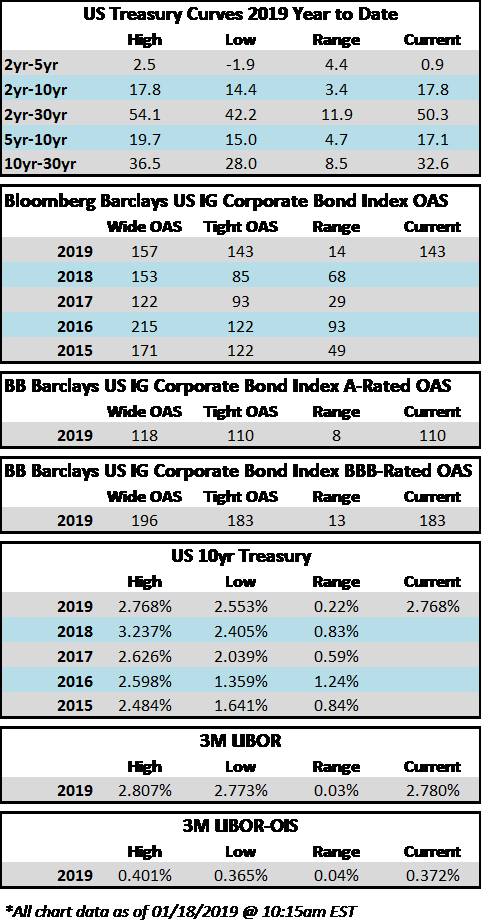
The investment grade credit markets look to end the week on a positive tone, but spreads are largely unchanged for the third consecutive week.  The OAS on the index closed at 125 on February 4th and has traded within just a 2 basis point range since then and most of that time was spent within a 1 basis point range.  The OAS on the index was 125 at the market close on February 21st and we remain wrapped around that number as we go to print this morning.


It was another solid week of issuance as companies raised over $25bln in new debt during the holiday shortened week.  Investor demand for new deals remains very strong and concessions on new debt have continued to grind lower.  As far as basis points go, mid-single digit new issue concessions are the name of the game in the current environment.  Over $73bln in new bonds has come to market in February and the YTD total is now $178bln.

According to Wells Fargo, IG fund flows during the week of February 14-February 20 were +$1.6 billion. This is a more modest pace of flows compared to prior weeks and it brings YTD IG fund flows to +$30bln.  Flows at this point in the year are modestly outpacing 2018 numbers by the tune of 2%.

A Blurb about BBB’s – CAM is significantly structurally underweight and quite cautious when it comes to BBB credit.  However, we can pick and choose the credits that we would like to own so we are not nearly as worried as some market commentators and those in the financial press seem to be with regard to the growth of the BBB portion of the index.  Here are a few interesting recent developments that show that not all the growth in BBB credit should be viewed as negative and that there are some very large BBB-rated issuers who may become A-rated in the near term.

  • HCA 1st lien debt was upgraded to investment grade by Moody’s in January. HCA was previously the single largest issuer in the high yield index.  As a result of receiving its second BBB-rating, $13.2bln of HCA debt moved from junk to investment grade with low-BBB ratings.
  • Also in January, payment processor Fiserv, Inc. announced that it would be acquiring First Data. Junk rated First Data is one of the 50 largest issuers in the high yield index.  The deal is structured in a manner so that Fiserv will retain its mid-BBB investment grade ratings.  Fiserv plans to re-finance $5.31bln of junk rated debt – and the new debt will be BBB rated.  The NewCo will have more BBB debt, but it is largely the result of refinancing junk rated debt while creating a larger company with more scale, better growth prospects and greater free cash flow generation.
  • On February 21st, Verizon held an investor day. Verizon has been actively paying down debt in recent quarters and its CFO highlighted this when talking about its capital allocation plans.

    “Our long-term leverage target is to have net unsecured debt to adjusted EBITDA between 1.75 and 2.0….This metric improved by 0.3 times last year to 2.1. …. And we believe this target is consistent with a low-single-A credit profile.”

Verizon already has an A- rating at Fitch and it is high-BBB at both Moody’s and S&P so it needs only one of them to upgrade it to single-A before it is “officially” an A-rated credit.  An upgrade is a distinct possibility if the company remains on a deleveraging path.  Verizon is the second largest BBB-rated bond issuer in the corporate index and an upgrade would result in over $73bln of index eligible debt leaving the BBB-rated portion of the index and entering the A-rated portion.

Bottom line, headlines about BBB-rated credit are just that –to get the real story one must dig into the details.

(Bloomberg) ‘Disastrous’ Kraft Heinz Quarter Foments Street Doubt on M&A

  • CAM NOTE: This is yet another example of a highly levered BBB-rated company impairing shareholders in order to pay down debt. It is our view that equity holders are the ones most at risk when it comes to BBB-rated credit, as bond holders have priority in the capital structure waterfall.  CAM has no exposure to Kraft Heinz.
  • Kraft Heinz Co.’s “disastrous” earnings announcement prompted analysts to question the packaged-food giant’s growth prospects and its capacity to move ahead with plans for a significant acquisition.
  • The shares plummeted as much as 28 percent to $34.70. Kraft’s plunge erased about $16 billion in market value. For perspective, that’s more than the entire value of packaged-food peers JM Smucker Co. or Campbell Soup Co.
  • Analysts at Goldman Sachs, Barclays, JPMorgan, Stifel, Piper Jaffray, Barclays and UBS cut their ratings on the stock following what Stifel described as a “barrage of bad news:” Quarterly profit missed estimates, the outlook for 2019 was disappointing, and Kraft Heinz cut its dividend, lowered profit-margin expectations and took a $15.4 billion writedown on key brands.
  • “The dividend cut and the margin rebase reflect serious balance sheet concerns,” Robert Moskow, an analyst at Credit Suisse AG, wrote in a note detailing his decision to slash his price target to a street-low of $33 from $42. The update “also pokes an enormous hole in management’s contention that it can execute a meaningful acquisition any time soon.”


15 Feb 2019

CAM Investment Grade Weekly Insights

CAM Investment Grade Weekly
02/15/2019

Investment grade spreads tightened modestly throughout the first half of the week before a deluge of new issue supply led the market to take a breather on Thursday.  While the tone is positive on Friday morning, the corporate index looks like it will finished the week relatively close to unchanged.


The real story this week was the aforementioned new issue supply.  Over $38bln of new debt priced in just three trading days, through Wednesday while no deals priced on Thursday or Friday.  Altria led the way this week as it priced $11.5bln on Tuesday and then AT&T came with $5bln on Wednesday.  3M Co, Goldman Sachs, Boeing and Tyson Foods were among the other companies that printed multi-billion dollar deals during the week.

According to Wells Fargo, IG fund flows during the week of February 7-February 13 were +$2.9 billion. This brings YTD fund flows to +$13.312bln.

As far as new supply is concerned, monthly volume projections for February are still calling for ~$90bln of issuance during the month.  As we roll past the mid-month mark, we have seen just over $48bln in new supply.

15 Feb 2019

CAM High Yield Weekly Insights

Fund Flows & Issuance:  According to a Wells Fargo report, flows week to date were $0.3 billion and year to date flows stand at $8.6 billion.  New issuance for the week was $7.2 billion and year to date HY is at $26.9 billion, which is -10% over the same period last year.


(Bloomberg)  High Yield Market Highlights

  • Yields on U.S. speculative-grade bonds are set to decline for the fifth week, even as the rally was tempered a bit on Thursday. Fund managers, meanwhile, had their straight week of inflows.
  • AVOL priced its drive-by offering amid drifting stocks after boosting its total size by $350m to $1.1b
  • Two CCC rated credits priced, one of them to fund a dividend distribution to equity sponsors
  • S. high yield continued to operate against the backdrop of strong technicals as reflected in the slow issuance activity and net cash inflows into high-yield retail funds, low default rate, and steady corporate earnings
  • Junk bonds, with 5.25% returns YTD, continue to outperform other fixed income assets
  • CCCs were leading high yield with 5.85% returns YTD
  • Junk bonds leaped ahead leveraged loans this year, which have returned 3.09% YTD


(Bloomberg)  Return of the Junk-Bond Dividend Deal Shows It’s Risk On Again 

  • Need more proof that investor appetite for risk-taking is returning in the U.S. junk-bond market? Take a look at the debt being offering by Ascend Learning, the educational software maker acquired two years ago by Blackstone Group and the Canada Pension Plan Investment Board in a leveraged buyout.
  • The $300 million high-yield offering is the first since July that will be used to fund a dividend to a company’s owners, a purpose that’s typically seen by investors as riskier than other types of deals. It was the first such deal to launch since Bruin E&P Partners sold $600 million of notes in July to, among other things, fund a payout to its equity sponsors, data compiled by Bloomberg show.
  • It’s just the latest sign that investors have returned to the market with a vengeance after fleeing for safer asset classes at the end of 2018.


(Bloomberg)  Fear Goes Missing in the Biggest U.S. Junk Rally in a Decade 

  • Traders are going all-in on the best new year rally in U.S. junk bonds since 2009, cutting hedges that help cushion nasty shocks like hawkish monetary moves and weak
    corporate earnings.
  • At-the-money implied volatility in the $14.9 billion iShares iBoxx High Yield Corporate Bond ETF has more than halved since the December maelstrom and now sits below historic averages.
  • While a resurgence in risk appetite and benign technical have powered a 4.9 percent return this year alone, the rally’s staying power is in question.


(Fortune)  T-Mobile CEO to Congress: We Won’t Use Huawei Equipment After Sprint Acquisition 

  • T-Mobile US Chief Executive Officer John Legere says his company doesn’t use equipment from Huawei Technologies Co., and won’t after buying Sprint Corp. to form a bigger No. 3 in the U.S. wireless market.
  • “Let me be clear—we do not use Huawei or ZTE network equipment in any area of our network. Period. And we will never use it in our 5G network,” Legere said in written testimony prepared for a hearing Wednesday before the House communications subcommittee.
  • The statement is in response to critics who’ve raised the issue of the Chinese equipment maker as a risk to national security to build opposition to the proposed $26.5 billion merger.
  • Sprint parent SoftBank Group has “significant ties” to Huawei, as does T-Mobile parent Deutsche Telekom AG, according to Carri Bennet, general counsel for the Rural Wireless Association that represents smaller competitors to the merging parties.
  • “Allowing a Japanese-influenced company and German-influenced company to merger when both have significant 5G ties to Huawei appears to run counter to U.S. national security concerns,” Bennet said in testimony submitted for the hearing.
08 Feb 2019

CAM Investment Grade Weekly Insights

CAM Investment Grade Weekly
02/08/2019

It was a mixed week for Investment Grade Credit. The spread on the Corporate Index marched tighter on Monday and Tuesday before closing wider on both Wednesday and Thursday. The wider close on Wednesday snapped a remarkable streak of 22 straight trading days where the index closed tighter than the prior day. Still, even with two days of slightly wider spreads, the index remains one basis point tighter than where it opened the week and investor sentiment in the corporate credit space remains strong.

The market tone to start the day on Friday is, like the two prior days, somewhat softer. All told, we view this as healthy after the unabated “student body left” tightening that we experienced for 3+ weeks. Ebbs and flows in the market tend to create opportunities for patient investors with longer time horizons.

According to Wells Fargo, IG fund flows during the week of January 31-February 6 were +$5.9 billion. This was the largest inflow since October 2017 according to the data that is tracked by Wells Fargo, bringing YTD fund flows to +$10.759bln.

Issuance slowed this week compared to last, as $10.350bln in new corporate bonds were priced, bringing the year-to-date total to $114.713bln. Monthly volume projections for February are calling for ~$90bln of issuance during the month, according to data compiled by Bloomberg. New issue concessions continue to hover in the low single digits as investor demand for new issues remains robust.


(Bloomberg) Greed Is Back as Debt Markets Face an $8.6 Trillion Hangover

  • Prayers for a sudden return to dovish monetary policies have been answered, and now investors are living with the aftermath: a world awash with $8.6 trillion in negative-yielding debt.
  • That’s one reason money managers are wading once more into the fringes of fixed-income markets across the globe.
  • Consider the action over the past week: Serial defaulter Ecuador managed to sell $1 billion in new bonds even as the government is in talks for International Monetary Fund financing. Crisis-prone Greece received blockbuster orders for its 2.5 billion-euro ($2.9 billion) sale. And the decidedly frontier republic of Uzbekistan, encouraged by risk-on markets, is meeting investors for a debut international offering.
  • No wonder the world’s largest funds are betting the explosive rally in developing-economy debt still has legs.
  • Meanwhile, U.S. high-yield is in the throes of a rebound, as traders bet easier monetary policy will prolong the business cycle. Lower-rated borrowers are in vogue after the asset class posted the biggest monthly gain in seven years.


(WSJ) The Bond and Stock Markets Need to Talk

  • Investors buying bonds should start checking what their colleagues in the stock market are doing.
  • Yields on 10-year U.S. government bonds hover below 2.7%. This is extremely low considering that sovereign debt tracks where the central bank is expected to set interest rates—which the Federal Reserve now pegs between 2.25% and 2.5%—plus a premium for locking up the money long term.
  • The Treasury yield is even more strikingly at odds with the S&P 500, which has climbed back from its December lows during the fourth-quarter earnings season. The technology-heavy Nasdaq is even close to exiting its recent bear market.
  • In the U.S., it is likely bond investors who have got too pessimistic: Derivatives markets price in a 98% chance that interest rates will be at their current level or lower in a year’s time, according to CME Group. Only three months ago, they predicted that the Fed would tighten policy at least twice this year.
  • One possibility is that the legendary pessimism of fixed-income investors is correct and stocks are treading on perilous ground because the U.S. economy is in worse shape than it looks.
  • Yet if January’s improvement in economic data is pointing in the right direction, writing off rate rises with such certainty is perilous. Fed chairman Jerome Powell’s transformation from hawk to dove in January is likely explained—at least in part—by the equity rout late in 2018. If stocks keep rallying, he may very well nudge rates up again at least once.
  • European stock investors, by contrast, should heed the advice of the bond market: The region’s equities have slightly outperformed U.S. ones in recent months, glossing over Europe’s greater vulnerability to the Chinese slowdown. And with rates already at record lows, the European Central Bank has little ammunition left.
  • Treasurys aren’t in for a dramatic selloff, because inflation is being kept in long-term check by weak labor bargaining power. However, investors’ confidence that the Fed will sit on its hands for a full year looks misplaced.


08 Feb 2019

CAM High Yield Weekly Insights

Fund Flows & Issuance:  According to a Wells Fargo report, flows week to date were $4.0 billion and year to date flows stand at $8.2 billion.  New issuance for the week was $3.7 billion and year to date HY is at $19.7 billion, which is -27% over the same period last year.


(Bloomberg)  High Yield Market Highlights

  • Funds reported the highest weekly cash inflows since mid-2016.
  • Investor exuberance was evident as CCC rated Clear Channel priced at lower end of talk after receiving orders of more than $5b for a $2.2b deal, which grew to $2.235b
  • Price talk tightened from the initial whisper of 10%.
  • CommScope priced a 3-part offering at the tight end of talk after receiving orders of ~$8b
  • Yields and spreads came under pressure, as the supply surge combined with tumbling stocks and lower oil
  • Yields and spreads rose across ratings and saw the biggest jump in almost seven weeks
  • Junk bond returns turned negative across the risk spectrum for first time in almost 2 weeks
  • High yield still is the best- performing asset in fixed income, with 4.93% return YTD
  • CCCs remains on top, with YTD return of 5.73%
  • High yield also ahead of leveraged loans, which have returned 2.84% YTD


(Bloomberg)  Arconic Replaces CEO Again, Extending Tumult After Apollo Snub 

  • Arconic Inc. named current Chairman John Plant to serve as chief executive officer, ousting Chip Blankenship just a little more than a year after he took the helm at the embattled manufacturer.
  • Plant, the company’s fourth CEO in less than two years, is expected to serve in the top post for a year, the company said in a statement Wednesday. Elmer Doty, a director, was named chief operating officer, while Arthur Collins Jr., also on the
    board, becomes lead director.
  • The management overhaul comes about two weeks after Arconic backed out of late-stage talks to sell itself to Apollo Global Management, an announcement that sent the shares tumbling the most in eight months.
  • Arconic plans to provide an update on its strategy and portfolio review when it reports earnings on February 8th.


(Bloomberg)  Arconic to Split Into Two Companies, Slash Dividend in Revamp 

  • Arconic Inc. plans to break into two separate companies and will slash its dividend by two-thirds, marking a dramatic overhaul of the aerospace manufacturer in the wake of its failed sale to a private equity firm.
  • The company will separate into Engineered Products & Forgings and Global Rolled Products businesses, one of which will be spun off, Arconic said Friday in a statement.
  • The parts maker will consider a sale of any operations that don’t fit into one of those businesses.


(Verdict Foodservice)  Aramark reports $4.3bn revenue in Q1 2019 

  • US-based foodservice company Aramark has reported revenue of $4.3bn in the first quarter of 2019 ending 28 December 2018, an 8% increase from the same period in the previous year.
  • The catering company has also reported operating income of $373.36m, a 72% rise from $216.87m for the same period in the previous year.
  • Aramark chairman, president and CEO Eric J Foss said: “2019 is off to a good start, with broad-based momentum across the portfolio, driven by strong base business performance and progress in our integration of Avendra and AmerPride.
  • “We continue to elevate the consumer experience by enhancing our product offerings, obsessing on service excellence, and innovating with new technologies.”
  • “Aramark benefits from an advantaged business model and excellent financial flexibility. As we look ahead to the full year, we expect to deliver solid financial performance that will drive sustainable shareholder value.”
  • Furthermore, the foodservice company has received $293m of proceeds from the sale of its Healthcare Technologies business. It used a majority of the proceedings to reduce debt.


(PR Newswire)  Suburban Propane Partners, L.P. Announces First Quarter Results

  • In announcing results, President and Chief Executive Officer Michael A. Stivalasaid, “Positive momentum from fiscal 2018 carried into the fiscal 2019 first quarter.  The first quarter of fiscal 2019 was characterized by colder-than-normal temperatures early in the quarter followed by significantly warmer temperatures during the month of December as compared to the prior year.  Despite this inconsistent weather during the quarter, we were very pleased to deliver another solid performance with results that were flat to the prior year first quarter. Our operations personnel continue to do an excellent job delivering outstanding service to our customers and the communities we serve, adapting our business plans to the weather-driven demand and executing on our customer base growth and retention initiatives.”
  • Stivala continued, “There is still a significant amount of the heating season in front of us.  Our business is extremely well-positioned to meet the needs of our customers while, at the same time, pursuing growth through new market expansion and strategic acquisitions.”
  • Revenues in the first quarter of fiscal 2019 of $377.1 million increased $3.8 million, or 1.0%, compared to the prior year first quarter, primarily due to higher average retail selling prices. Cost of products sold for the first quarter of fiscal 2019 of $182.6 million increased $17.4 million, or 10.5%, compared to the prior year first quarter.
  • Combined operating and general and administrative expenses of $115.9 million for the first quarter of fiscal 2019 increased a modest $0.7 million, or 0.6%, compared to the prior year first quarter, primarily due to higher vehicle maintenance and fuel costs.
31 Jan 2019

CAM INVESTMENT GRADE WEEKLY INSIGHTS

It was another strong week for IG credit. The OAS on the Bloomberg Barclays Corporate Index opened the week at 147 and tightened to 143 through the close on Thursday evening. The tone remains positive in the market this Friday morning as the 2019 risk rally continues. The OAS on the index finished 2018 at 153 and closed as wide as 157 on January 3rd, during the first holiday shortened week of 2019. Since January 3rd, the spread on the corporate index has closed tighter 8 of the last 10 trading days, moving from 157 to 143. For historical context, the three and five year average OAS for the index is 124 and 126, respectively, while the average since OAS since 1988 inception is 134.

According to Wells Fargo, IG fund flows during the week of January 10-January 16 were +$547mm. Per Wells data, YTD fund flows stand at +$2.7 billion. To recap 2018’s action, flows during the month of December were the second largest notional outflow on record at -$26bln and the largest since June of 2013 when -$27.4bln flowed from IG funds.

The primary market is alive and well, as $25.65bln in corporate bonds were printed during the week. According to data compiled by Bloomberg, borrowers are paying less than 5bps in new issue concession, down from as much as 25bps at the beginning of the year. Narrowing concessions support the thesis that the market is wide open and investor demand is robust. Corporate issuance in the month of January has now topped $77bln.

29 Jan 2019

Q4 2018 Investment Grade Commentary

The final quarter of 2018 was extremely volatile, and no asset class was spared, whether it was corporate credit, Treasuries, commodities or equities. The spread on the corporate index finished the quarter a whopping 47 basis points wider, having opened the quarter at 106 before finishing at 153, the widest level of 2018. Treasury bonds were one of the few positive performing asset classes during the fourth quarter as the 10-year Treasury started the quarter at 3.06%, before finishing the year substantially lower, at 2.69%. The 10-year began 2018 at 2.41%, and it rose as high as 3.24% on November 8, before dropping 58 basis points during the last 8 weeks of the year. On the commodity front, West Texas Crude peaked at $76.41 on October 3, before it endured an elevator-like collapse to $45.41, a 40% move in less than a full quarter. Equities also suffered in the final quarter of 2018. The S&P500 was flirting with year-to-date highs at the beginning of the fourth quarter before losing more than 13.5% of its value in the last quarter of the year. All told, the S&P500 finished the year in the red, with a total return of -4.4%.

2018 was the worst year for corporate credit since 2008, when the corporate index returned -4.94%. For the fourth quarter, the Bloomberg Barclays Corporate Index posted a total return of -0.18%. This compares to CAM’s quarterly gross total return of +0.71%. For the full year 2018, the corporate index total return was -2.51% while CAM’s gross return was -1.44%. CAM outperformed the corporate index for the full year due in part to our cautious stance toward BBB-rated credit and due to our duration, which is shorter relative to the index. BBB-rated credit underperformed A-rated credit in 2018. In late January and early February, the spread between the A-rated portion of the index and the BBB portion was just 43 basis points, but that spread continued to widen throughout the year and especially late in the year. The spread between A-rated and BBB-rated finished the year at 79 basis points as lower rated credit performed especially bad on a relative basis amidst the heightened volatility of year end.

Revisiting BBB Credit, again…

We have written much about the growth in BBB credit and our structural underweight relative to the index. CAM seeks to cap its exposure to BBB-rated credit at 30% while the index was 51.21% BBB at year end 2018. Our underweight is born out of the fact that we are looking to 1.) Position the portfolio in a more conservative manner that targets a high credit quality with at least an A3/A- rating and 2.) While it is our long-established style to position the portfolio conservatively, we do not believe there are currently enough attractive opportunities within the BBB universe that would even warrant a consideration for increased exposure to BBB credit.

The BBB growth storyline has received tremendous focus from the mainstream financial press in recent months. Hardly a day goes by without multiple stories or quips from market commentators. Some have gone as far as to predict that the growth in lower quality investment grade bonds will “trigger the next financial crisis”i or that it is akin to “subprime mortgages in 2007.”ii While we at CAM are extremely cautious with regard to lower quality credit, these statements and headlines are hyperbole in our view. We welcome the increased attention on the bond market from the financial press as we often feel like our market is ignored despite the fact that the total value of outstanding bonds in the U.S. at the end of 2017 was $37.1 trillion while the U.S. domestic equity market capitalization was smaller, at $32.1 trillion. iii What the press and pundits are missing is that, if BBB credit truly hits the skids, it has the potential to be far more damaging to equity holders than it does to bondholders. A few of the reasons an investor may own investment grade corporate bonds as part of their overall asset allocation are for preservation of capital, income generation and most importantly, for diversification away from riskier assets, primarily equities. High quality investment grade corporate bonds are meant to be the ballast of a portfolio. Bondholders are ahead of equity holders and get paid first in the capital structure waterfall. Many BBB-rated companies pay dividends or spend some of their cash flow from operations on share repurchases. Equity holders of these companies should be aware that dividends and share buybacks are levers that can be pulled if necessary in order to pay off debt that the company borrowed from bond holders. To that end, the following chart shows the 10 largest BBB-rated corporate bond issuers in The Bloomberg Barclays U.S. Corporate Index. We calculated how much each of these companies has spent on dividends and share repurchases during the last 12 months through 09/30/2018. If any of these companies were to endure financial stress (and some already are under stress) then we would expect that the majority, if not all of the funds that were previously allocated to dividends and share repurchases would instead be diverted to debt repayment.

CAM currently has exposure to just three of these ten largest BBB issuers. As an active manager that is not beholden to an index, CAM can pick and choose which credits it adds to its portfolio based on risk/reward and valuation relative to credit metrics.

Here are a few examples of how the bondholders of some of these companies were given priority over equity holders in 2018:

•Anheuser-Busch InBev reported disappointing third quarter results that showed a lack of progress in deleveraging the balance sheet stemming from its 2016 acquisition of SAB Miller. In conjunction with its lackluster earnings print, management slashed the dividend by 50% in order to divert more funds toward debt repayment. Anheuser-Busch InBev stock traded off sharply on the news and the stock posted a price change of -38.04% in 2018. Comparatively, one of the most actively traded bonds in the capital structure, ABIBB 3.65% 02/01/2026, posted a total return of -4.74% in 2018, per Bloomberg.

• CVS was once a prolific buyer of its own shares. The company bought back an average of $4bln per year of its own shares over the five year period from 2013-2017, but it did not buy back any shares in 2018. That is because CVS closed on the acquisition of Aetna in 2018, which required it to bring a $40 billion dollar bond deal in March; the largest deal of 2018 and the third largest bond deal of all time. In order to provide an incentive for bondholders to purchase its new debt offering, CVS had to promise that it would divert free cash flow to debt repayment in lieu of share repurchases. Although CVS stock underperformed the S&P500 by more than 3% in 2018, this example is not one of a company that is undergoing stress but a very typical example of a company which undergoes transformational M&A and pauses shareholder rewards in order to repair the balance sheet. Bondholders would have demanded much more compensation from CVS’s new debt deal if it did not halt its share buybacks.

• General Electric’s issues are well publicized and yet another example of cash being diverted toward debt repayment. First, the company slashed its dividend by 50% in November 2017, moving it from $0.24 to $0.12 per share. The second cut came in October 2018, as GE all but eliminated the dividend, moving it to a mere penny per share. GE intermediate bonds, specifically the GE 4.65% 10/17/2021, were performing extremely poorly until mid-November but then they rebounded in price on news of GE’s commitment to debt repayment. The bonds ended the year with a total return of -2.34% per Bloomberg, but this pales in comparison to the performance of GE equity, which finished the year down -56.62%.

The purpose of these examples is not to make the case for bonds over stocks, but to illustrate that BBB-rated companies have levers to pull in order to assist in the repayment of debt. In times of stress, shareholder rewards are typically the first things to go so that cash flow can then be diverted to balance sheet repair. At CAM we feel that an actively managed bond portfolio that picks and chooses BBB credit in a prudent manner can navigate potential landmines in lower quality credit and can selectively choose BBB-rated issues which can aid in outperformance.

As we look toward 2019, we expect continued volatility, especially in lower quality credit, but we think that our portfolio is well positioned due to its high quality bias. Two of our top macroeconomic concerns are Fed policy and the continued economic impact of global trade wars. As far as the Federal Reserve is concerned, it just completed the fourth rate hike of 2018 and the 9th of this tightening cycle. FOMC projections were updated at the December meeting and now show two rate hikes in 2019 and one more after that in 2020 or 2021. This suggests that we are nearing the end of this tightening cycle. What concerns us is that European and Chinese growth are both slowing, and if the U.S. economy slows as well we could see a situation where we have a domestic U.S. economy that is not supportive of further hikes. In other words, there is a risk that the Fed goes too far in its quest to tighten, bringing about a recession, which is negative for risk assets. Corporate bonds in general are more attractive today than their recent historical averages. The spread on the corporate index finished the year at 153, while the three and five year averages were 124 and 125 respectively. Going back to 1988, which was index inception, the average spread on the index was 133. New issue supply could play an outsized role in the spread performance of corporates in 2019. 2018 new issue supply was down 10.7% from 2017 and most investment banks are calling for a further decrease of 5-10% in new issue volume in 2019.iv If this decrease in issuance comes to fruition but is coincident with good demand for IG credit then we could find ourselves in a situation where there is not enough new issue supply to satiate credit investors, which would make for an environment that is very supportive of spreads. In what seems to be a recurring theme in our commentaries, caution will continue to rule day for our portfolio as we head into 2019. We will continue to prudently manage risk within our portfolios and strive for outperformance but not at the sake of taking undue chances by reaching for yield.

We wish you a happy and prosperous new year and we thank you for your business and continued interest.

This information is intended solely to report on investment strategies identified by Cincinnati Asset Management. Opinions and estimates offered constitute our judgment and are subject to change without notice, as are statements of financial market trends, which are based on current market conditions. This material is not intended as an offer or solicitation to buy, hold or sell any financial instrument. Fixed income securities may be sensitive to prevailing interest rates. When rates rise the value generally declines. Past performance is not a guarantee of future results. Gross of advisory fee performance does not reflect the deduction of investment advisory fees. Our advisory fees are disclosed in Form ADV Part 2A. Accounts managed through brokerage firm programs usually will include additional fees. Returns are calculated monthly in U.S. dollars and include reinvestment of dividends and interest. The index is unmanaged and does not take into account fees, expenses, and transaction costs. It is shown for comparative purposes and is based on information generally available to the public from sources believed to be reliable. No representation is made to its accuracy or completeness.

i USA Today, September 14, 2018, “Ten year after financial crisis: Is corporate debt the next bubble?”

ii DiMartino, Danielle (DiMartinoBooth). “A lot of BBB is toxic. I am watching this more closely than anything. You must put “investment grade” in quotes. This is the sector that has grown to be a $3 trillion monster. Where’s the parallel? Subprime mortgages circa 2007.” November 29, 2018, 9:00 AM. Tweet.

iii SIFMA. September 6, 2018. “SIFMA U.S. Capital Markets Deck.”

iv Bloomberg, January 2, 2019, “High-Grade Bond Sales Hurt by Repatriation, Higher Costs in 2018”

29 Jan 2019

2018 Q4 High Yield Quarterly

In the fourth quarter of 2018, the Bloomberg Barclays US Corporate High Yield Index (“Index”) return was -4.53%, and the CAM High Yield Composite gross total return was -3.41%. For the year, the Index returned -2.08%, and the CAM Composite returned -3.39%. The S&P 500 stock index return was -4.39% (including dividends reinvested) for 2018. The 10 year US Treasury rate (“10 year”) spent most of quarter going lower. It finished at 2.69% which was down 0.37% from the end of the third quarter. While generally range bound between 2.80% and 3.10% for the majority of the year, the 10 year popped both the top and bottom of the range during the fourth quarter as volatility made a comeback. During the quarter, the Index option adjusted spread (“OAS”) widened a massive 210 basis points moving from 316 basis points to 526 basis points. For context, the Index hasn’t posted an OAS north of 500 basis points in over two years. During the fourth quarter, every quality grouping of the High Yield Market participated in the spread widening as BB rated securities widened 148 basis points, B rated securities widened 219 basis points, and CCC rated securities widened 405 basis points.

The Utilities, Banks, and REIT sectors were the best performers during the quarter, posting returns of -1.39%, -2.10%, and -2.57%, respectively. On the other hand, Energy, Finance, and Basic Industry were the worst performing sectors, posting returns of -10.04%, -5.45%, and -5.13%, respectively. At the industry level, airlines, office reits, and supermarkets all posted the best returns. The airline industry (-0.23%) posted the highest return. The lowest performing industries during the quarter were e&p, refiners, and oil field services. The oil field services industry (-16.12%) posted the lowest return.

During the fourth quarter, the high yield primary market posted only $16.9 billion in issuance. Issuance within Energy was the strongest with just over 20% of the total during the quarter. The 2018 fourth quarter level of issuance was significantly less than the $86.2 billion posted during the fourth quarter of 2017. While the 2017 issuance of $330.1 billion was the strongest year of issuance since 2014, the low issuance for 2018 was less than 40% of the 2017 total.

The Federal Reserve held two meetings during Q4 2018. The Federal Funds Target Rate was raised at the December 19th meeting. Reviewing the dot plot from Bloomberg that shows the implied future target rate, the Fed is expected to increase two more times in 2019. This is down from the three additional raises projected at the end of last quarter. However, based off certain market trading levels, traders are actually projecting a Fed cut as early as 2020. i While the Fed continued raising rates, the market has begun contemplating slowing growth and certain parts of the yield curve have started to invert. Since inversion, more research has been published on the meaning an implication. Importantly, the much watched 2year/10year has yet to invert and at quarter end maintained a spread of 19 basis points. Additionally, some market participants are not as concerned that the yield curve inverts, but they are focused on the magnitude of inversion. There has been work done suggesting that the central bank is compressing the 10 year by around 65 basis points.ii While the Target Rate increases tend to have a more immediate impact on the short end of the yield curve, yields on intermediate Treasuries decreased 38 basis points over the quarter, as the 10-year Treasury yield was at 3.06% on September 30th, and 2.68% at the end of the quarter. The 5-year Treasury decreased 44 basis points over the quarter, moving from 2.95% on September 30th, to 2.51% at the end of the quarter. Intermediate term yields more often reflect GDP and expectations for future economic growth and inflation rather than actions taken by the FOMC to adjust the Target Rate. Inflation as measured by core CPI has been moving steadily higher during 2018 from 1.8% to 2.4% and has settled at 2.2% as of the December 12th report. The revised third quarter GDP print was 3.4% (QoQ annualized rate). The consensus view of most economists suggests a GDP for 2019 around 2.6% with inflation expectations around 2.2%.

The midterm elections came and went during the quarter. Much as the market expected, Congress is now divided with the Republican Party maintaining control of the Senate and the Democratic Party controlling the House of Representatives. The oil market maintained a persistent downtrend throughout the quarter on a combination of supply concerns and declining economic growth outlooks. It was a brutal three months as WTI moved from $75 per barrel to $45 per barrel. Another theme during the quarter was the ongoing trade and tariff negotiation between the United States and China. Currently, the two countries are in talks to try and reach an agreement by March 1st. At which time, a trade truce expires and tariffs on $200 billion of Chinese goods will hike to 25%. The resolution of this trade war will undoubtedly be a major focus in 2019 as the implications are vast. As of this writing, Apple has announced a revenue guidance cut from $91 billion to $84 billion citing among other things a slowdown in China.

Being a more conservative asset manager, Cincinnati Asset Management remains significantly underweight CCC and lower rated securities. For the fourth quarter, the focus on higher quality credits did finally bear fruit. As noted above, our High Yield Composite gross total return outperformed the return of the Index by 1.12%. Our underweights in the banking sector and gaming industry were a drag on our performance. Additionally, our credit selections with the other industrial and automotive industries hurt performance. However, our overweight in the consumer non-cyclical sector and underweight in energy were bright spots. Additionally, our credit selections within utilities and healthcare were a benefit to performance.

The Bloomberg Barclays US Corporate High Yield Index ended the fourth quarter with a yield of 7.95%. This yield is an average that is barbelled by the CCC rated cohort yielding 12.55% and a BB rated slice yielding 6.24%. While the yield of 7.95% is up 1.71% from the 6.24% of last quarter, seeing near an 8% yield hasn’t happened in well over two years. Equity volatility, as measured by the Chicago Board Options Exchange Volatility Index (“VIX”), came out of its shell during the fourth quarter. The VIX ended the third quarter around 12 however; the level elevated in October and November before the big spike above 35 in the second half of December. High Yield default volume stayed low during the fourth quarter with only seven issuers defaulting. The twelve month default rate was 1.08% when iHeart Communications is excluded from the total and remains well below the historical average. iii Additionally, fundamentals of high yield companies continue to be generally solid. From a technical perspective, supply remains very low and could possibly provide some support as investors begin bargain hunting after the higher move in yields. As can be seen in the correlation triangle, high yield also has a diversification benefit relative to equities and investment grade credit. Due to the historically below average default rates, the higher yields available, and the diversification benefit in the High Yield market, it is very much an area of select opportunity that deserves to be represented in many client portfolio allocations.

Over the near term, we plan to remain rather selective. As the riskiest end of the High Yield market showed cracks in the quarter, our clients began to accrue the benefit of our positioning in the higher quality segments of the market. However, one quarter does not make a credit cycle, and we believe that it is over a complete cycle where our clients will gain the most benefit. The market needs to be carefully monitored to evaluate that the given compensation for the perceived level of risk remains appropriate on a security by security basis. It is important to focus on credit research and buy bonds of corporations that can withstand economic headwinds and also enjoy improved credit metrics in a stable to improving economy. As always, we will continue our search for value and adjust positions as we uncover compelling situations.

This information is intended solely to report on investment strategies identified by Cincinnati Asset Management. Opinions and estimates offered constitute our judgment and are subject to change without notice, as are statements of financial market trends, which are based on current market conditions. This material is not intended as an offer or solicitation to buy, hold or sell any financial instrument. Fixed income securities may be sensitive to prevailing interest rates. When rates rise the value generally declines. Past performance is not a guarantee of future results. Gross of advisory fee performance does not reflect the deduction of investment advisory fees. Our advisory fees are disclosed in Form ADV Part 2A. Accounts managed through brokerage firm programs usually will include additional fees. Returns are calculated monthly in U.S. dollars and include reinvestment of dividends and interest. The index is unmanaged and does not take into account fees, expenses, and transaction costs. It is shown for comparative purposes and is based on information generally available to the public from sources believed to be reliable. No representation is made to its accuracy or completeness.

i Bloomberg December 19, 2018: “Prospect of Fed Cut in 2020 Firms”

ii Bloomberg December 19, 2018: “For Some, Curve Inversion Isn’t If or When, But How Deep”

iii JP Morgan January 2, 2019: “Default Monitor”