Category: Insight

09 Aug 2024

CAM High Yield Weekly Insights

(Bloomberg)  High Yield Market Highlights


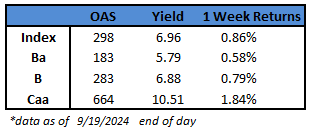
  • US junk bonds staged a solid comeback from last week’s losses and are on track to post modest gains as yields plunged 22 basis points in three sessions – from 7.90% to 7.68% – and spreads tightened 42bps to 339.
  • The rally extended across the ratings spectrum after labor market data eased worries about an imminent recession. The riskiest tier of the junk bond market, CCCs, are headed toward their sixth straight week of gains, the longest rising streak in 2024.
  • CCC yields fell 39 basis in three sessions this week – from 12.92% on Monday to 12.53% at close on Thursday. Spreads dropped 57 basis points in the same period – from 890 to 833
  • After several months of calm, spreads have been sharply wider over the past week, albeit well off the worst levels, amid slowdown concerns and positioning unwinds. “We see few signs of true credit stress,” but a further decline in yields could pressure spreads further, Brad Rogoff and Dominique Toublan of Barclays wrote Friday
  • A strong rebound, with yields dropping and spreads tightening pulled US borrowers into the market on Thursday
  • Six borrowers sold more than $4 billion, driving the month-to-date tally to $7.3b


This information is intended solely to report on investment strategies identified by Cincinnati Asset Management. Opinions and estimates offered constitute our judgment and are subject to change without notice, as are statements of financial market trends, which are based on current market conditions. This material is not intended as an offer or solicitation to buy, hold or sell any financial instrument. Fixed income securities may be sensitive to prevailing interest rates. When rates rise the value generally declines. Past performance is not a guarantee of future results.

02 Aug 2024

CAM Investment Grade Weekly Insights

Credit spreads were meaningfully wider on the week while Treasuries rallied, sending yields lower.  The Bloomberg US Corporate Bond Index closed at 98 on Thursday August 1 after closing the week prior at 93.  The 10yr Treasury yield traded through its previous YTD low of 3.88% from back in January and it is trading at 3.85% this Friday morning.  This is after the 10yr benchmark closed last week at 4.19%. Through Thursday, the corporate bond index YTD total return was +2.16% while the yield-to-maturity for the benchmark was 5.10%.

Economics

It was a big week for data with all eyes on the Fed Wednesday afternoon.  The FOMC elected not to move its policy rate, as expected, and chairman Powell hinted at the fact that near term cuts could be on the horizon as soon as the September meeting.  What really threw markets into a tizzy was the NFP release on Friday morning which was a big miss to the downside.  As of the time we are going to print this morning the numbers are quite volatile.  Treasury curves are at their steepest levels of the 2024 and equity futures have fallen off a cliff.  The market narrative has quickly shifted from questioning if and when we would get a cut at all in 2024 to pondering 3 or 4 cuts.   Some market participants are now even calling for a 50bp cut at the September meeting for fear that the economy is slowing too rapidly. We would point out that this is only one job report, and by the way, the economy is still adding jobs not shedding them.  While the Sahm rule has been triggered, the unemployment rate still remains low by historical standards.  We have always been in the camp that expects a modest recession at some point and this jobs print could be the first step to that end but it is merely one data point.  One thing is certain, the market will have plenty of time to speculate between now and the FOMC’s next meeting on September 18th.  It could be a long month and a half!

Issuance

It was once again another solid week for summer issuance as companies sold $31bln in new bonds.  It ended up as the highest volume July for issuance since 2017 and the second busiest ever.  Syndicate desks are looking for $40bln of new supply next week but that is contingent on a pull back in some of the volatility that the rates markets are experiencing this morning.  Even with spreads off their tights, CFOs and treasurers that were planning to borrow are likely excited at the prospect of lower Treasury yields which mean lower interest expense on new debt.  The year-to-date issuance tally has now climbed to $995bln.  For context, the $1 trillion mark was not reached until October during 2023 and 2022 according to Bloomberg.

Flows

According to LSEG Lipper, for the week ended July 31, investment-grade bond funds reported a net inflow of +$1.79bln.  Short and intermediate investment-grade bond funds have seen positive flows 26 of the past 31 weeks.  YTD flows into IG stand at +$42.5bln.

This information is intended solely to report on investment strategies identified by Cincinnati Asset Management. Opinions and estimates offered constitute our judgment and are subject to change without notice, as are statements of financial market trends, which are based on current market conditions. This material is not intended as an offer or solicitation to buy, hold or sell any financial instrument. Fixed income securities may be sensitive to prevailing interest rates. When rates rise the value generally declines. Past performance is not a guarantee of future results.

02 Aug 2024

CAM High Yield Weekly Insights

(Bloomberg)  High Yield Market Highlights

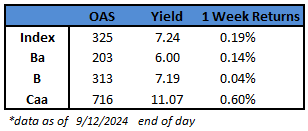
  • US junk bond spreads jumped 11 basis points, the most one-day widening in six months, to a three-month high of 325, abruptly snapping the broad rally and triggering negative returns across the risk spectrum. The losses came after data showed further evidence that US manufacturing shrank the most in eight months and unemployment claims rose to a one-year high.
  • The broad market losses driven by weak data seemed to question the Federal Reserve’s decision to not cut rates in the meeting earlier this week.
  • The market has now priced in three rate cuts in 2024. The swaps market shows there is a 50% chance of one 50bps cut
  • Softer-than-expected economic data from the past few weeks point to an economy that’s potentially slowing too fast. The market is clearly worried about tail risk, and a flight to quality is taking place, Brad Rogoff and Dominique Toublan of Barclays wrote on Friday
  • The losses in the US junk bond cut across ratings taking cue from tumbling equities and a sell off in US Treasuries
  • US junk bond yields rose , though modestly, to 7.61%, still just two basis points above the 2024 low of 7.59%
  • BB spreads widened 10 basis points, also the biggest one-day jump in six months, to a two-month high 199. Yields rose to 6.32%, still just four basis points above a 17-month low of 7.28%
  • CCC spreads rose 12 basis points, the most widening in more than two weeks, to 800. Yields rose to 12.28%
  • The wild swings across risk assets are spurred by investors’ struggle to assess broad macro data and weakening corporate outlook at a time when the Fed seems to be not terribly concerned about growth


(Bloomberg)  Powell Says Fed Could Cut Rates ‘As Soon As’ September Meeting

  • Federal Reserve Chair Jerome Powell said an interest-rate cut could come as soon as September after the US central bank voted to leave its benchmark at the highest level in more than two decades.
  • “The question will be whether the totality of the data, the evolving outlook, and the balance of risks are consistent with rising confidence on inflation and maintaining a solid labor market,” Powell told reporters Wednesday. “If that test is met, a reduction in our policy rate could be on the table as soon as the next meeting in September.”
  • His comments followed a Federal Open Market Committee decision to leave the federal funds rate in a range of 5.25% to 5.5%, a level they have maintained since last July.
  • Policymakers also made several adjustments to the language of a statement released after their two-day meeting in Washington, signaling they are closer to reducing borrowing costs. Notably, the committee shifted to saying it is “attentive to the risks to both sides of its dual mandate,” rather than prior wording focused just on inflation risks.
  • “In recent months, there has been some further progress toward the committee’s 2% inflation objective,” the FOMC statement said. “The committee judges that the risks to achieving its employment and inflation goals continue to move into better balance.”
  • Officials also tempered their assessment of the labor market, noting job gains had moderated and the unemployment rate has moved up, but is still low. They said inflation has eased over the past year but remains “somewhat elevated.”
  • Still, policymakers retained language that they didn’t expect it would be appropriate to lower borrowing costs until they had gained “greater confidence” that inflation is moving toward their target sustainably.
  • The changes in the statement solidify a shift in tone among several policymakers, including Powell, recognizing growing risks to the labor market.
  • A number of former Fed officials and economists had urged the Fed to cut rates at this meeting, including former Fed Vice Chair Alan Blinder and former New York Fed President William Dudley.


This information is intended solely to report on investment strategies identified by Cincinnati Asset Management. Opinions and estimates offered constitute our judgment and are subject to change without notice, as are statements of financial market trends, which are based on current market conditions. This material is not intended as an offer or solicitation to buy, hold or sell any financial instrument. Fixed income securities may be sensitive to prevailing interest rates. When rates rise the value generally declines. Past performance is not a guarantee of future results.

26 Jul 2024

CAM Investment Grade Weekly Insights

Credit spreads were modestly wider on the week.  The Bloomberg US Corporate Bond Index closed at 93 on Thursday July 25 after closing the week prior at 91.  The 10yr Treasury yield was slightly lower on the week at press time, trading at 4.21% this Friday morning after closing last week at 4.24%. Through Thursday, the corporate bond index YTD total return was +0.61% while the yield-to-maturity for the benchmark was 5.32%.


Economics

It was quite a busy week for economic releases but most of what we got was in line with expectations with the exception of GDP which came in meaningfully better than consensus.  The biggest print of the week was the Fed’s preferred inflation gauge on Friday which showed that inflation rose at a timid pace in June while consumer spending held up well but not too well.  Traders viewed this as a print that keeps the hope alive for a soft landing as well as a likely cut in the Fed’s policy rate at its September meeting.  Next week is busy too with consumer confidence and ISM data as well as a FOMC rate decision on Wednesday and the June Employment report capping things off on Friday morning.  Interest rate futures as of this Friday morning are pricing a 95+% chance that the Fed holds the policy rate steady next week.

Issuance

It was a solid week for new supply with $29.5bln of new debt hitting the market, although this fell short of the $35bln estimate.    UnitedHealth led the way, pricing a $12bln issue to fund M&A, the 4th largest deal of 2024.  Occidental Petroleum also priced a chunky $5bln new deal.  Next week syndicate desks are looking for $25bln of new debt.  If that figure comes to pass then this July will rank among the busiest ever and will challenge the record that was set for July in 2017 when companies priced $122bln.  July can often be a slow month for new issue supply but this year has been anything but.  The year-to-date issuance tally has now climbed to $964bln which is more than 25% ahead of where things stood at this point last year.

Flows

According to LSEG Lipper, for the week ended July 24, investment-grade bond funds reported a net outflow of -$0.034bln.  Short and intermediate investment-grade bond funds have seen positive flows 25 of the past 30 weeks.  YTD flows into IG stand at +$39.8bln.

This information is intended solely to report on investment strategies identified by Cincinnati Asset Management. Opinions and estimates offered constitute our judgment and are subject to change without notice, as are statements of financial market trends, which are based on current market conditions. This material is not intended as an offer or solicitation to buy, hold or sell any financial instrument. Fixed income securities may be sensitive to prevailing interest rates. When rates rise the value generally declines. Past performance is not a guarantee of future results.

26 Jul 2024

CAM High Yield Weekly Insights

(Bloomberg)  High Yield Market Highlights


  • US junk bonds are poised to see their eighth straight weekly gains, potentially the longest such streak since January 2021, while spreads continue to hang around 300 basis points on interest-rate cut expectations.
  • A survey of US economists showed that the expectation that the Federal Reserve will likely signal its plans to cut interest rates in September in the policy meeting next week. They said the US central bank will use the July 30-31 gathering to set the stage for a quarter-point cut at the following meeting.
  • Bloomberg Economics’ Anna Wong expects core June PCE inflation — the Fed’s preferred price gauge — to slow to near the central bank’s 2% target on a three-month annualized basis. Also, expects details to show household finances are increasingly stretched. Together, these may persuade the Fed to begin easing rates in September
  • While the high-yield market recorded negligible losses on Thursday, yields are still just six basis points away from the year-to-date low of 7.60% and are likely to end the week unchanged at 7.66%
  • The gains for the week extend across ratings. CCCs, the riskiest tier of the junk-bond market, are on track to rally for the fourth straight week, the longest such streak since March. Yields are still near their five-week low and spreads unchanged at 794 basis points, also a four-week low
  • BBs are also poised for their ninth consecutive weekly gains, the longest stretch in more than three years, even after registering small losses in the last two sessions
  • BB spreads closed unchanged at 174 basis points, just six basis points above the four-year low of 168. Yields also held steady 6.34%, a mere six basis points away from the 17-month low of 6.26%
  • Credit spreads remain relatively stable, despite a sharp pickup in equity volatility, Brad Rogoff and Dominique Toublan of Barclays wrote in a note Friday
  • Still-compressed spreads, attractive all-in yields and light supply lured investors to high yield market, with US high yield funds reporting a cash intake of $1.5b for week ended July 24. This is the third straight week cash inflows into the junk bond funds
  • The primary market, though winding down for the summer, has seen 10 deals price for $5.5b this week


This information is intended solely to report on investment strategies identified by Cincinnati Asset Management. Opinions and estimates offered constitute our judgment and are subject to change without notice, as are statements of financial market trends, which are based on current market conditions. This material is not intended as an offer or solicitation to buy, hold or sell any financial instrument. Fixed income securities may be sensitive to prevailing interest rates. When rates rise the value generally declines. Past performance is not a guarantee of future results.

19 Jul 2024

CAM High Yield Weekly Insights

(Bloomberg)  High Yield Market Highlights

  • US junk bonds are headed for their seventh week of gains, which would match the run at the end of last year, though an 11-day winning streak ended Thursday amid broad weakness in equities.
  • Though high yield overall lost 0.02%, CCCs continued to rebound from their underperformance
  • That riskiest part of the junk bond market returned 01% to post a 12th-consecutive gain, the longest since March
  • This week’s fresh gains have followed a bevy of Fed officials acknowledging the economy is slowing and inflation is cooling
  • Chicago Fed President Austan Goolsbee was the latest to suggest that the central bank may need to lower borrowing costs soon in order to avoid a sharper deterioration in the labor market
  • Spreads have been range-bound despite volatility partly due to positioning, Barclays’ Brad Rogoff and Dominique Toublan wrote on Friday, but also because of expectations that the economy will remain on a good path while credit fundamentals continue to be positive
  • Despite the typical summer lull, four borrowers have sold $3b of notes this week, including CCC-rated bonds


This information is intended solely to report on investment strategies identified by Cincinnati Asset Management. Opinions and estimates offered constitute our judgment and are subject to change without notice, as are statements of financial market trends, which are based on current market conditions. This material is not intended as an offer or solicitation to buy, hold or sell any financial instrument. Fixed income securities may be sensitive to prevailing interest rates. When rates rise the value generally declines. Past performance is not a guarantee of future results.

19 Jul 2024

COMENTARIO DEL SEGUNDO TRIMESTRE

El segundo trimestre del año fue similar al primero. Los diferenciales de crédito se mantuvieron en un rango ajustado y los rendimientos obstinadamente más altos de los bonos del Tesoro continuaron siendo una pesadilla para los rendimientos totales. Los inversores han comenzado a aceptar que la vara para un ciclo de flexibilización es alta aunque últimamente los datos han sido más cooperativos para ayudar a la Reserva Federal a alcanzar ese objetivo. Seguimos creyendo que el entorno actual es oportunista para los inversores en bonos pero puede requerir paciencia. El crédito IG probablemente será un carry trade hasta que la Reserva Federal comience a bajar la tasa de referencia. Los rendimientos elevados y los cupones más altos podrían ser una ventaja para los inversores que utilizan los bonos como mecanismo para preservar el capital.

Resumen del segundo trimestre

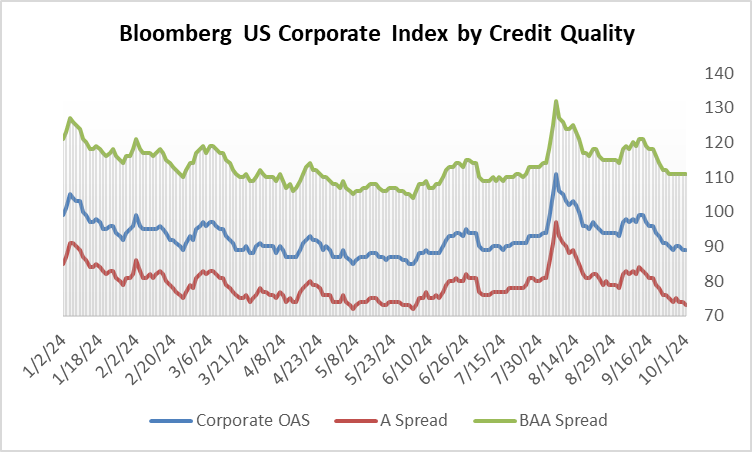
El diferencial ajustado por opciones (OAS) en el Índice de bonos corporativos de EE. UU. de Bloomberg abrió el segundo trimestre en 90 y cotizó en un ajustado 85 a principios de junio antes de terminar el trimestre con un diferencial de 94. Recordemos que el índice comenzó 2024 con un diferencial de 99 y brevemente llegó a cotizar a 105 a principios de enero antes de comenzar su marcha más ajustada. Los diferenciales se negociaron en una banda estrecha durante el segundo trimestre donde el OAS corporativo para el índice estuvo dentro de un rango de solo 10 puntos básicos durante el período.

Los rendimientos de los bonos del Tesoro continuaron subiendo en el segundo trimestre lo que ha sido la razón principal por la que los rendimientos totales del índice IG fueron modestamente negativos en lo que va del año. Los rendimientos fueron mayores durante el primer trimestre y esa tendencia continuó durante el segundo trimestre.

El siguiente gráfico ilustra dónde estaban los rendimientos de los bonos del Tesoro antes y durante la pandemia de coronavirus: significativamente más bajos en aquel entonces en comparación con el presente.

La emisión corporativa se mantuvo sólida durante el segundo trimestre pero no pudo seguir el ritmo récord del primer trimestre. El volumen de nuevas emisiones en lo que va del año fue de 867.000 millones de dólares al final del segundo trimestre. Hay varias razones detrás del entorno sólido para la emisión y el entusiasmo de las empresas por emitir deuda. Por el lado de la demanda las entradas de capitales para la clase de activos con grado de inversión han sido fuertes con más de 200.000 millones de dólares en fondos de bonos sujetos a impuestos hasta finales de mayo (los datos de flujos de junio aún no estaban disponibles al momento de esta publicación). Además las compañías de seguros han sido fuertes compradores de bonos gracias a los aumentos de las tasas de las primas y los fondos de pensiones han estado asignando fondos a una variedad de clases de activos de renta fija mientras buscan reequilibrar sus carteras para dar cuenta del sólido desempeño de las acciones en 2023 y en el primer semestre de 2024. Los compradores extranjeros también han estado participando en el mercado corporativo estadounidense a medida que el BCE y algunos otros bancos centrales de Europa y otros lugares han comenzado a flexibilizar sus tasas de referencia lo que ha hecho que los bonos denominados en dólares sean más atractivos que los bonos de algunas otras monedas. Desde el punto de vista de los prestatarios aunque los rendimientos totales que pagan son elevados en comparación con el pasado reciente los diferenciales son ajustados. La mayoría de los balances con grado de inversión son lo suficientemente saludables como para pedir prestado a las tasas actuales y el costo de la deuda es razonable y está dentro de los marcos de asignación de capital para muchas empresas más fuertes. Otro factor que impulsa la emisión es la incertidumbre futura: muchos equipos de gestión preferirían pedir prestado fondos ahora en un entorno de volatilidad relativamente baja. Una elección presidencial en Estados Unidos, un potencial ciclo de flexibilización de la Reserva Federal y una economía que podría comenzar a mostrar la tensión de tasas más altas podrían hacer que sea más difícil o costoso acceder a capital en la segunda mitad del año.

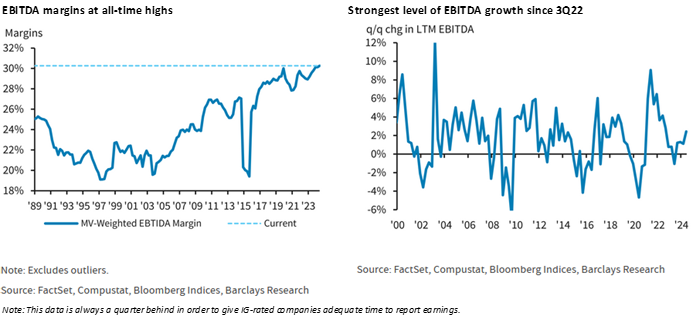
Los indicadores crediticios de grado de inversión se mantuvieron sólidos al final del primer trimestre. Los márgenes de EBITDA estuvieron muy cerca de los máximos históricos y el crecimiento del EBITDA siguió siendo positivo aunque a un ritmo más lento que el trimestre anterior. Sin embargo no todo fue color de rosa ya que los saldos de efectivo cayeron ligeramente y el apalancamiento neto aumentó lo que tuvo un impacto negativo en la cobertura de intereses. Nos sentimos satisfechos con la salud del crédito corporativo de IG en términos generales pero como gestores activos buscamos invertir en empresas con indicadores crediticios estables o en mejora y evitamos aquellas que tienen dificultades para obtener resultados.

Actualización de la Reserva Federal: todavía en espera

Las opiniones de los inversores han evolucionado y ahora se encuentran en una posición mucho más realista con respecto a un posible ciclo de flexibilización en comparación con el nivel en el que comenzaron el año. Recordemos que en aquel momento los mercados de futuros de tipos de interés implicaban hasta siete recortes de 25 puntos básicos en las tasas. Las propias proyecciones de la Reserva Federal han sido más pragmáticas que las de los inversores. El consenso medio del gráfico de puntos de la Reserva Federal mostró expectativas de tres recortes de tasas en su actualización de diciembre de 2023 y luego nuevamente en su actualización de marzo de 2024. La Reserva Federal moderó sus expectativas en junio de 2024 con un nuevo ajuste de los puntos que mostró una decisión ajustada entre uno o dos recortes en la segunda mitad de 2024. De los 19 miembros del FOMC ocho esperaban dos recortes, siete proyectaban uno y cuatro creen que no habrá ninguno en absoluto. Los inversores han accedido y los futuros de tipos de interés al final del segundo trimestre mostraban una probabilidad del 56% de un recorte en julio y una probabilidad del 75% de un recorte en diciembre. A la Reserva Federal le encantaría unirse a la lista de bancos centrales que han recortado las tasas que incluye al BCE, Canadá, la República Checa, Hungría, Suecia y Suiza pero este es un FOMC que comprende y aprecia los errores del pasado. Seguimos esperando uno o dos recortes en 2024 aunque cabe señalar que solo quedan cuatro oportunidades para que esto suceda porque el FOMC no se reúne en agosto ni en octubre. Seguimos creyendo que cuanto más espere la Reserva Federal para recortar más probable será que se produzca una desaceleración económica y estamos gestionando la cartera teniendo esto en cuenta.

Cupón versus retorno total

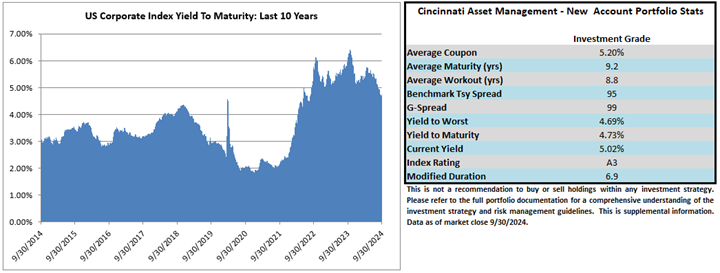
Con la Reserva Federal en un patrón de espera ¿qué significa para el crédito con grado de inversión? Creemos que ha creado un entorno en el que la mayor parte de los rendimientos de los inversores en el corto plazo vendrán en forma de cupones mientras se les paga para esperar el probable inicio de un ciclo de flexibilización y la normalización de la curva de rendimiento. El cupón promedio del índice al final del segundo trimestre fue del 4.2% frente al 3.9% y el 3.6% a finales de junio de 2023 y junio de 2022 respectivamente. Pero esto no cuenta toda la historia ya que el cupón para deuda de vencimiento intermedio que se está emitiendo hoy prácticamente tiene garantizado un cupón más alto que el promedio que es artificialmente bajo debido a la cantidad de deuda que se emitió durante la era de tasas de interés ultrabajas. Una mejor manera de observar el cupón disponible para los inversores en el mercado hoy es utilizar el rendimiento promedio al vencimiento (%YTM) del índice como indicador del cupón. El YTM% promedio terminó el segundo trimestre en 5.48% lo que es una buena aproximación de lo que le costaría a una empresa promedio con calificación de grado de inversión emitir deuda hoy.

Hemos seguido insistiendo en este punto durante los últimos trimestres: como ilustra el gráfico anterior durante la última década ha habido oportunidades limitadas para que los inversores desplieguen capital con estos rendimientos y cupones. En un ejemplo simplificado si un inversor tiene una cartera de bonos con un cupón promedio del 5% y los precios de los bonos en esa cartera no cambian en absoluto durante el año entonces ese inversor obtiene un rendimiento total en un año del 5% en forma de ingresos por cupón. En nuestra opinión un cupón superior al 5% para el crédito IG es muy atractivo y brinda al inversor una buena oportunidad de generar rentabilidades totales positivas a lo largo del tiempo así como un mayor grado de protección contra las caídas que no estaba disponible hace unos años cuando las tasas de interés eran mucho más bajas.

Diferenciales frente a rendimientos

Aunque los rendimientos están cerca del extremo superior de su rango histórico, los diferenciales están cerca del extremo ajustado. Los dos gráficos siguientes muestran el nivel de diferenciales para el índice así como el porcentaje de la parte del rendimiento del índice que está representada por el diferencial de crédito. Por ejemplo, si un inversor compra un bono corporativo con grado de inversión con un diferencial de 100 puntos básicos sobre el Tesoro a 10 años al 4.40% entonces el rendimiento de ese bono corporativo es del 5.40% y el 18.5% de ese rendimiento proviene del diferencial crediticio. Los diferenciales ajustados y los rendimientos elevados de los bonos del Tesoro han creado un entorno en el que una porción relativamente pequeña de la compensación general de los inversores se deriva actualmente del diferencial.

El diferencial de crédito es la compensación que recibe un inversor a cambio de asumir el riesgo crediticio de poseer un bono corporativo en lugar de no asumir ningún riesgo crediticio por poseer el Tesoro subyacente (la tasa libre de riesgo). Hay algunas razones por las que los diferenciales son ajustados hoy en día. En primer lugar las condiciones financieras para los prestatarios con calificación de grado de inversión son buenas y analizamos algunas de esas métricas anteriormente en esta nota. En segundo lugar la tasa de incumplimiento de las empresas con calificación de grado de inversión ha sido históricamente demasiado baja por lo que es típico que los diferenciales sean ajustados cuando la economía está creciendo y los balances corporativos son saludables. Por último un entorno de rendimientos elevados de los bonos del Tesoro puede prestarse a diferenciales de crédito ajustados. Esto se debe a que existe una gran base de compradores en el mercado de grado de inversión que se preocupan más por los rendimientos totales que por los diferenciales. Estos inversores pueden tener un rendimiento fantasma o una tasa de rentabilidad que deben liquidar para una inversión lo que los hace agnósticos respecto de los diferenciales pero más sensibles a los rendimientos. Como gestores de bonos profesionales los diferenciales son muy importantes para nosotros porque los utilizamos para evaluar el valor relativo de los bonos individuales cuando los evaluamos para su compra o venta. Ya sea que le importe la distribución el rendimiento o ambos; la conclusión es que actualmente los inversores están siendo bien compensados por poseer crédito IG en forma de cupones y rendimiento incluso si los diferenciales son ajustados.

Previsión para la segunda mitad

La segunda mitad del año podría ser volátil con varios acontecimientos importantes en el horizonte. Por primera vez en mucho tiempo estamos empezando a ver focos de incertidumbre económica legítima. Por un lado la economía ha sido resiliente. Pero persisten dudas sobre la capacidad de perseverancia económica frente a un ciclo prolongado de ajuste financiero que comenzó en marzo de 2022. El consumidor impulsa la economía estadounidense y ha seguido gastando pero ¿cuánto tiempo podrán seguir haciéndolo ahora que se ha agotado el exceso de ahorro y con una tasa de ahorro actual que ha sido constantemente negativa? Los datos del mercado laboral se han debilitado ligeramente en los últimos meses pero la tasa de desempleo todavía está cerca del extremo inferior de su rango histórico. No somos de los que gritan y no creemos que estemos al borde de un malestar económico pero hoy vemos mucho menos margen de error para la economía que en cualquier otro momento desde antes de 2020. Muchos consumidores se encuentran al límite de su capacidad de protección y un retroceso en los salarios y/o el empleo podría llevar a la economía a una recesión. En este contexto estamos poblando las carteras de inversores en consecuencia y tratando de evitar empresas e industrias que sean de naturaleza discrecional. Seguimos asumiendo riesgos apropiados pero sólo si la compensación es proporcional. Gracias por nuestro continuo interés. Esperamos colaborar con usted mientras navegamos juntos por los mercados crediticios. Como siempre comuníquese con cualquier pregunta o tema de discusión.

Esta información solo tiene el propósito de dar a conocer las estrategias de inversión identificadas por Cincinnati Asset Management. Las opiniones y estimaciones ofrecidas están basadas en nuestro criterio y están sujetas a cambios sin previo aviso al igual que las declaraciones sobre las tendencias del mercado financiero que dependen de las condiciones actuales del mercado. Este material no tiene como objetivo ser una oferta ni una solicitud para comprar, mantener ni vender instrumentos financieros. Los valores de renta fija pueden ser vulnerables a las tasas de interés vigentes. Cuando las tasas aumentan el valor suele disminuir. El rendimiento pasado no es garantía de resultados futuros. El rendimiento bruto de la tarifa de asesoramiento no refleja la deducción de las tarifas de asesoramiento de inversión. Nuestras tarifas de asesoramiento se comunican en el Formulario ADV Parte 2A. En general las cuentas administradas mediante programas de firmas de corretaje incluyen tarifas adicionales. Los rendimientos se calculan mensualmente en dólares estadounidenses e incluyen la reinversión de dividendos e intereses. El índice no está administrado y no considera las tarifas de la cuenta, los gastos y los costos de transacción. Se muestra con fines comparativos y se basa en información generalmente disponible al público tomada de fuentes que se consideran confiables. No se hace ninguna afirmación sobre su precisión o integridad.

La información suministrada en este informe no debe considerarse una recomendación para comprar o vender ningún valor en particular. No hay garantía de que los valores que se tratan en este documento permanecerán en la cartera de una cuenta en el momento en que reciba este informe o que los valores vendidos no hayan sido vueltos a comprar. Los valores de los que se habla no representan la cartera completa de una cuenta y en conjunto pueden representar solo un pequeño porcentaje de las tenencias de cartera de una cuenta. No debe suponerse que las transacciones de valores o participaciones analizadas fueron o demostrarán ser rentables o que las decisiones de inversión que tomemos en el futuro serán rentables o igualarán el rendimiento de la inversión de los valores discutidos en este documento. Como parte de la educación de los clientes sobre la estrategia de CAM podemos proporcionar información de vez en cuando que incluya referencias a tasas y diferenciales históricos. Los ejemplos hipotéticos que hacen referencia al nivel o cambios en las tasas y diferenciales tienen únicamente fines ilustrativos y educativos. No pretenden representar el desempeño de ninguna cartera o valor en particular ni incluyen el impacto de las tarifas y gastos. Tampoco toman en consideración todas las condiciones económicas y de mercado que habrían influido en nuestra toma de decisiones. Por lo tanto las cuentas de los clientes pueden experimentar o no escenarios similares a los mencionados en este documento.

En nuestro sitio web se encuentran disponibles las divulgaciones adicionales sobre los riesgos materiales y los posibles beneficios de invertir en bonos corporativos: https://www.cambonds.com/disclosure-statements/

i Bloomberg, junio 28 2024 “High-Grade Bond Sales on Easter Pause After Record First Quarter”

ii Bloomberg WIRP, marzo 29 2024 “Fed Funds Futures”

iii Bloomberg WIRP, junio 29 2024 “Fed Funds Futures”

iv Raymond James & Associates, junio 28 2024 “Fixed Income Spreads”

v Barclays Bank PLC, junio 13 2024 “US Investment Grade Credit Metrics, Q2 2024 Update: No Concerns”

vi J.P. Morgan, julio 3 2024 “US High Grade Corporate Bond Issuance Review”

vii Bloomberg ILM3NAVG Index, junio 28 2024 “Bankrate.com US Home Mortgage 30 Year Fixed National Avg”

viii CNBC, junio 13 2024 “The Federal Reserve’s period of rate hikes may be over. Here’s why consumers are still reeling”

19 Jul 2024

CAM Investment Grade Weekly Insights

Credit spreads were a touch wider on the week.  The Bloomberg US Corporate Bond Index closed at 91 on Thursday July 18 after closing the week prior at 89.  The 10yr Treasury yield was slightly higher on the week, trading at 4.24% this Friday morning after closing last week at 4.18%. Through Thursday, the corporate bond index YTD total return was +1.14% while the yield-to-maturity for the benchmark was 5.26%.


Economics

It was a lighter week for economic data.  The only print that was especially meaningful was retail sales on Tuesday which came in better than expected.  However, a closer look does show some spending components are slowing, especially for consumers at the lower end of the income distribution.  Still, it remains difficult to bet against the U.S. consumer which has continued to defy expectations for most of the past few years.  Next week brings plenty of action with big economic releases in GDP, consumption, durable goods, income/spending and PCE to name a few.  Earnings start to ramp next week with 192 IG-rated companies reporting with a further 256 reporting the ensuing week.  The Fed meets at the end of the month and the market has coalesced around the idea of a pause in July and a cut in September.  The Fed does not meet in August.

Issuance

It was a much busier week than expected in the investment grade primary market as companies sold almost $45bln of new debt.  The top of end of the forecasted range was just $30bln.  The banking sector led the way this week as those firms were eager to issue debt on the back of solid earnings.  Money center banks issued $24.5bln and regionals issued more than $6bln.  Next week is the last decent issuance-window for a few weeks and syndicate desks are looking for $35bln in new supply.  Year-to-date issuance has now topped $934bln which is more than +26% ahead of where things stood at this point last year.

Flows

According to LSEG Lipper, for the week ended July 17, investment-grade bond funds reported a net inflow of +$1.3bln.  Short and intermediate investment-grade bond funds have seen positive flows 25 of the past 29 weeks.  YTD flows into IG stand at +$39.9bln.


This information is intended solely to report on investment strategies identified by Cincinnati Asset Management. Opinions and estimates offered constitute our judgment and are subject to change without notice, as are statements of financial market trends, which are based on current market conditions. This material is not intended as an offer or solicitation to buy, hold or sell any financial instrument. Fixed income securities may be sensitive to prevailing interest rates. When rates rise the value generally declines. Past performance is not a guarantee of future results.

15 Jul 2024

2024 Q2 High Yield Quarterly

In the second quarter of 2024, the Bloomberg US Corporate High Yield Index (“Index”) return was 1.09% bringing the year to date (“YTD”) return to 2.58%. The S&P 500 index return was 4.28% (including dividends reinvested) bringing the YTD return to 15.29%. Over the period while the 10-year Treasury yield increased 20 basis points the Index option adjusted spread (“OAS”) widened 10 basis points moving from 299 basis points to 309 basis points.

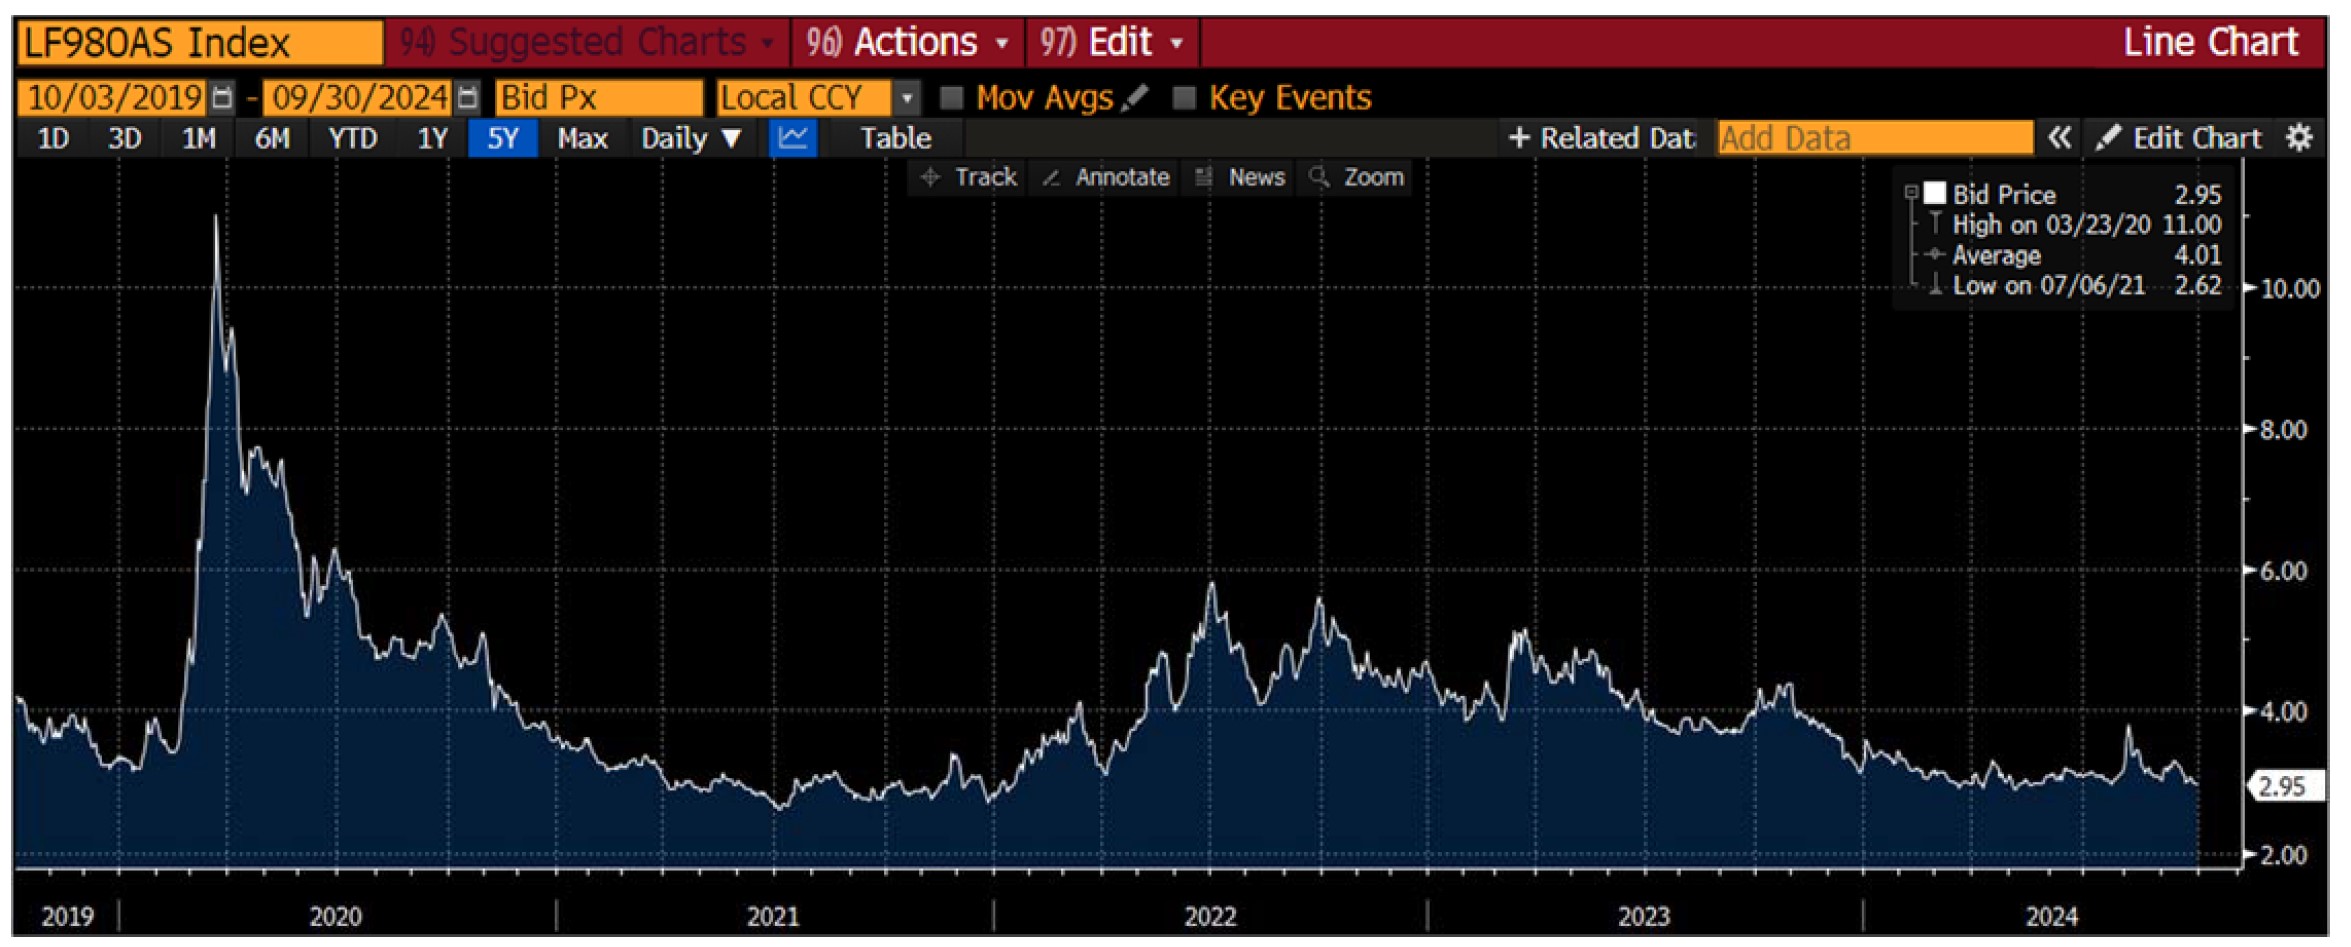
With regard to ratings segments of the High Yield Market, BB rated securities tightened 7 basis points, B rated securities widened 13 basis points, and CCC rated securities widened 91 basis points. The chart below from Bloomberg displays the spread moves in the Index over the past five years. For reference, the average level over that time period was 405 basis points.

The sector and industry returns in this paragraph are all Index return numbers. The Index is mapped in a manner where the “sector” is broader with the more specific “industry” beneath it. For example, Energy is a “sector” and the “industries” within the Energy sector include independent energy, integrated energy, midstream, oil field services, and refining. The Consumer, Non-Cyclical, Other Financial, and Brokerage sectors were the best performers during the quarter, posting returns of 2.54%, 2.42%, and 2.35% respectively. On the other hand, Communications, REITs, and Transportation were the worst performing sectors, posting returns of -1.76%, 0.52%, and 0.55% respectively. At the industry level, pharma, other industrial, and leisure all posted the best returns. The pharma industry posted the highest return of 9.49%. The lowest performing industries during the quarter were wirelines, media, and cable. The wirelines industry posted the lowest return of -3.01%.

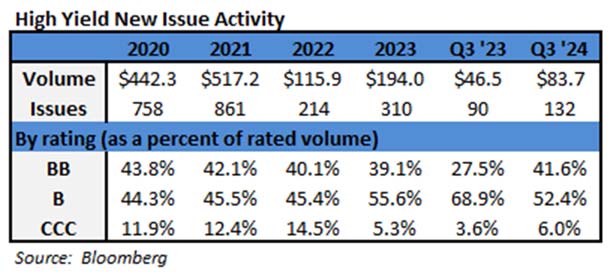
The year continued with strong issuance during Q2 after the very strong start that took place in Q1. The $82.1 billion figure is the most volume in a quarter since the fourth quarter of 2021, not counting Q1 this year. Of the issuance that did take place during Q2, Discretionary took 22% of the market share followed by Financials at 20% share and Energy at 16% share.

The Federal Reserve did hold the Target Rate steady at the May and June meetings. There was no meeting held in April. This made seven consecutive meetings without a hike. The last hike was back in July of 2023. The Fed dot plot shows that Fed officials are forecasting 25 basis points in cuts during 2024 down from a 75 basis cut forecast at the beginning of this year. Market participants have continued to reign in their own expectations of cuts during 2024 based on the pricing of Fed Funds Futures. At the start of the year participants expected over 150 basis points in cuts during 2024; however the expectation is now down to approximately 45 basis points in cuts this year. After the June meeting, Chair Powell commented “the most recent inflation readings have been more favorable than earlier in the year.” He continued “there has been modest further progress toward our inflation objective. We’ll need to see more good data to bolster our confidence that inflation is moving sustainably toward 2%.” The Fed’s main objective has been lowering inflation and it continues to generally trend in the desired direction. The most recent report for Core CPI showed a year over year growth rate of 3.4% down from a peak of 6.6% almost two years ago. Further, the most recent Core PCE growth rate measured 2.6% off the peak of 5.6% from February of 2022.

Intermediate Treasuries increased 20 basis points over the quarter as the 10-year Treasury yield was at 4.20% on March 31st and 4.40% at the end of the second quarter. The 5-year Treasury increased 17 basis points over the quarter moving from 4.21% on March 31st to 4.38% at the end of the second quarter. Intermediate term yields more often reflect GDP and expectations for future economic growth and inflation rather than actions taken by the FOMC to adjust the target rate. The revised first quarter GDP print was 1.4% (quarter over quarter annualized rate). Looking forward, the current consensus view of economists suggests a GDP for 2024 around 2.3% with inflation expectations around 2.8%.

Being a more conservative asset manager, Cincinnati Asset Management does not buy CCC and lower rated securities. Additionally, our interest rate agnostic philosophy keeps us generally positioned in the five to ten year maturity timeframe. During Q2, our higher quality positioning served clients well as lower rated securities underperformed but maturity positioning was a detractor as the less than three year timeframe bucket outperformed. Additionally, there was a performance drag due to our credit selections within the consumer non-cyclical and energy sectors. Benefiting our performance this quarter were our credit selections in the communications sector and our underweight in the communications sector.

The Bloomberg US Corporate High Yield Index ended the second quarter with a yield of 7.91%. Treasury volatility as measured by the Merrill Lynch Option Volatility Estimate (“MOVE” Index) has picked up quite a bit the past couple of years. The MOVE averaged 121 during 2023 relative to a 62 average over 2021. However, the current rate of 98 is well below the spike near 200 back during the March 2023 banking scare. Data available through May shows 11 defaults during 2024 which is relative to 16 defaults in all of 2022 and 41 defaults in all of 2023. The trailing twelve month dollar-weighted default rate is 2.52%. The current default rate is relative to the 1.74%, 1.93%, 2.37%, 2.53% default rates from the previous four quarter end data points listed oldest to most recent. While defaults are ticking up, the fundamentals of high yield companies still look good. From a technical view, fund flows were positive in the quarter at $3.3 billion. No doubt there are risks but we are of the belief that for clients that have an investment horizon over a complete market cycle, high yield deserves to be considered as part of the portfolio allocation.

The high yield market continues to hum along with positive performance and attractive yields. Corporate fundamentals are broadly in good shape, defaults held steady this quarter and issuance remains robust. While GDP still looks good there are some items to note that are relevant to the consumer namely rising delinquencies, depleted excess savings from the pandemic, and an unemployment rate that is on the rise. These items are likely to weigh on the data dependent Fed to commence rate cuts. Among others, the ECB and Bank of Canada have already enacted rate cuts. Looking ahead, the second half of the year contains some events of interest including the presidential election and the probable start of a US rate reduction cycle. Our exercise of discipline and credit selectivity is important as we continue to evaluate that the given compensation for the perceived level of risk remains appropriate. As always, we will continue our search for value and adjust positions as we uncover compelling situations. Finally, we are very grateful for the trust placed in our team to manage your capital.

This information is intended solely to report on investment strategies identified by Cincinnati Asset Management. Opinions and estimates offered constitute our judgment and are subject to change without notice as are statements of financial market trends which are based on current market conditions. This material is not intended as an offer or solicitation to buy, hold or sell any financial instrument. Fixed income securities may be sensitive to prevailing interest rates. When rates rise, the value generally declines. Past performance is not a guarantee of future results. Gross of advisory fee performance does not reflect the deduction of investment advisory fees. Our advisory fees are disclosed in Form ADV Part 2A. Accounts managed through brokerage firm programs usually will include additional fees. Returns are calculated monthly in U.S. dollars and include reinvestment of dividends and interest. The index is unmanaged and does not take into account fees, expenses, and transaction costs. It is shown for comparative purposes and is based on information generally available to the public from sources believed to be reliable. No representation is made to its accuracy or completeness.

Additional disclosures on the material risks and potential benefits of investing in corporate bonds are available on our website: https://www.cambonds.com/disclosure-statements/

i Bloomberg, June 28 2024 “High-Grade Bond Sales on Easter Pause After Record First Quarter”

ii Bloomberg WIRP, March 29 2024 “Fed Funds Futures”

iii Bloomberg WIRP, June 29 2024 “Fed Funds Futures”

iv Raymond James & Associates, June 28 2024 “Fixed Income Spreads”

v Barclays Bank PLC, June 13 2024 “US Investment Grade Credit Metrics, Q2 2024 Update: No Concerns”

vi J.P. Morgan, July 3 2024 “US High Grade Corporate Bond Issuance Review”

vii Bloomberg ILM3NAVG Index, June 28 2024 “Bankrate.com US Home Mortgage 30 Year Fixed National Avg”

viii CNBC, June 13 2024 “The Federal Reserve’s period of rate hikes may be over. Here’s why consumers are still reeling”

15 Jul 2024

2024 Q2 Investment Grade Quarterly

Spanish version coming soon

The second quarter of the year was similar to the first. Credit spreads remained in a tight range and stubbornly higher Treasury yields continued to be a thorn in the side of total returns. Investors have begun to accept that the bar for an easing cycle is high though the data has been more cooperative lately in helping the Fed to reach that goal. We continue to believe that the current environment is opportunistic for bond investors but it may require patience. IG credit will likely be a carry trade until the Fed starts to move the policy rate lower. Elevated yields and higher coupons could be a boon for investors that use bonds as a mechanism to preserve capital.

Second Quarter Review

The option adjusted spread (OAS) on the Bloomberg US Corporate Bond Index opened the second quarter at 90 and traded as tight as 85 in early June before finishing the quarter at a spread of 94. Recall that the index began 2024 at a spread of 99 and briefly traded as wide as 105 in early January before it started its march tighter. Spreads traded in a narrow band during the second quarter where the corporate OAS for the index was rangebound to the tune of only 10 basis points during the period.

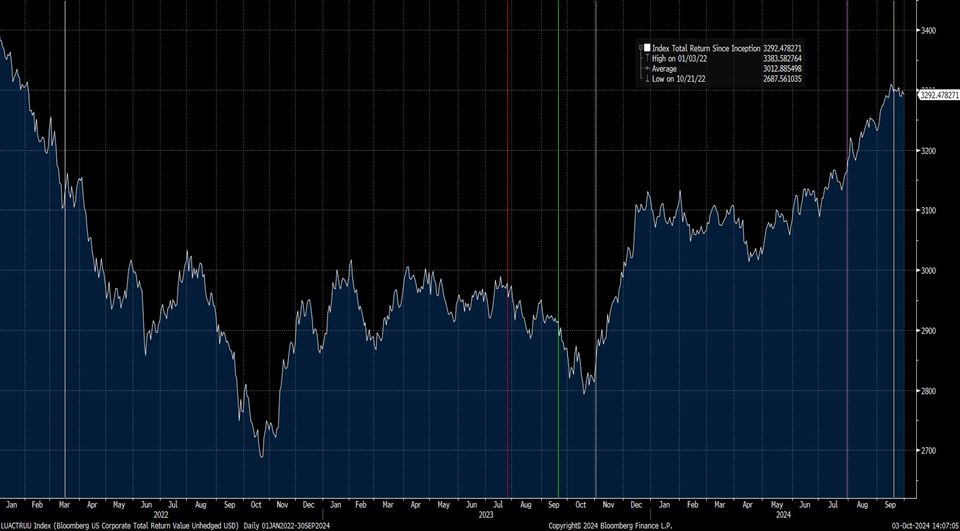
Treasury yields continued to grind higher in the second quarter which has been the principal reason that year-to-date total returns for the IG index were modestly negative. Yields were higher during the first quarter and that theme continued during the second quarter.

The below chart is illustrative of where Treasury yields were prior to and during the coronavirus pandemic –meaningfully lower back then relative to the present.

Corporate issuance remained strong during the second quarter but could not keep up with the record-breaking pace of the first quarter. Year-to-date new issue volume was $867 billion at the end of the second quarter. There are several reasons behind the robust environment for issuance and companies’ eagerness to issue debt. On the demand side inflows for the investment grade asset class have been strong with over $200bln into taxable bond funds through the end of May (June flow data was not yet available at the time of publication). Additionally, insurance companies have been strong buyers of bonds on the back of premium rate increases and pension funds have been allocating to a variety of fixed income asset classes as they look to rebalance their portfolios to account for strong equity performance in 2023 and the first half of 2024. Foreign buyers have also been participating in the US corporate market as the ECB and some other central banks in Europe and elsewhere have started to ease by cutting their policy rates which has made dollar-denominated bonds more attractive than the bonds of some other currencies. From the standpoint of borrowers although the all-in yields that they are paying are elevated compared to the recent past spreads are snug. Most investment grade balance sheets are healthy enough to borrow at current rates and the cost of debt is reasonable and within capital allocation frameworks for many stronger companies. Another factor driving issuance is future uncertainty: many management teams would rather borrow funds now in a relatively low volatility environment. A US presidential election, a potential Fed easing cycle, and an economy that could start to show the strain of higher rates could make it more difficult or expensive to access capital in the second half of the year.

Investment grade credit metrics remained on solid footing at the end of the first quarter. EBITDA margins were very close to all-time highs and EBITDA growth was still positive albeit at a slower pace than the previous quarter. It wasn’t all rosy though as cash balances fell slightly and net leverage increased which had a negative impact on interest coverage. We feel quite good about the health of IG corporate credit broadly speaking but as an active manager we seek to invest in companies with stable or improving credit metrics and eschew those that are struggling to perform.

Fed Update – Still on Hold

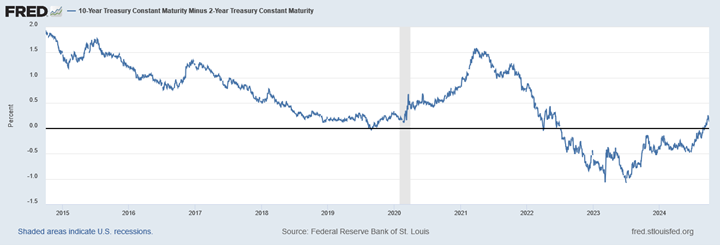
Investor views have evolved and they are now in a much more realistic place with regard to a potential easing cycle relative to where they started the year. Recall that back then interest rate futures markets were implying as many as seven 25bp rate cuts. The Fed’s own projections have been more pragmatic than investors. The Fed dot plot median consensus showed expectations for 3 rate cuts at its December 2023 update and then again at its March 2024 update. The Fed tempered its expectations in June 2024 with a further adjustment to the dots that showed a close call between one or two cuts in the second half of 2024. Out of the 19 FOMC members, eight expected two cuts, seven projected one, and four believe that there will be none at all. Investors have acquiesced and interest rate futures at the end of the second quarter showed a 56% probability of a cut in July and a 75% probability of a cut in December. The Fed would love to join the list of central banks that have cut rates that includes the ECB, Canada, Czech Republic, Hungary, Sweden, and Switzerland but this is a FOMC that understands and appreciates the mistakes of the past. We continue to expect one or two cuts in 2024 although we would note that there are only four opportunities left for this to happen because the FOMC does not meet in August or October. We continue to believe that the longer the Fed waits to cut the more likely it will result in an economic slowdown and we are managing the portfolio with this in mind.

Coupon vs. Total Return

With the Fed in a holding pattern what does it mean for investment grade credit? We believe that it has created an environment where the bulk of investor returns in the near term will come in the form of coupon while they are paid to wait for the likely start of an easing cycle and yield curve normalization. The average coupon on the index at the end of the second quarter was 4.2% up from 3.9% and 3.6% at the end of June 2023 and June 2022 respectively. But this does not tell the whole story as the coupon for intermediate maturity debt that is being issued today is virtually guaranteed to have a higher coupon than the average which is artificially low due to the amount of debt that issued during the era of ultra-low interest rates. A better way to look at the coupon available to investors in the market today is to use the average yield to maturity (YTM%) for the index as a proxy for coupon. Average YTM% finished the second quarter at 5.48% which is a good approximation of what it would cost an average investment grade rated company to issue debt today.

We have beaten the drum on this point for the past few quarters: as the above chart illustrates there have been limited opportunities during the past decade for investors to deploy capital at these yields and coupons. In a simplified example if an investor has a bond portfolio with an average coupon of 5% and the prices of the bonds in that portfolio do not change at all during the year then that investor earns a one-year total return of 5% in the form of coupon income. A coupon above 5% for IG credit is very attractive in our view and provides the investor with a good chance to generate positive total returns over time as well as a higher degree of downside protection that was unavailable a few years ago when interest rates were much lower.

Spreads vs. Yields

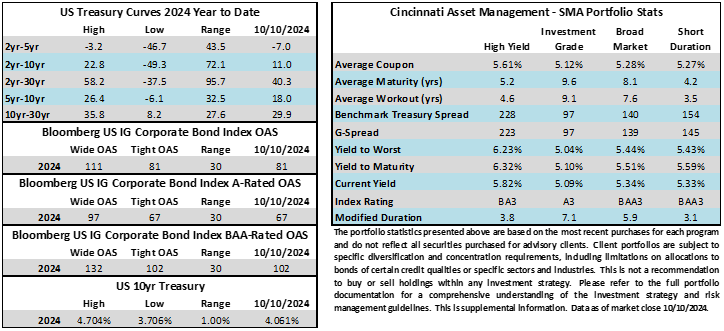
Although yields are near the high end of their historical range spreads are near the tight end. The following two charts show the level of spreads for the index as well as the percentage of the portion of the index yield that is represented by credit spread. For example if an investor buys an investment grade corporate bond at a spread of 100 basis points over the 10yr Treasury at 4.40% then the yield for that corporate bond is 5.40% and 18.5% of that yield is from credit spread. Tight spreads and elevated Treasury yields have created an environment where a relatively small portion of an investor’s overall compensation is derived from spread today.

Credit spread is the compensation an investor receives in exchange for taking the credit risk of owning a corporate bond versus taking no credit risk at all for owning the underlying Treasury (the risk-free rate). There are a few reasons that spreads are tight today. First and foremost financial conditions for investment grade rated borrowers are good and we discussed some of those metrics earlier in this note. Secondly, the default rate for investment grade rated companies has historically been exceedingly low so it is typical for spreads to be tight when the economy is growing and corporate balance sheets are healthy. Finally an environment of elevated Treasury yields can lend itself to tight credit spreads. This is because there is a large base of buyers in the investment grade market that care more about all-in yields than they do about spreads. These investors may have a yield bogey or a hurdle rate that they need to clear for an investment making them agnostic about spreads but more sensitive to yields. As professional bond managers spreads are very important to us because we use them to assess the relative value of individual bonds when we evaluate them for purchase or for sale. Whether you care about spread yield or both; the bottom line is that investors are currently being well compensated for owning IG credit in the form of coupon and yield even if spreads are tight.

Second Half Outlook

The second half of the year could be volatile with several big events on the horizon. For the first time in a while we are starting to see pockets of legitimate economic uncertainty. On one hand the economy has been resilient. But questions remain about the ability for economic perseverance in the face of an extended financial tightening cycle that began in March of 2022. The consumer drives the US economy and they have kept spending but how long can they continue to do so now that excess savings have been exhausted and with a current savings rate that has been steadily negative? Labor market data has weakened slightly in recent months but the unemployment rate is still near the low end of its historical range. We are not one to cry wolf and we do not think we are on the brink of economic malaise but we see a lot less room for error today for the economy than at any point since before 2020. Many consumers are stretched with little cushion and a pullback in wages and/or employment could tip the economy into a recession.
Given this backdrop we are populating investor portfolios accordingly and are seeking to avoid companies and industries that are discretionary in nature. We are still taking appropriate risks but only if the compensation is commensurate. Thank you for our continued interest. We look forward to collaborating with you as we navigate the credit markets together. As always please reach out with any questions or topics for discussion.

This information is intended solely to report on investment strategies identified by Cincinnati Asset Management. Opinions and estimates offered constitute our judgment and are subject to change without notice as are statements of financial market trends which are based on current market conditions. This material is not intended as an offer or solicitation to buy hold or sell any financial instrument. Fixed income securities may be sensitive to prevailing interest rates. When rates rise the value generally declines. Past performance is not a guarantee of future results. Gross of advisory fee performance does not reflect the deduction of investment advisory fees. Our advisory fees are disclosed in Form ADV Part 2A. Accounts managed through brokerage firm programs usually will include additional fees. Returns are calculated monthly in U.S. dollars and include reinvestment of dividends and interest. The index is unmanaged and does not take into account fees expenses and transaction costs. It is shown for comparative purposes and is based on information generally available to the public from sources believed to be reliable. No representation is made to its accuracy or completeness.

The information provided in this report should not be considered a recommendation to purchase or sell any particular security. There is no assurance that any securities discussed herein will remain in an account’s portfolio at the time you receive this report or that securities sold have not been repurchased. The securities discussed do not represent an account’s entire portfolio and in the aggregate may represent only a small percentage of an account’s portfolio holdings. It should not be assumed that any of the securities transactions or holdings discussed were or will prove to be profitable or that the investment decisions we make in the future will be profitable or will equal the investment performance of the securities discussed herein. As part of educating clients about CAM’s strategy we may include references to historical rates and spreads. Hypothetical examples referencing the level of, or changes to, rates and spreads are for illustrative and educational purposes only. They are not intended to represent the performance of any particular portfolio or security, nor do they include the impact of fees and expenses. They also do not take into consideration all market and economic conditions that influence our decision-making. Therefore, client accounts may or may not experience scenarios similar to those referenced herein.

Additional disclosures on the material risks and potential benefits of investing in corporate bonds are available on our website: https://www.cambonds.com/disclosure-statements/

i Bloomberg, June 28 2024 “High-Grade Bond Sales on Easter Pause After Record First Quarter”

ii Bloomberg WIRP, March 29 2024 “Fed Funds Futures”

iii Bloomberg WIRP, June 29 2024 “Fed Funds Futures”

iv Raymond James & Associates, June 28 2024 “Fixed Income Spreads”

v Barclays Bank PLC, June 13 2024 “US Investment Grade Credit Metrics, Q2 2024 Update: No Concerns”

vi J.P. Morgan, July 3 2024 “US High Grade Corporate Bond Issuance Review”

vii Bloomberg ILM3NAVG Index, June 28 2024 “Bankrate.com US Home Mortgage 30 Year Fixed National Avg”

viii CNBC, June 13 2024 “The Federal Reserve’s period of rate hikes may be over. Here’s why consumers are still reeling”