Category: Insight

16 Aug 2019

CAM High Yield Weekly Insights

CAM High Yield Market Note

8/16/2019


Fund Flows & Issuance: According to a Wells Fargo report, flows week to date were $0.6 billion and year to date flows stand at $12.5 billion. New issuance for the week was $5.4 billion and year to date HY is at $165.0 billion, which is +26% over the same period last year.


(Bloomberg) High Yield Market Highlights


  • U.S. junk bonds are set to open higher at the end of a volatile week as stock futures climb alongside modest gains Europe and Asia. Providing support are higher oil prices and Lipper reporting a net fund flow into U.S. high yield funds following a large decline in the prior week.
  • Yields and spreads were slightly higher, particularly for Triple-Cs, where spreads widened 11bps to 949bps and yields closed at a fresh 7-month high of and 11.16%
  • Investors have moved up in quality as reflected in performance of BBs, with YTD returns at 10.9% and investment grade at 13.3%
  • Investors yanked more cash from high-yield ETFs
  • HYG reported an outflow of $514m in the latest session, the biggest outflow since Aug. 5
  • Junk bond returns were negative for a second session, down 0.01%, weighed by CCCs and energy index
  • Bloomberg Barclays High Yield Index was negative in three of the last four sessions taking YTD returns down to 9.477%
  • Energy index YTD returns fell to 1.473% from 6.1% at end of July, a loss of more than 4.5% in August, taking CCCs down too
  • CCC YTD return is 4.016% after a loss of 0.05% yesterday, the most in the high yield index
  • CCCs MTD loss is 3.5%
  • BBs YTD gain is 10.94%, best in high yield, after posting a gain of 0.004%, the only positive yesterday
  • Single-Bs lost 0.02% taking the YTD returns to 9.62%


(Business Wire) Aramark Reports Third Quarter Results


  • Consolidated Revenue was $4.0 billion in the quarter, an increase of 1.0%. Adjusted Revenue grew 5.8% over the prior-year, attributed to a 3.7% growth in the legacy business and a 2.1% increase related to an accounting rule change.
  • Operating Income was $189 million, up 1% compared to the prior-year period. Adjusted Operating Income increased 4% on a constant currency basis, driven by operational improvements and acquisition synergies, offset by higher total incentive-based compensation and the deliberate exit of non-core custodial accounts in Europe.
  • The Company made continued progress in de-leveraging by reducing its net debt position by $672 million compared to the prior year. Total trailing 12-month net debt to covenant adjusted EBITDA was 4.1x at the end of the quarter, a 0.5x improvement versus the end of the third quarter of 2018. Through nine months, Free Cash Flow improved $158 million compared to prior year. This increase can be attributed to a disciplined management of working capital and investment spend. At quarter-end the Company had approximately $1.1 billion in cash and availability on its revolving credit facility.


  • The Company maintains the following performance outlook for Fiscal 2019:
  • Legacy business revenue growth expectations of approximately 3%.
  • Adjusted EPS of $2.20 to $2.30 per share. This includes four cents of unfavorable currency impact.
  • Free cash flow of $500 million. This includes approximately $50 million in cash outlay related to the divestiture of the Healthcare Technologies business and approximately $50 millionin spending on the integrations of Avendra and AmeriPride.
  • Net debt to covenant adjusted EBITDA of 3.8x by the end of the fiscal year. 


  • (Business Wire) AMC Entertainment Announces Second Quarter 2019 Results


  • “AMC delivered strong results for the second quarter of 2019, achieving 4.4% year-over-year total revenue growth to $1.506 billion, driven by record attendance in both our U.S. and international markets. Importantly, total Adjusted EBITDA grew 7.3% year-over-year after adjusting 2018 for the non-cash accounting impact of ASC 842,” said Adam Aron, CEO and President of AMC.
  • Aron continued, “In a quarter that generated the second largest domestic industry box office for any quarter in the past 100 years, we are especially gratified that AMC outperformed the rest of the U.S. industry (meaning comparing AMC with the rest of the U.S. industry, excluding AMC) in attendance per screen by 800 basis points and in admissions revenue per screen by 400 basis points. Additionally, AMC generated record U.S. food and beverage per patron of $5.58 and total food and beverage per patron of $5.08, representing year-over-year growth of 5.5% and 3.9%, respectively.
  • (CAM Note) Additional AMC Highlights
  • In the 3rd quarter two blockbusters currently playing are Spiderman and Lion King.  July is 6.7% ahead of July 2018. Lion King is already the 12th top grossing movie of all time.
  • AMC 2 qtr 2019 attendance +3.9% to 92 million tickets sold.
  • Deleveraging is the #1 priority now. Following aggressive cap-x program to modernize theatres and install reclining seats, upgraded food and beverage concession areas, install premium large format screens (over $2 Billion since 2014) cap-x will now decrease. 2018 was $460MM. 2019 guidance is $415MM. 2020 guidance is $300MM. 2021-2023 guidance is between $250MM-$300MM.
  • This frees up cash flow for debt reduction.
  • No maturities for the next 5 years


(CAM Note) Cheniere Reported Second Quarter Financial Results


  • European gas electric generation nearly doubled in 2qtr 2019 versus 2qtr 2018.  More natural gas capacity coming on line.
  • A senior secured deal private placement with Allianz Insurance is expected to have IG ratings to replace some of their bank debt.
  • Signed a marketing tolling agreement with Apache to sell their natural gas (LNG).  They are working with other large producers to sign similar agreements as well to sell their gas “off shore” in the LNG market given low Henry Hub prices.
  • In 2Q2019 104 cargoes exported totaling 361 Tbtus versus 310 Tbtu in 1Q2019.
  • Corpus train 1 made its first shipments. Train 2 is under test. Completion expected by September, at which time shipments will commence. Train 3 in permitting; expect full permitting to be completed by December.
  • $2.9 – $3.2 billion in ebitda 2019 full year guidance. Stated they’re committed to paying down debt to garner IG bond ratings.


09 Aug 2019

CAM High Yield Weekly Insights

CAM High Yield Market Note

8/9/2019


Fund Flows & Issuance: According to a Wells Fargo report, flows week to date were -$3.6 billion and year to date flows stand at $11.9 billion. New issuance for the week was $4.4 billion and year to date HY is at $159.5 billion, which is +33% over the same period last year.


(Bloomberg) High Yield Market Highlights


  • It’s a risk-off day for U.S. junk bonds as stock futures tumble on renewed trade worries. Recent market turmoil has rattled junk bond investors as they withdrew $3.6b from U.S. high yield funds, the biggest outflow since February of last year.
  • Market volatility has started taking casualties as two issuers – – U.S. Farathane LLC and Sirius Minerals Plc — pulled high- yield offerings this week
  • High-yield returns will come under pressure again today after rebounding Thursday on the heels of an equity rally to jump the most in seven weeks
  • YTD returns stand at 9.865%, after a gain of 0.45% yesterday. This year’s peak was 10.6% in July
  • BBs YTD returns stand at 11.01%
  • Single-Bs YTD returns stand at 9.95%
  • CCCs returns stand at 5.63%
  • Yields dropped and spreads tightened across ratings
  • Bloomberg Barclays index yield dropped 22bps to close at 6.05% and spreads narrowed 24bps to 416bps over U.S. Treasuries
  • Yields on CCC rated debt, which has borne the brunt of the volatility, dropped 22bps to 10.62%. Spreads of 881bps over U.S. Treasuries are at their tightest in seven weeks

(Company Report) Arconic Reports Second Quarter 2019 Results


Highlights include:

  • Revenue of $3.7 billion, up 3% year over year; organic revenue up 10% year over year
  • Net loss of $121 million, or $0.27 per share, mainly driven by non-cash asset impairments of $357 million, versus net income of $120 million, or $0.24 per share, in the second quarter 2018
  • Net income excluding special items of $269 million, or $0.58 per share, versus $185 million, or $0.37 per share, in the second quarter 2018
  • Operating loss of $81 million, versus operating income of $324 million in the second quarter 2018
  • Operating income excluding special items of $484 million, up 27% year over year
  • Operating income margin excluding special items up 240 basis points year over year
  • Cash balance of $1.4 billion, improved $38 million sequentiallyUpdated 2019 guidance:
  • Revenue unchanged at $14.3-$14.6 billion
  • Increased the midpoint of Earnings Per Share Excluding Special Items by 10%; increased the range from $1.75-$1.90 to $1.95-$2.05
  • Increased Adjusted Free Cash Flow to $700-$800 million
  • Added guidance for EBITDA Excluding Special Items at $2.25-$2.35 billion

Arconic Chairman and Chief Executive Officer John Plant said, “In the second quarter 2019, the Arconic team delivered improved quarterly revenue, adjusted operating income, adjusted operating income margin, and adjusted earnings per share on both a year-over-year and sequential basis. Based on our first half performance and our outlook for the remainder of 2019, we are increasing our full-year adjusted earnings per share and adjusted free cash flow guidance for the second time in 2019.”


(Company Report) TENNECO REPORTS SECOND QUARTER 2019 RESULTS


  • Tenneco reported second quarter 2019 revenue of $4.5 billion, a 78% increase versus $2.5 billion a year ago, which includes $1.9 billion from acquisitions.  On a constant currency pro forma basis, total revenue increased 1% versus last year, while light vehicle industry production declined 8% in the quarter. Value-add revenue for the second quarter was $3.7 billion.
  • Second quarter 2019 adjusted net income was $97 million, or $1.20 per diluted share, compared with $96 million, or $1.84 per diluted share last year. Diluted shares outstanding in the second quarter increased 57% to 80.9 million shares, from 51.6 million shares in the second quarter 2018, primarily due to the acquisition of Federal-Mogul.
  • Second quarter adjusted EBITDA was $414 million versus $233 million last year.  Adjusted EBITDA as a percent of value-add revenue was 11.1%.  Second quarter performance improved 240 basis points sequentially, compared to first quarter 2019, driven by the ramp up of synergy benefits and cost control initiatives.  Cash generated from operations was $50 million.
  • “Tenneco’s revenue growth outpaced industry production by nine percentage points, driven by higher light vehicle, commercial truck and off-highway revenues,” said Brian Kesseler, co-CEO, Tenneco. “We delivered sequential earnings improvement on flat revenue quarter to quarter, with disciplined cost management and effective synergy capture actions.”
  • “In the third quarter, we expect our revenues to outgrow the markets we serve,” said Roger Wood, co-CEO Tenneco.  “More importantly, we anticipate higher margins on a year-over-year basis in both divisions supported by operational performance improvements, synergy realization and our continued focus on eliminating waste and cost throughout the business.”
  • The company confirmed its targeted timing for the separation of the business into two standalone companies, and expects the DRiV™ spinoff to occur mid-2020. Management remains focused and committed to the separation of the businesses.

(PR Newswire) TRANSDIGM GROUP REPORTS FISCAL 2019 THIRD QUARTER RESULTS 


  • Net sales of $1,658.3 million, up 69.1% from $980.7 million. Organic sales growth was 11.8%.
  • Net income from continuing operations of $144.5 million, down 33.5% from $217.4 million
  • Earnings per share from continuing operations of $2.57, down 34.3% from $3.91
  • EBITDA As Defined of $691.0 million, up 41.8% from $487.1 million. EBITDA for the quarter was reduced by $16 million for the payment of a voluntary refund to several U.S. Department of Defense agencies.
  • Adjusted earnings per share of $4.95, up 23.4% from $4.01
  • Esterline net sales contribution of $545.3 million, EBITDA as Defined contribution of $134.4 million and implied EBITDA as Defined margin of 24.6%
  • Upward revision to fiscal 2019 financial guidance. Increased EBITDA As Defined mid-point $90 million to $2,435 million. Increased adjusted earnings per share mid-point $1.28 per share to $18.09.


(Globe Newswire) CoreCivic Reports Second Quarter 2019 Financial Results


Highlights of Second Quarter 2019 vs. Second Quarter 2018:

  • Total revenue of $490.3 million, an increase of 9%
  • CoreCivic Safety revenue of $440.4 million, an increase of 7%
  • CoreCivic Community revenue of $30.7 million, an increase of 24%
  • CoreCivic Properties revenue of $19.1 million, an increase of 60%
  • Normalized FFO per diluted share of $0.69, an increase of 21%
  • Adjusted EBITDA of $115.3 million, an increase of 18%
  • Damon T. Hininger, CoreCivic’s President and Chief Executive Officer, said, “During the second quarter we continued to see strong fundamental growth across each of our business segments, and we anticipate these growth trends will continue, as demonstrated by our updated financial guidance and further supported by our recently announced new contract awards.”

Based on current business conditions, the Company is providing the following financial guidance for the third quarter 2019 and the following updated guidance for the full year 2019:


  • We have $325.0 million of senior unsecured notes maturing in April 2020. We currently have capacity under our revolving credit facility to repay these notes prior to their maturity, and expect to continue to have such capacity through maturity. We will also monitor the capital markets and may issue debt securities or obtain other forms of capital if, and when we determine that market conditions are favorable, utilizing the net proceeds to refinance such notes.


09 Aug 2019

CAM Investment Grade Weekly Insights

CAM Investment Grade Weekly
8/9/2019

Spreads in the corporate market are set to finish the week meaningfully wider as the OAS on the index opened at 113 on Monday and is trading at 119 as we go to print on Friday morning.  Rate volatility was as the forefront this week as the rates market has more carefully considered the impact of a full blown trade war. The 10yr Treasury closed at 1.85% last Friday and is wrapped around 1.70% as we go to print this morning.  Spreads opened the month of August at year-to-date tights of 108 and have now moved 11 wider, but at the same time the 10yr Treasury is 30 basis points lower, so the net effect is lower yields for corporate credit.  While the Fed cut the federal funds rate by 25bps last Wednesday, the market expectation is that this is merely the beginning of a multi-cut easing cycle.   Federal funds futures are now implying 2 additional cuts by the end of 2019 and 2 more by the end of 2020.  At CAM, we are of the belief that it is quite possible that markets are underestimating the probability of a lack of near term trade resolution and the associated impact that a prolonged trade dispute could have on risk assets.


Even amid heightened volatility and uncertainty, the primary market was quite active during the week.  In fact it was the fifth busiest week of the year that also saw Occidental Petroleum print the 4th largest bond deal of the year which was met with robust investor demand.  While spreads are set to finish the week meaningfully wider it is clear that there is solid demand for corporate credit, particularly higher quality issuers.  According to data compiled by Bloomberg, year-to-date corporate supply stands at $731.9bln, which trails 2019 supply by 6%.  It is worth noting that for most of 2019 supply has trailed 2018 by 10-12% but this gap has narrowed in recent weeks.  The M&A pipeline continues to grow and it would not surprise us at CAM if issuance were robust through the end of September which could continue to push issuance totals toward 2018 levels.

Fund flows into investment grade corporates escalated throughout the week.  There was a clear bifurcation between the high yield and investment grade credit markets as flows during the week were driven by a flight to quality.  According to Wells Fargo, IG fund flows during the week of August 1-August 7 were +$3.3bln while high yield funds experienced losses of -$3.7bln over the same time period and leveraged loan funds posted outflows of -$963 million.  This brings YTD IG fund flows to +$169bln.  2019 flows to this juncture are up 6.5% relative to 2018.  The fact that flows are up while new issue supply is down is but one factor that has led to a supportive environment for credit spreads.

26 Jul 2019

CAM High Yield Weekly Insights

CAM High Yield Market Note

7/26/2019


Fund Flows & Issuance: According to a Wells Fargo report, flows week to date were $1.3 billion and year to date flows stand at $16.3 billion. New issuance for the week was $12.7 billion and year to date HY is at $150.5 billion, which is +34% over the same period last year.


(Bloomberg) High Yield Market Highlights


  • U.S. junk bonds are poised for their sixth straight day of gains following a $1.3 billion inflow into high-yield retail funds, rising oil prices and higher stock futures.
  • The high-yield bond index hit a new peak yesterday
  • The average yield-to-worst is 5.84%, while spreads tightened 5 basis points to 367bps over U.S. Treasuries, according to Bloomberg Barclays data. Spreads are 17bps tighter on the week
  • Returns also hit a new peak for the year at 10.42%
  • Cash is still pouring into the asset class as investors chase yield
  • Lipper reported an inflow of $1.3b for the week ended July 24. That marks seven consecutive weeks of inflows — the first time this has happened since 2013
  • New issue July volume is set to top $20b by the end of the day with as many as three issuers set to price deals Friday
  • Returns by ratings category:
  • BBs returns hit a new 2019 high of 11.067%
  • Single-Bs were at 10.578%, also a new high
  • CCCs were at 7.611%
  • Loan returns were at 6.368% YTD


(PR Newswire) Encompass Health announces plans to build new inpatient rehabilitation hospital in Tampa Bay


  • The hospital will be located at the corner of Dale Mabry Highway and Van Dyke Road in Tampa Bay and is expected to open in the second quarter of 2021. It will provide comprehensive rehabilitative services to patients overcoming a variety of debilitating illnesses and injuries such as stroke and other neurological disorders, brain injuries, spinal cord injuries, amputations and complex orthopedic conditions. Patients will receive at least three hours of intensive therapy for five days each week, frequent face-to-face visits with a physician and 24-hour nursing care during their stays.
  • “This new hospital will help meet the growing demand for a hospital level of intensive physical rehabilitation in Tampa Bay,” said Linda Wilder, president of Encompass Health’s southeast region. “The new rehabilitation hospital will become part of Encompass Health’s integrated delivery network of 12 hospitals and 17 home health locations throughout Florida, which are focused on not only returning complex patients to their home but helping them remain home through coordinated and connected care.”
  • Included in the hospital will be a spacious therapy gym, advanced rehabilitation technologies, an activities of daily living suite, cafeteria and dining room, in-house dialysis, pharmacy and courtyard. The project will bring approximately 100 full-time jobs to the community.  


  • (Reuters) Pulte full-year forecast disappoints, higher costs persist


  • PulteGroup forecast full-year home sales and gross margins below analyst expectations, as it grapples with rising land costs.
  • Homebuilders in the United States have struggled with a lower supply of homes, especially at the lower-price end of the housing market because of land and labor shortages, as well as expensive building materials and sluggish wage growth that has crimped demand.
  • U.S home sales fell more than expected in June as a persistent shortage of properties pushed prices to a record high, suggesting the housing market was struggling to regain speed since hitting a soft patch last year.
  • Chief Executive Officer Ryan Marshall, however, said he expected demand to pick up in the second half of the year, helped by lower mortgage rates.
  • Pulte’s forecast overshadowed better-than-expected quarterly profit.
  • Pulte expects to sell 22,300 to 22,800 homes this year, compared with estimates of 22,764 units, according to Refinitiv data.
  • The company expects an average sales price of between $425,000 to $430,000 for the remainder of the year, and forecast gross margins to be between 23% and 23.3% for 2019, compared to a consensus of 23.9%.

(Indianapolis Business Journal) Steel Dynamics planning to build $1.9B plant, hire 600


    • An Indiana company is planning to build a $1.9 billion flat-roll steel mill in south Texas and create about 600 jobs.
    • Steel Dynamics Inc. said the electric arc-furnace unit will be in Sinton, about 25 miles northwest of Corpus Christi.
    • The Fort Wayne-based company said in a statement this week that the site is strategically located for the southwestern U.S. and Mexico markets. President and CEO Mark Millett said Steel Dynamics has been developing a flat-roll steel business strategy for those areas for several years.
    • Company officials say the mill will be able to produce up to 52 half-ton coils for the energy, automotive, construction and appliance industries. The site has transport access to railroads, highways and the Port of Corpus Christi.
    • Construction should begin next year.


19 Jul 2019

CAM Investment Grade Weekly Insights

CAM Investment Grade Weekly
7/19/2019

The corporate market was modestly wider on the week with the spread on the index 1 basis point wider week over week as we go to print on Friday morning.  Spreads have largely been in a holding pattern for the month of July, as the index opened the month at an OAS of 115 versus a 113 close yesterday evening.  The 10yr Treasury continues to hover just above 2% amid dovish commentary from Federal Reserve officials.  Media blackout begins tomorrow for Fed officials so we will get a respite from commentary until after the July 31 FOMC decision.


It was a quiet for the primary market as less than $15bln in new corporate debt was brought to the market which was underwhelming relative to the $30bln consensus figure.  According to data compiled by Bloomberg, year-to-date corporate supply has topped $600bln, which trails 2019 supply by 10%.

Fund flows into U.S. corporates escalated throughout the week.  According to Wells Fargo, IG fund flows during the week of July 11-July 17 were +$4.8bln.  This brings YTD IG fund flows to +$158bln.  2019 flows to this juncture are up 6.1% relative to 2018.


(Bloomberg) After Times Square Goes Dark, NYC’s ConEd Faces More Heat

  • It lasted all of five hours — and hit just the spot on New York’s power system to take out the lights in Times Square, force the evacuation of Madison Square Garden in the middle of a Jennifer Lopez concert and bring parts of the city’s subway system to a screeching halt.
  • The Saturday evening blackout on Consolidated Edison Inc.’s grid — extending from about Fifth Avenue to the Hudson River and from the 40s to 72nd Street — was so widespread that it took out much of Midtown, Hell’s Kitchen, Rockefeller Center and the lower reaches of Manhattan’s Upper West Side. Now ConEd, already under fire because of other mechanical breakdowns in recent years, is facing renewed calls to overhaul its network.
  • The power failure struck on the anniversary of the historic 1977 blackout that led to widespread looting and other crimes across New York City. And it peeled back disparities between old technology and new: halted subways meant a $2.75 fare ballooned to a $57 Uber primed to surge pricing.
  • Just over six months ago, ConEd was facing an investigation after an electrical fire at a substation turned New York City’s night sky blue, temporarily disrupting flights and subway services. In July 2018, it was the subject of a probe after an asbestos-lined steam pipe ruptured in Manhattan’s Flatiron district. And a power failure in 2017 led to significant delays on the subway during a morning commute, triggering an investigation that cost the company hundreds of millions of dollars.
  • ConEd Chief Executive Officer John McAvoy told reporters late Saturday that the company would investigate the root cause of the event and “restore the system to a fully normal condition once we understand what exactly occurred.” He said the power failure didn’t appear to be weather-related. Hot weather typically sends power demand surging as people blast air conditioners.


 (WSJ) Cellphone Tower Companies Race Higher

  • As the biggest wireless companies in the U.S. prepare to bring 5G to more customers, cellphone-tower operators are shaping up to be big winners in the stock market. They could be ready to get another boost if or when the deal between T-Mobile US Inc. TMUS -0.37% and Sprint Corp. S +0.37% closes, some analysts say.
  • Shares of Crown Castle International Corp., American Tower Corp. and SBA Communications Corp. all hit records in 2019, and are currently up at least 20% from where they traded six months ago. Cellphone companies like Verizon, AT&T and T-Mobile pay these tower companies fees to use their high-up real estate.
  • A concern among some investors is that these companies soared too high too fast. Of the trio, only shares of SBA Communications have risen in the past month. Part of the reason for that is a slowdown in talks between T-Mobile and Sprint.
  • While final conditions for the merger deal remain to be seen, a key component of the Federal Communications Commission’s conditions is an accelerated 5G rollout in rural areas, UBS notes. That stands to benefit American Tower most, as about 65% of its macro portfolio covers the most rural part of the U.S., according to a research report by UBS last month that looked at the FCC’s antenna registration database of tower locations throughout the U.S.
  • Another potential overhang has been worries that private operators could be competition for these three big public tower owners as wireless carriers seek out lower rents. However, UBS’s report also found that the big three public tower companies remain the dominant players in a hot business, with the largest private owner of tower sites accounting for just about 2% of all towers. That bodes well for SBA Communications, American Tower and Crown Castle.
  • “While the private operators have increased their tower counts…this competitive threat is far more limited in practice at this time,” UBS said in its note.


(Bloomberg) A Leveraged Loan Collapses and Reveals Key Risk in Credit Market

  • Operating out of a Chicago suburb, in a low-slung, red-brick building wedged between a Hyatt and a Radisson, Clover Technologies is in the mundane business of recycling everything from inkjet cartridges to mobile phones.
  • But in the past week it abruptly — and alarmingly — caught the attention of Wall Street. Almost overnight, a $693 million loan Clover took to the market five years ago lost about a third of its value. The startling nosedive stung even sophisticated investors, people who deal in the arcane business of trading corporate loans.
  • Clover’s loan isn’t especially large by Wall Street standards, yet its stark and swift decline set off fresh alarm bells — bells that regulators have been sounding for months. It immediately became a real life example of the perils of investing these days in the $1.3 trillion market for leveraged loans, where a global chase for yield has allowed an explosion in borrowing and lax underwriting. In a market where trading can be thin — and at a time when illiquidity is suddenly becoming a prominent concern in credit circles — the episode shows how loans to highly leveraged companies can quickly implode when fortunes change.
  • Using the leveraged loan market as a wallet, the company took loans that funded dividend payments totaling at least $278 million — $100 million in 2013 and $178 million in 2014. (Portions of the overall proceeds went to shareholders as well as to refinance the company’s existing debt and certain fees, according to a Moody’s report.) Clover also asked lenders for a further $100 million in 2014 to pay for an acquisition.
  • Those loans, as is typically done, were bought mostly by mutual funds and collateralized loan obligations, which bundle such leveraged debt into higher-rated securities that are pitched to more risk-averse investors. There’s been little trouble finding buyers for CLOs in recent years. With yields on high-grade bonds hovering near zero across much of the world, investors have been hungry for the juicy returns that these loans offer and, more and more, tend to overlook the lack of protection afforded.
  • Moody’s now predicts a higher likelihood Clover will default on its debt obligations. The ratings agency cites concerns over long-term viability of the business and “unexpected” operational developments. Its debt is just over 6 times its earnings, a level that typically raises lender concerns about the company’s ability to meet its financial obligations. Another warning sign came in May when the company pulled a seemingly attractive refinancing plan that offered a high yield of nearly 9% with a short, three-year maturity.
  • Investors may recall similar blowups in the credit market. American Tire Distributors’ bonds and loans plunged into distress less than a month after it announced the loss of two key suppliers, Goodyear and Bridgestone. ATM-maker Diebold Nixdorf Inc. also saw its bonds fall to almost half their face value after it posted an unexpected second quarter loss.


19 Jul 2019

CAM High Yield Weekly Insights

CAM High Yield Market Note

7/19/2019


Fund Flows & Issuance: According to a Wells Fargo report, flows week to date were $0.2 billion and year to date flows stand at $15.0 billion. New issuance for the week was $3.7 billion and year to date HY is at $137.8 billion, which is +24% over the same period last year.


(Bloomberg) High Yield Market Highlights


  • U.S. junk bond spreads should see some relief Friday as oil prices bounce back following a recent losing streak and stocks futures rise on expectations of a Fed rate cut later this month.
  • The high-yield primary market could see as many as three deals price today, putting it on track for the busiest July in five years if volumes for the month top $15b
  • Investor demand for high-yield remains strong despite recent spread widening. Cash continues to pour into funds, and new deals have been inundated with orders
  • U.S. high yield funds have seen six straight weeks of inflows
  • Sinclair Broadcast Group saw around $19b in investor demand for its $4.9b acquisition deal, including $11b for the secured tranche and $8b for the unsecured tranche
  • Trivium Packaging is expected to price a cross- border new issue today. The U.S. dollar tranches have been upsized after orders topped more than $5b
  • Junk bond YTD returns are still high, but did fall below 10% for the first time in three weeks on Thursday
  • BBs YTD returns stand at 10.626%
  • Single-B YTD returns are 10.131%
  • CCCs YTD returns are 7.269%
  • Loan returns are at 6.257% YTD

(Bloomberg) Sinclair Has $19b of Investor Orders for Sports M&A Junk Bond


  • Sinclair Broadcast Group’s high-yield bond offering to finance its acquisition of 21 regional sports networks was inundated with investor demand as order books reached $19b, according to people familiar with the matter who are not authorized to speak publicly and asked not to be identified.
  • The $2.55b 7 year senior secured tranche received orders of about $11b, while the $2.325b 8 year unsecured tranche received about $8b, the people said
  • The bond — the biggest dollar high-yield offering since Altice France priced a $5.19b deal in 2016 — is expected to price Friday
  • Initial whisper talk for the secured tranche is 6%-6.25%, and the unsecured 7.25%-7.5%
  • Commitments on $4b term loans that will also finance the acquisition were due July 18
  • The $9.6b acquisition announced in May will be financed with $1b of preferred equity and around $1.4b of cash from Sinclair, according to bond documents seen by Bloomberg
  • The sale of the sports networks to Sinclair by Walt Disney allowed the company to get the antitrust approval needed for its $71b takeover of Fox 


  • (Netflix) Netflix’s Next Big Market Is Crowded With Cheaper Rivals
  • Netflix Inc., reported the worst drop in U.S. users since 2011, is looking for new subscriber growth in India, a rapidly expanding streaming market. Trouble is, so are a raft of ambitious local players with cut-rate programming packages.
  • Already wrestling with other global giants such as Walt Disney Co. and Amazon.com Inc., Netflix now also contends with broadcasters and Bollywood powerhouses allied with billionaire-backed wireless carriers, who are luring users with free offers
    or as low as 40 cents a month. That tactic has put them directly in the India growth path of the world’s largest paid online streaming service.
  • The intense competition could derail Chief Executive Officer Reed Hastings’s goal of 100 million customers in India – almost 25 times Netflix’s estimated subscriber base there this year. The world’s second-most populous country is a priority for the streaming service, which is effectively blocked in China.
  • The second-quarter loss of 130,000 users in the U.S., reported Wednesday, makes winning in India all the more pressing.

(Company Report) United Rentals Announces Second Quarter 2019 Results


    • Total revenue increased 21.1% to $2.290 billion and rental revenue increased 20.2% to $1.960 billion. On a GAAP basis, the company reported second quarter net income of $270 million, compared with $270 million, for the same period in 2018. Second quarter 2019 included a pretax debt redemption loss of $32 million
    • Adjusted EBITDA increased 18.3% year-over-year to $1.073 billion, while adjusted EBITDA margin decreased 110 basis points to 46.9%. On a pro forma basis, year-over-year, net income increased 7.1%, adjusted EBITDA increased 6.6% and adjusted EBITDA margin increased 40 basis points.
    • Matthew Flannery, chief executive officer of United Rentals, said, “We were pleased with our solid growth in revenue for both our general rental and specialty segments and our adjusted EBITDA for the second quarter. Importantly, the market outlook for the second half of 2019 remains positive based on feedback from our customers and the field. The multiple integrations we have underway will continue to gain traction in the back part of the year.”
    • Flannery continued, “Our updates to guidance reflect a slightly slower than expected pace for the BlueLine integration, as well as historically bad weather in several key regions this past quarter. As a result, we’ve trimmed the upper ends on total revenue and adjusted EBITDA by approximately 1%, and capex by $150 million, while raising our free cash flow expectation. We remain confident in the health of the cycle and are well positioned to serve our customers with the strongest service offering in our history.”


15 Jul 2019

2019 Q2 INVESTMENT GRADE QUARTERLY

The investment grade credit market continued to perform well during the second quarter of the year. The Bloomberg Barclays US Corporate Index opened the quarter at an option adjusted spread of 119 and traded as tight as 109 by mid-April before ending the last trading day of June at a spread of 115. Lower quality credit modestly outperformed during the quarter with the BBB-rated portion of the index tightening by 7 basis points relative to the A-rated portion which tightened by 3 basis points. The bigger story of this quarter was lower Treasury yields as the 10yr Treasury finished the quarter 40 basis points lower than where it started. The 10yr ended the first 6 months of 2019 at 2.005% after closing as high as 2.78% in the first few weeks of January. Tighter spreads and lower Treasuries have combined to yield strong performance for investment grade creditors. The Bloomberg Barclays US Corporate Index posted a total return of +9.85% through the first 6 months of the year. This compares to CAM’s gross return of +9.20% for the Investment Grade Strategy.

When Doves Cry

As longtime clients and readers know, at Cincinnati Asset Management we avoid speculating on the direction of interest rates. Instead we direct our efforts to bottom up credit research, thoroughly studying individual credits and diligently following industry trends, then opportunistically sourcing bonds which can add the most value to the overall portfolio. By positioning the portfolio with intermediate maturities ranging from five to ten years, we mitigate a significant portion of interest rate risk as investors are generally rewarded over medium and longer term time horizons by avoiding tactical positioning and the downside that can come about from being too short or too long with duration bets gone awry. However, while we may be interest rate agnostic, we are not interest rate blind. We would be remiss if we did not comment on the policy actions that we have seen out of the Federal Reserve thus far in 2019. Simply put, the Fed continues to exceed the dovish expectations of the market, a remarkable feat given the extent that the market is pricing in rate cuts, with Fed Funds futures data implying a 100% probability of a rate cut at next FOMC decision on July 31i. We take this as a sign from the Fed that it is extremely concerned with managing a so called “soft landing” when the current economic expansion finally runs out of steam.

The actions of the Fed do not occur in a vacuum and they can have a significant impact on risk assets such as corporate credit. Lower Fed Funds rates coupled with the potential for future slowing economic growth can lead to lower risk-free rates (Treasury rates). When risk-free rates are low, yield starved investors from around the globe turn to large liquid markets in order to satiate their thirst for income thus setting their sights on the corporate credit market. Defaults remain nearly non-existent in the investment grade universe, and when coupled with a still growing economy, this can be a recipe for complacency and a tendency to “reach” for yield. Investors can reach for yield in two ways in IG credit; they can either extend duration or they can take on additional credit risk, but they usually do both. These are ill-advised strategies in our view, especially for investors concerned with capital preservation over a long time horizon. As far as extending duration is concerned, the compensation afforded for extending from a 10yr bond to a 30yr bond typically pales in comparison to the additional interest rate risk that is incurred. What most investors fail to realize is that most duration extensions also contain a significant dose of credit risk. Take the following example with Comcast’s 10yr and 30yr bonds:

An investor receives just 87 basis points of extra compensation for purchasing Comcast’s 30yr bond versus its 10yr bond, and in exchange, the investor takes on an additional 9.4yrs of duration risk. This means that if there is a linear shift in the yield curve and interest rates increase by 100 basis points, the investor in the 30yr bond will capture an additional nine points of downside. However, duration alone does not tell the whole story, as this is not just a story about interest rate risk as much as it is also a story about credit risk. Our hypothetical investor could purchase the risk-free rate instead of the corporate bond, and as you can see from the example above, the spread between the 10 and 30 year Treasury is 53 basis points. If we subtract this 53 basis points from the 87 basis points in spread between the Comcast 10yr and 30yr the difference is 34 basis points. Therefore, 34 basis points is the compensation that the investor receives for the additional credit risk incurred for the purchase of the 30yr Comcast bond in lieu of the 10yr Comcast bond. We like Comcast as an in investment. It is a best-in-class operator in its industry and it generates tremendous free cash flow. But we do not like it enough to lend it money for an additional 20 years in exchange for just 34 basis points of compensation for that credit risk. It simply does not make much sense to us from a risk-reward standpoint.

If you have not yet nodded off from this exercise in corporate credit, the other aforementioned avenue for increasing yield is to simply take on more credit risk by buying shorter maturity bonds of companies with marginal credit metrics. Usually the bonds of companies with marginal credit metrics will offer outsize compensation relative to the bonds of companies with stable or improving credit metrics. There is almost always a reason that the bonds of a marginal company will offer more yield but an investor really has to dig into the numbers and the industry to understand why. Sometimes it may simply be a case of a company that has too much debt or perhaps the business is showing signs of deterioration. Sometimes these investments may well work out but it only takes one or two permanent impairments (downgrade to high yield, structural subordination, default or fraud) to severely impact the performance of a bond portfolio. Taking on more credit risk is not worth it in the current environment in our opinion and is one of the reasons we are significantly structurally underweight the BBB and lower-rated portion of the investment grade universe. We cannot accurately predict when the business cycle will contract but we most assuredly are viewing all new and current investments through a late-cycle lens as we populate the portfolio with companies that have durable business models and the ability to generate free cash flow and comfortably service debt in a recessionary environment.

BBB, Leading the Way

The lowest quality component of the investment grade universe has significantly outperformed the higher quality portion thus far in 2019. The OAS for the index as a whole was 38 basis points tighter through the end of the second quarter. If we segment that by credit quality, the A-rated portion of the index was 30 basis points tighter while the BBB-rated portion of the index was 51 basis points tighter.

Much has been written about the growth of BBB-rated credit, and for good reason. At the end of 2008 it represented 33.15% of the index but at the end of 2018 that figure had swollen to 51.21%. We cap the exposure of our portfolios to BBB-rated credit at 30%, thus we are much more conservatively positioned than the index. We think that this conservative positioning is especially crucial in times like these and we have no intention of increasing our exposure in the near term.

What Happened to Regulators Looking out for the Little Guy?

We typically avoid commenting on regulatory matters but an SEC proposal that was greenlighted in the second quarter has us flummoxed. Regulators recently approved a pilot program that shows a blatant disregard for retail investors and financial advisorsii. Trade disclosure in the corporate bond market has come a very long way in the past 15 years. It is still an over-the-counter market but there was a time in the not too distant past when it was rife with opacity in that there was simply no record of the price at which a bond was traded. The market has slowly but surely evolved and today there is an electronic record of where all corporate bonds trade within 15 minutes of when the trade was completed.

An SEC committee comprised mostly of the largest asset managers and broker dealers on the street voted to enact a 1-year pilot proposal that would roll back much of the progress that has been made with trade disclosureiii. The proposal centers on “block” or large bond trades. The current rule for IG corporate bonds caps trade size dissemination at $5 million but the trade must be posted within 15 minutes. So, as the rule stands today, a trade could have been completed for $50 million of a specific bond issue but unless you are privy to the details you will only know that at least $5 million traded and you will know at what price and you will know this information within 15 minutes of trade completion. This provides some (and we would argue more than adequate) protection to dealers who can buy a large block of a bond from an asset manager and then sell the bond to other asset managers over time without other market participants knowing that the dealer owns a large amount of that particular bond issue. The pilot proposal would increase the dissemination cap to $10 million, and unbelievably, would allow for up to a 48-hour delay (!) before the trade is reported. We oppose the proposal in its entirety as we believe markets are more efficient with more, not less, information, but we take particular issue with the reporting delay. Ironically, the proposal arguably helps us at CAM because it makes the professional management we provide even more valuable. It will not impact our ability to affect best execution because we are in the corporate market all day every day and have many resources and relationships at our disposal to determine where bonds should trade but the proposal is debilitating to the ability of an individual investor or advisor to engage in price discovery.

To understand the potential real-world implications imagine a scenario where Cincinnati Asset Management (CAM) sells $12 million of a particular bond to a dealer at $100. Remember, the trade does not need to be posted for two days. In the interim you, the reader, log into your brokerage account intending to purchase that same bond. You see a price of $105 offered to you, and see no other trades have posted for this particular bond. CAM’s hypothetical $12 million trade has yet to be reported, and you have no way of knowing about it. That $105 price looks fair to you so you purchase the bond. Shortly thereafter the broker-dealer sells the bonds they bought from CAM at $100.25 and both trades are publicly posted. Now you can see that the bond just traded $100-$100.25 and suddenly it appears that you overpaid. But how could you have known if you are not armed with adequate information? This is the proposal in a nutshell – temporarily hiding data from public view for the benefit of a privileged few.

As far as we can tell the only purpose of this proposal is to provide liquidity to large asset managers at the expense of small investors and to enrich the largest broker dealers on the street. Even if it may help us we are still against this proposal as it stands today because it is simply unfair and it is a step back for the corporate credit market. We believe that transparency is necessary for healthy and fully functioning capital markets and that this transparency is the only way to make the market fair to investors of all types, both large and small.

Looking Ahead

As we turn the page to the second half of the year we see more uncertainty ahead. Global trade continues to dominate the headlines and investors are becoming increasingly concerned about economic growth in the Eurozone. As we go to print with this letter the German 10yr Bund is trading at a record low of -0.36%iv. Geopolitical risk too is at the forefront as tensions between the U.S. and Iran remain high. Although the investment grade credit market has performed quite well to start the year we plan to remain conservative in the positioning of our portfolio. We welcome any questions, comments or concerns. Thank you for your continued interest and support.


This information is intended solely to report on investment strategies identified by Cincinnati Asset Management. Opinions and estimates offered constitute our judgment and are subject to change without notice, as are statements of financial market trends, which are based on current market conditions. This material is not intended as an offer or solicitation to buy, hold or sell any financial instrument. Fixed income securities may be sensitive to prevailing interest rates. When rates rise the value generally declines. Past performance is not a guarantee of future results. Gross of advisory fee performance does not reflect the deduction of investment advisory fees. Our advisory fees are disclosed in Form ADV Part 2A. Accounts managed through brokerage firm programs usually will include additional fees. Returns are calculated monthly in U.S. dollars and include reinvestment of dividends and interest. The index is unmanaged and does not take into account fees, expenses, and transaction costs. It is shown for comparative purposes and is based on information generally available to the public from sources believed to be reliable. No representation is made to its accuracy or completeness.


i Bloomberg, July 1, 2019, 2:08 PM EDT, World Interest Rate Probability (WIRP)
ii FINRA Requests Comment on a Proposed Pilot Program to Study Recommended Changes to Corporate Bond Block Trade Dissemination, April 12, 2019, https://www.finra.org/industry/notices/19-12, Accessed July 1, 2019
iii The Wall Street Journal, June 27, 2019, Bond Fight Pits Main Street Against Wall Street
iv CNBC, July 2, 2019, German 10-year bund yield falls to record low, US Treasurys stable amid softer GDP outlook

15 Jul 2019

2019 Q2 High Yield Quarterly

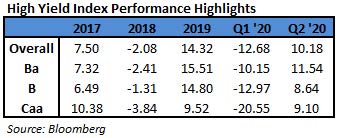
In the second quarter of 2019, the Bloomberg Barclays US Corporate High Yield Index (“Index”) return was 2.50% bringing the year to date (“YTD”) return to 9.94%. The CAM High Yield Composite gross total return for the second quarter was 3.59% bringing the YTD return to 11.07%. The S&P 500 stock index return was 4.30% (including dividends reinvested) for Q2, and the YTD return stands at 18.54%. The 10 year US Treasury rate (“10 year”) spent most of quarter in rally mode finishing at 2.01% and down 0.40% from the beginning of the quarter. During the quarter, the Index option adjusted spread (“OAS”) tightened 14 basis points moving from 391 basis points to 377 basis points. There was a massive 210 basis points of widening that took place in Q4 2018 and since that time, the OAS has tightened 149 basis points. During the second quarter, the higher quality segments of the High Yield Market participated in the spread tightening as BB rated securities tightened 8 basis points and B rated securities tightened 2 basis points. The lowest quality segment, CCC rated securities, widened 10 basis points.

The Banking, Finance, and Insurance sectors were the best performers during the quarter, posting returns of 4.64%, 4.11%, and 3.87%, respectively. On the other hand, Energy, Other Financial, and Basic Industry were the worst performing sectors, posting returns of -0.92%, 1.01%, and 1.66%, respectively. At the industry level, supermarkets, environmental, p&c insurance, and life insurance all posted the best returns. The supermarkets industry (5.35%) posted the highest return. The lowest performing industries during the quarter were oil field services, independent energy, retail REITs, and chemicals. The oil field services industry (-4.37%) posted the lowest return.

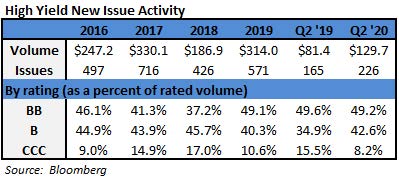
During the second quarter, the high yield primary market posted $81.4 billion in issuance. Issuance within Consumer Discretionary was the strongest with 22% of the total during the quarter. The 2019 second quarter level of issuance was much more than the $52.8 billion posted during the second quarter of 2018. When 2019 is complete, there is little doubt that the final issuance for the year will surpass the $186.9 posted during all of 2018.

The Federal Reserve held two meetings during Q2 2019, and the Federal Funds Target Rate was held steady at both meetings. While the Target Rate didn’t move, the real story was the continued shift in messaging by the Fed. The January FOMC statement showed that the Fed was at least thinking about the end of rate increases. i The March FOMC statement moved further in that direction with officials acknowledging weaker economic reports and downgrading their GDP estimates.ii At a conference in early June, Chairman Powell pushed forward the idea of possible rate cuts.iii The market has taken notice and, as of this writing, investors are pricing in a 100% probability of a cut at the FOMC July meeting.iv As can be seen in the chart at the left, the Fed is still currently out of step from what the market is expecting. While we are interest rate agnostic and do not attempt to time interest rate movements, we are very aware of the impact Fed policy has on the markets. Therefore, we will continue to monitor this very important theme throughout the rest of this year and into 2020.

While the Target Rate moves tend to have a more immediate impact on the short end of the yield curve, yields on intermediate Treasuries decreased 40 basis points over the quarter, as the 10-year Treasury yield was at 2.41% on March 31st, and 2.01% at the end of the quarter. The 5-year Treasury decreased 46 basis points over the quarter, moving from 2.23% on March 31st, to 1.77% at the end of the quarter. Intermediate term yields more often reflect GDP and expectations for future economic growth and inflation rather than actions taken by the FOMC to adjust the Target Rate. Inflation as measured by core CPI has been trending lower since the 2.4% print in mid-2018. The most recent print was 2.0% as of the June 12th report. The revised first quarter GDP print was 3.1% (quarter over quarter annualized rate). The consensus view of economists suggests a GDP for 2019 around 2.5% with inflation expectations around 1.9%.

Besides the Fed’s more dovish messaging, the rising trade tensions between the US and China was another major theme over the course of Q2. Throughout the quarter, both countries were increasingly posturing in order to bolster their negotiating position. However, the market was well aware of the G20 meeting taking place in Japan at the end of June. It was likely that new information would come out of a meeting between President Trump and China’s leader Xi Jinping. Now that the G20 has taken place, regarding the trade talks, Trump said “we’re right back on track.”v It has been universally reported that the meeting between the two leaders was very productive on many of the contested issues. However, at this point, it is very probable that the topic of global trade will remain at the forefront of investors’ minds for quite some time.

Being a more conservative asset manager, Cincinnati Asset Management is structurally underweight CCC and lower rated securities. This positioning has served our clients well so far in 2019. As noted above, our High Yield Composite gross total return has outperformed the Index over the second quarter and YTD measurement periods. With the market remaining robust during the second quarter, our cash position remained the largest drag on our overall performance. Additionally, our underweight positioning in the communications, banking, and finance sectors were a drag on our performance. Further, our credit selections within the communications sector and automotive industry hurt performance. However, our underweight in the energy sector and overweight in the consumer noncyclical sector were bright spots. Further, our credit selections within the midstream, consumer services, and healthcare industries were a benefit to performance.

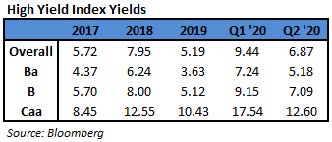
The Bloomberg Barclays US Corporate High Yield Index ended the second quarter with a yield of 5.87%. This yield is an average that is barbelled by the CCC rated cohort yielding 10.14% and a BB rated slice yielding 4.36%. Equity volatility, as measured by the Chicago Board Options Exchange Volatility Index (“VIX”), oscillated a bit throughout the quarter but finished about where it started with a reading of 15. High Yield default volume remained low during the second quarter with only six issuers defaulting. The twelve month default rate was 1.46%. vi Additionally, fundamentals of high yield companies continue to be mostly good. From a technical perspective, supply has increased from the low levels posted in 2018, and flows have been positive relative to the negative flows of 2018. Due to the historically below average default rates, the higher yields available relative to other spread product, and the diversification benefit in the High Yield Market, it is very much an area of select opportunity that deserves to be represented in many client portfolio allocations.

With the High Yield Market remaining very firm in terms of performance, it is important that we exercise discipline and selectivity in our credit choices moving forward. While the first quarter displayed similar returns acrossthe quality buckets, the second quarter began to show investors differentiating a bit on the lower quality spectrum as the CCC bucket underperformed the broader market. As more differentiating creeps into the high quality buckets, it is expected that opportunities for our clients will be presented. The market needs to be carefully monitored to evaluate that the given compensation for the perceived level of risk remains appropriate on a security by security basis. It is important to focus on credit research and buy bonds of corporations that can withstand economic headwinds and also enjoy improved credit metrics in a stable to improving economy. As always, we will continue our search for value and adjust positions as we uncover compelling situations.

This information is intended solely to report on investment strategies identified by Cincinnati Asset Management. Opinions and estimates offered constitute our judgment and are subject to change without notice, as are statements of financial market trends, which are based on current market conditions. This material is not intended as an offer or solicitation to buy, hold or sell any financial instrument. Fixed income securities may be sensitive to prevailing interest rates. When rates rise the value generally declines. Past performance is not a guarantee of future results. Gross of advisory fee performance does not reflect the deduction of investment advisory fees. Our advisory fees are disclosed in Form ADV Part 2A. Accounts managed through brokerage firm programs usually will include additional fees. Returns are calculated monthly in U.S. dollars and include reinvestment of dividends and interest. The index is unmanaged and does not take into account fees, expenses, and transaction costs. It is shown for comparative purposes and is based on information generally available to the public from sources believed to be reliable. No representation is made to its accuracy or completeness.

i Bloomberg January 30,2019: “Fed Folds as Message Shifts to Peak from Pause”

ii Bloomberg March 20, 2019: “Powell’s FOMC Turns Pessimistic and Passive”

iii Bloomberg June 4, 2019: “Powell Signals Openness to Fed Cut”

iv Bloomberg July 1, 2019, 4:00 PM EDT: World Interest Rate Probability (WIRP)

v The New York Times June 29, 2019: “5 Takeaways From the G20 Summit” vi JP Morgan July 1, 2019: “Default Monitor”

12 Jul 2019

CAM High Yield Weekly Insights

CAM High Yield Market Note

7/12/2019


Fund Flows & Issuance: According to a Wells Fargo report, flows week to date were $0.7 billion and year to date flows stand at $13.9 billion. New issuance for the week was $0.8 billion and year to date HY is at $134.1 billion, which is +24% over the same period last year.


(Bloomberg) High Yield Market Highlights


  • U.S. high-yield bonds are set to open with support from climbing stock futures and optimism that central banks will keep interest rates in check. That may allow the market to end the week on a high note after yields widened in all but one of the past four days.
  • The Bloomberg Barclays U.S. Corporate High Yield index returned -0.07% this week through Thursday.
  • Retail funds had a fifth consecutive week of inflows
  • Month- to-date volume stood at $4.6b and July has traditionally been a light month for issuance averaging about $14b in the last six years
  • Yields rose and returns turned negative again across all ratings with Triple-Cs losing the most yesterday
  • While the Bloomberg Barclays high yield index dropped 0.05% yesterday, the energy index posted gains of 0.08%
  • Junk bond YTD returns stand at 10.149%, the highest across fixed income and the best returns since 2016
  • The high yield energy index YTD returns were at 7.359%
  • BBs are the strongest performers, with YTD returns at 10.72%, followed by single Bs at 10.29%
  • CCCs YTD returns stand at 7.73%
  • Loans returns are at 6.016% YTD

(Market Watch) Distress in junk bond prices hit 6-month high in June

  • The U.S. junk-bond market may be flashing a new warning that the credit cycle is nearing its end.
  • About $52.5 billion of corporate bonds issued by U.S. companies with “junk” credit ratings were trading in June at prices below 70 cents on the dollar, the highest amount in six months, according to a J.P. Morgan note.
  • Bonds that trade below par, or face value, can signal concerns about the ability of a borrower, or area of industry, to service its debts. Riskier companies that don’t qualify for top investment-grade ratings are already categorized as high-yield, or junk credits.
  • While distressed bonds in June were just 4.3% of the over $1.2 trillion U.S. junk-bond market, the last time the volume was higher was December.
  • Back then, U.S. debt and equity markets were reeling from a sharp selloff, which was sparked by fears that the Federal Reserve would keep raising rates, even through the U.S. economy was showing signs of slowing.
  • Almost half of the sub-$70 high-yield bonds in June were from the energy sector, while telecommunications added another 21% and health care contributed about 12%, according to J.P. Morgan data.
  • There have been growing concerns about slowing manufacturing in the U.S. and around the potential for sweeping health care reforms if a Democratic candidate ends up seizing the White House from Donald Trump.  


  • (Globe Newswire) Teleflex Announces Publication of a Large Real-World Study


  • Teleflex Incorporated announced the publication of positive results from a multi-center study reaffirming the safety and effectiveness of the minimally invasive UroLift® System for the treatment of benign prostatic hyperplasia (BPH) in real-world patient populations. This is the largest, most comprehensive study to examine a minimally invasive BPH procedure in a real-world setting. Results were published in the Journal of Endourology.
  • The Real-World Retrospective study was designed to evaluate the safety and effectiveness of the UroLift System in a real-world setting and to determine whether clinical outcomes are consistent with those found in controlled studies. The multi-center, retrospective study examined the results of 1,413 consecutive patients who received the UroLift System treatment over two years across 14 sites in North America and Australia.
  • “Not only are the real-world results from this large, multi-center study consistent with the L.I.F.T study, this study also provides data in populations of patients who were not studied in the L.I.F.T study but are seen in a real-world clinic setting,” said Gregg Eure, M.D., urologist at Urology of Virginia in Virginia Beach, Virginia, a lead investigator and co-author of the study. “These findings should give urologists and patients the confidence to adopt the UroLift System within the broader BPH population.”
  • The randomized L.I.F.T. clinical trial demonstrated that treatment with the UroLift System provides patients rapid and durable symptom relief. The minimally invasive procedure, which works without cutting, heating, or removing prostate tissue, demonstrates an excellent safety profile. Unlike BPH thermal therapies such as the most recent steam treatment, the real-world results for the UroLift System treatment showed complication rates and a patient experience that were consistent with controlled clinical trials.  


  • (Reuters) U.S. House seeks documents from companies that run immigrant detention centers
    • Lawmakers in the U.S. House of Representatives said they have sent letters seeking documents and information from three companies responsible for detaining illegal immigrants arrested by U.S. immigration agents.
    • The House Oversight Committee and its House Subcommittee on Civil Rights and Civil Liberties sent letters to CoreCivic Inc, Geo Group Inc, and DC Capital Partners LLC seeking information about the facilities they operate under contract from the U.S. government.
    • “The committee is investigating the Trump administration’s rapidly increasing use of for-profit contractors to detain tens of thousands of immigrants, including a troubling series of reports of health and safety,” Representatives Elijah Cummings and Jamie Raskin wrote in the letters.
    • The two Democrats said the Trump administration had “dramatically escalated” spending on contracts with for-profit companies that operate detention centers.
    • In a separate letter to ICE, the two lawmakers asked for copies of the contracts with the three companies and documents detailing how ICE ensures that contractor-operated detention centers comply with standards set by the Department of Homeland Security.


(Reuters) SunTrust to stop financing private U.S. prison operators


  • SunTrust Bank will stop financing operators of private prisons and immigration holding facilities, it said on Monday, becoming the latest lender to distance itself from a sector associated with the Trump administration’s policies.
  • Banks have been under pressure to cut ties with the private prison industry since U.S. President Donald Trump’s restrictions on immigration raised concerns about detention center conditions. The centers account for about two-thirds of the people held by U.S. Immigration and Customs Enforcement, S&P Global Ratings estimated last year.
  • Earlier this year, Wells Fargo, JPMorgan Chase & Co and Bank of America made similar commitments to phase out relationships with private prison companies.
  • Executives of big banks have been confronted by activists at annual shareholder meetings and grilled by lawmakers about their role in the industry. Private prison operators have argued that activists mischaracterize the nature of their facilities.
  • “It’s unfortunate that misleading political activism has been allowed to impact a decade-long banking relationship,” said Geo Group spokesman Pablo Paez.  


  • (CNBC) President Trump gives executive order to transform kidney care


  • The executive order lays out ambitious goals for shifting 80% of patients currently on kidney dialysis out of high-cost clinic settings to more convenient and cost-effective home care by the end of the next decade.
  • Yet the details of the proposal for achieving that goal appear to be far less threatening to the major dialysis providers than initially feared by many investors.
  • The executive order proposes a 3% increase in home care dialysis reimbursement in the first year of a voluntary Medicare demonstration program, starting in 2020, but that extra boost would phase out over the three-year course of the initiative.
  • Combined, Davita and Fresenius control more than 80% of the kidney dialysis market with the largest share of their revenues and profits coming from their dialysis clinics.
05 Jul 2019

CAM High Yield Weekly Insights

CAM High Yield Market Note

7/5/2019


(Bloomberg) High Yield Market Highlights


  • Retail funds estimated to have received $885m through Tuesday, JPMorgan strategists wrote, citing Lipper data. High-yield bond ETFs recorded inflows of ~$1b in the last four sessions, data compiled by Bloomberg show.
  • Issuance slowed ahead of the Fourth of July holiday and is expected to resume next week
  • Returns rebounded in a holiday-shortened session Wednesday across ratings, with BBs leading the rally.
  • Spreads tightened and yields dropped in thin trading
  • U.S. high yield trading on July 3 was the slowest day in 2019 and volumes dropped the most in almost three months
  • YTD returns climbed back again to close at 10.257% from 10.146%
  • BBs are still the best performers, with a YTD return of 10.832%, followed by single Bs at 10.42%
  • Triple-C YTD returns stand at 7.68%
  • Loans lag bonds with YTD returns of 5.83%  


  • (Wall Street Journal) Oil-Field Services Firm Seeks Chapter 11


  • Weatherford International said it would file for bankruptcy protection after bondholders approved a restructuring agreement that will reduce its total debt by about 70%.
  • The company said it expected to file its chapter 11 petition in U.S. Bankruptcy Court in Houston in what would be one of the biggest oil patch bankruptcies in years.
  • Unsecured bondholders are in line to get all but 1% of the equity in the reorganized business, while shares in the existing company will be canceled.
  • Weatherford, which has about 26,000 employees world-wide, had said in May that it planned to file for bankruptcy after having reached an agreement with creditors holding 62% of its bond debt. The balance-sheet restructuring will reduce its total debt to about $2.5 billion from $8.3 billion, nearly all of which is made up of unsecured bonds. Under the proposed plan, which requires court approval, the bondholders are expected to recover about 63% of what they are owed based on the proposed valuation of the company. Weatherford blamed its bankruptcy filing, in part, on volatility in oil and natural gas prices.
  • As oil-and-gas companies’ spending on exploration, development and production of oil and natural gas has decreased, so has demand for Weatherford’s services and products, the company said in a filing with the Securities and Exchange Commission. Weatherford said its cash flows from operations have been negative the past three fiscal years.


(Wall Street Journal) OPEC Agrees to Extend Output-Cut Pact


  • OPEC agreed to roll over its production cuts into the first quarter of 2020, the cartel’s officials said, but the new pact exposed deepening geopolitical fractures among members of the group.
  • The discussions over long-term cooperation plans highlighted the risks of the cartel’s alliance with Russia: OPEC needs the partnership to compete with U.S. shale producers, but longstanding members say they feel ostracized by the alliance.
  • OPEC reached a consensus on oil output without much drama Monday, but the cartel hit an impasse when it sought agreement on whether it should continue working with Russia and its allies to balance oil markets once the nine-month plan expires.
  • Iran initially objected, but after talks lasting five hours and involving a separate meeting between Iranian and Saudi officials both sides reached a compromise on long-term cooperation with Russia, OPEC officials said.
  • Over the weekend, Russian President Vladimir Putin revealed that Saudi Arabia — OPEC’s de facto leader — and Russia had already agreed to maintain the output cuts at current volumes, which run at around 1.2 million barrels a day. The news left some in OPEC feeling overshadowed by two of the world’s largest oil producers, OPEC officials said.

(Bloomberg) T-Mobile on Cusp of Justice Department Approval for Sprint


  • T-Mobile U.S. Inc. is on the cusp of securing U.S. Justice Department approval for its $26.5 billion merger with Sprint Corp., after establishing the general outlines of asset sales to Dish Network Corp., according to people familiar with the matter.
  • The Justice Department is hammering out final issues with T-Mobile on an agreement aimed at ensuring Dish can become a strong fourth competitor in the U.S. wireless market, said the people, who asked to not be identified because the matter isn’t public. While the sticking points aren’t insurmountable, the Justice Department has yet to bless the arrangement to allow Sprint’s acquisition to proceed.
  • T-Mobile is trying to offer just enough concessions to gain approval but not so many that it creates a formidable rival while the Justice Department is aiming to maximize competition, the people said.