Fund Flows & Issuance: According to a Wells Fargo report, flows week to date were $0.2 billion and year to date flows stand at -$6.2 billion. New issuance for the week was $5.2 billion and year to date issuance is at $459.9 billion.
(Bloomberg) High Yield Market Highlights
- The recent selloff in the U.S. junk-bond market looks like the distant past as the index is now poised to post gains for the second consecutive week, and potentially the biggest gains in more than three months.
- The riskiest segment of the junk bond market, CCCs, are also on track to close the week with the highest returns since the end of August and are likely to be the best-performing asset class in the U.S. fixed-income market.
- Returns on the broader junk-bond index week-to-date stood at 0.67% and CCC gains at 0.8%.
- As investors rush back to the asset, U.S. high-yield funds saw an inflow for the week after outflows the two previous weeks.
- “The late November weakness in risk assets has come and gone, with sentiment reversing completely in December,” Barclays strategist Brad Rogoff wrote on Friday.
- In corporate cash markets, the high-yield to investment-grade spread has shrunk after the recent decompression, Barclays wrote in the note.
- The primary market was steady pricing deals to take the week’s tally to more than $5b.
- The broader junk bond yields rose 6bps to close at 4.46% but will end the week lower for the second time this month.
- The Single B index may see the biggest weekly gains in 12 months, with week-to-date returns of 0.72%.
- CCC yields closed at 7.06% and may end the week lower to see the biggest weekly drop in more than three months.
(Wall Street Journal) U.S. Jobless Claims Fall to Lowest Level in 52 Years
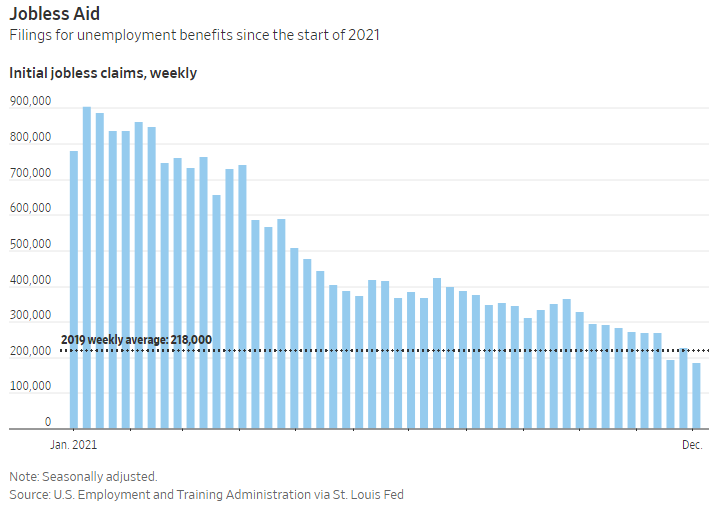
- Worker filings for unemployment benefits hit the lowest level in more than half a century last week as a tight labor market keeps layoffs low.
- Initial jobless claims, a proxy for layoffs, fell to 184,000 in the week ended Dec. 4, the lowest level since September 1969, the Labor Department said Thursday. That was close to a recent record total of 194,000 recorded in late November.
- The prior week’s level was revised up to 227,000. The four-week moving average, which smooths out weekly volatility, fell to 218,750.
- Unemployment claims have been steadily falling all year as the labor market has tightened. They have now fallen below where they were before the pandemic caused layoffs to surge in March 2020. Claims averaged 218,000 in 2019, the year before the pandemic hit the U.S.
- Economists say seasonal volatility around the holiday season may have contributed to last week’s low number.
- The decline in new claims is an indication that employers are reluctant to lay off workers as jobs are plentiful, consumer demand is high and the pool of prospective workers remains lower than before the pandemic.
- “We expect claims will start to more consistently hover around pre-Covid averages of 220,000 or perhaps slightly lower given current tight labor market conditions,” said Nancy Vanden Houten, lead economist at Oxford Economics.
- More unemployed workers should eventually get new jobs as they exhaust their benefits, she added.
- The unemployment rate fell to 4.2% in November from 4.6% in October, the Labor Department reported Friday. The share of people ages 25 to 54 who are either working or looking for work rose to 82.1% from 81.9%, a sign that prime-age Americans are starting to get back into the labor force. But the labor-force participation rate for that age group remains below where it was in February 2020, when it stood at 83.1%.
- “The overriding dynamic in the job market of late has been this shortage of workers,” said Mark Hamrick, senior economic analyst at Bankrate. “The issue of fresh job loss has not been key for many months now.”