
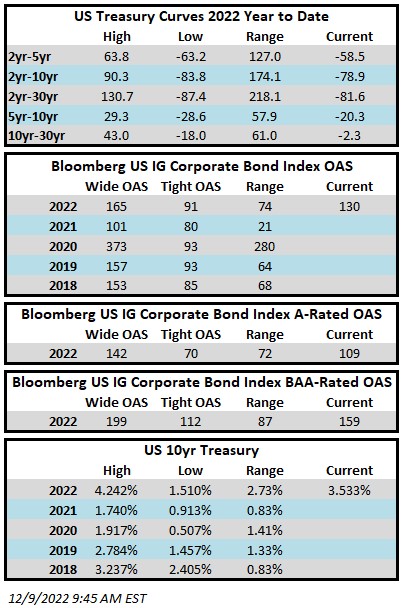
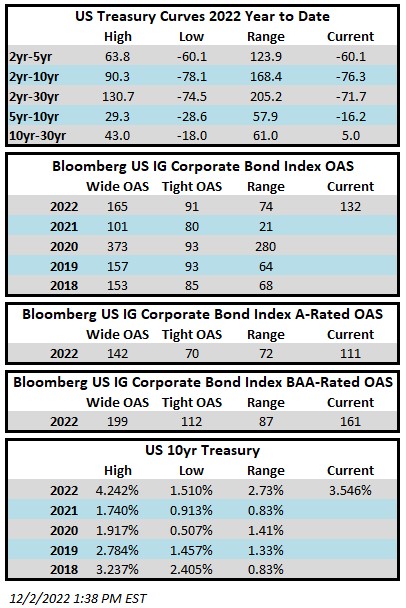
Investment grade credit spreads were mostly flat throughout the week without much change. The Bloomberg US Corporate Bond Index closed at 130 on Thursday December 8 after having closed the week prior at 130. Treasury volatility moderated this week as rates did not move materially for the first time in several weeks. The 10yr Treasury closed the week prior at 3.49% and it is trading at 3.53% as we go to print. Through this Thursday the Corporate Index had a YTD total return of -13.6% while the YTD S&P500 Index return was -15.6% and the Nasdaq Composite Index return was -28.8%.
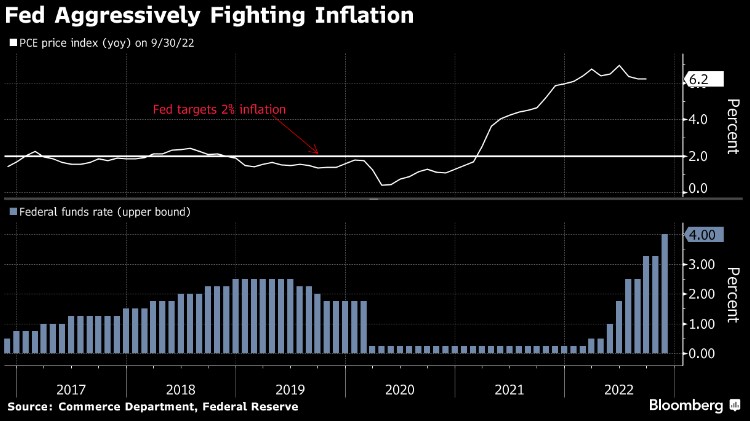
The most meaningful economic data of the week was released this Friday morning. U.S. producer prices rose more than forecast during the month of November. This could lend credence to the case for additional Fed rate hikes but it was the smallest annual increase in PPI in 18 months so the Fed will be pleased to see that things are moving in the right direction. Also on Friday morning we learned that consumer sentiment improved and consumer concerns over inflation have eased over the course of the last month. These data points were merely appetizers as a feast of economic data awaits us next week. Things get started with the CPI release on Tuesday morning –if inflation comes in hotter than expected then it could make for a very volatile trading session. On Wednesday afternoon we get an FOMC rate decision followed by rate decisions by the ECB and BOE on Thursday morning. Each of these three central banks are expected to slow the pace of their rate hikes from 75bps to 50bps and if any of them deviate from this and surprise to the upside it could make for an interesting trading session.
The primary market had a slow week as it appears that most issuers have packed it in for the year. Just $4.25bln in new debt was priced and if this pattern holds then it could be the lowest volume for a December in more than 15 years according to data compiled by Bloomberg. The 2022 issuance tally stands at $1,180bln which trails 2021’s pace by ~14%.
Investment grade credit reported an inflow for the week. Per data compiled by Wells Fargo, outflows for the week of December 1–7 were +1.0bln which brings the year-to-date total to -$160.2bln.
This information is intended solely to report on investment strategies identified by Cincinnati Asset Management. Opinions and estimates offered constitute our judgment and are subject to change without notice, as are statements of financial market trends, which are based on current market conditions. This material is not intended as an offer or solicitation to buy, hold or sell any financial instrument. Fixed income securities may be sensitive to prevailing interest rates. When rates rise the value generally declines. Past performance is not a guarantee of future results.

")
")
")
")
")
")
