In the fourth quarter of 2022, the Bloomberg US Corporate High Yield Index (“Index”) return was 4.17% bringing the year to date (“YTD”) return to -11.19%. The S&P 500 stock index return was 7.55% (including dividends reinvested) for Q4, and the YTD return stands at -18.13%.
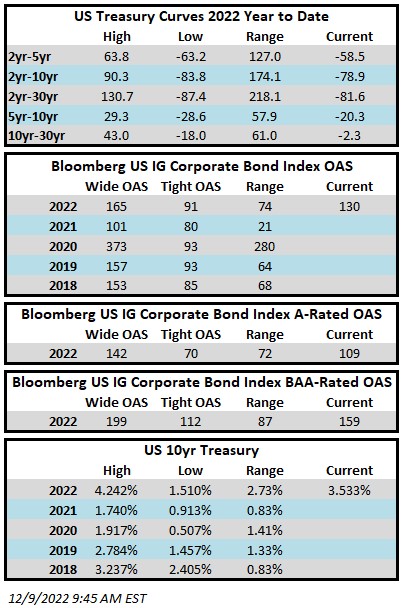
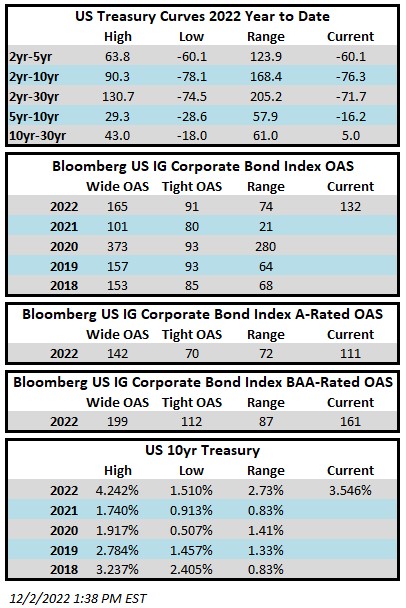
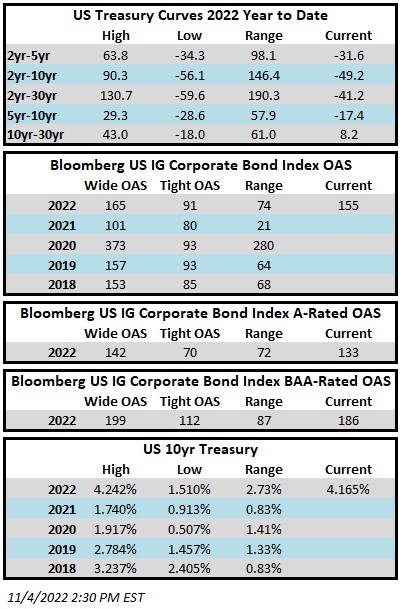
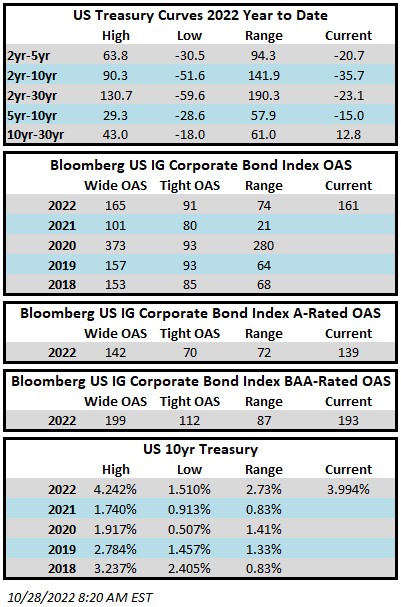
The 10 year US Treasury rate (“10 year”) finished at 3.88%, up 0.05% from the beginning of the quarter but did show a bit of volatility with a high in October of 4.24% and a low in December of 3.42%. Over the period, the Index option adjusted spread (“OAS”) tightened 83 basis points moving from 552 basis points to 469 basis points. All quality segments of the High Yield Market participated in the spread tightening as BB rated securities tightened 59 basis points, and B rated securities tightened 130 basis points, and CCC rated securities tightened 96 basis points. The chart below from Bloomberg displays the spread moves in the Index over the past ten years with an average level of 428 basis points.

The Basic Industry, Banking, and Finance Companies sectors were the best performers during the quarter, posting returns of 6.52%, 6.33%, and 6.10%, respectively. On the other hand, Communications, Technology, and Other Financial were the worst performing sectors, posting returns of 1.82%, 3.04%, and 3.06%, respectively. At the industry level, gaming, oil field services, and pharma all posted the best returns. The gaming industry posted the highest return 9.04%. The lowest performing industries during the quarter were media, healthcare REITs, and retailers. The media industry posted the lowest return 0.04%.

Crude oil had a few spikes above $90 per barrel as OPEC+ members agreed to cut oil production by two million barrels per day. Those levels did not remain long as a concern for economic growth took hold and prices marched lower by roughly $20 per barrel. As we go to print in early January, crude is at $73 per barrel. “A panel formed of key nations in the OPEC+ alliance is due to hold a monitoring meeting on Feb. 1. In the meantime, Saudi Energy Minister Prince Abdulaziz bin Salman has said the group will remain “pre-emptive” to keep the crude market in equilibrium.”i

The primary market remained very subdued during the fourth quarter. The weak market led to full year 2022 issuance of $115.9 billion and $20.7 billion in the quarter. The chart to the left gives a sense of just how low issuance was in 2022 relative to the past handful of years. Discretionary took 31% of the market share followed by Technology at a 17% share. Currently, there isn’t much concern for lack of capital access due to issuers being so proactive with refinancing in the past few years

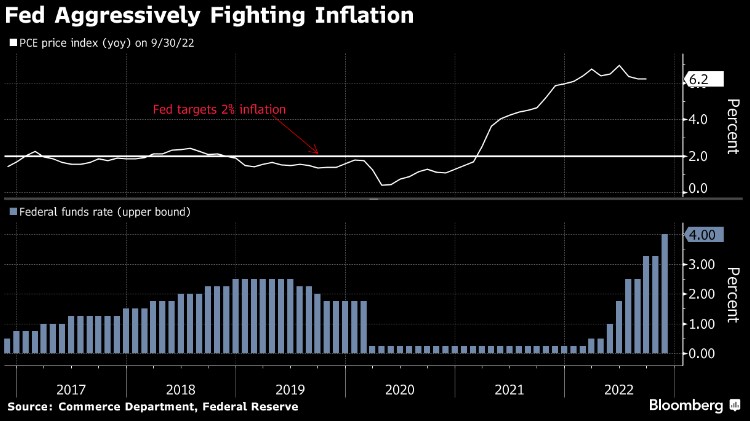
After the Federal Reserve lifted the Target Rate by 0.75% at their June meeting, Fed Chair Jerome Powell acknowledged that the hike was “an unusually large one.” The Fed then proceeded to lift the Target Rate at a 0.75% clip at the next three consecutive meetings before downshifting to a 0.50% increase at the December meeting. All told, the Fed completed 425 basis points of raises in 2022. The dot plot chart shows how the Fed projections of the 2022 year-end Target Rate have evolved over the past year. The Fed was clearly behind the curve in keeping rates too low for too long and needed to play catch-up. It remains to be seen whether they miss on the other side by raising rates too high. Michael Feroli, chief US economist at JPMorgan said, officials “realize that the risk of overtightening is just something that they have to swallow and stomach.”ii Chair Jerome Powell acknowledged at the December post-meeting press conference that there is “more work to do,” and the minutes showed Fed officials are intent on lowering inflation back toward their 2% target at the risk of rising unemployment and slower growth.
Intermediate Treasuries increased 5 basis points over the quarter, as the 10-year Treasury yield was at 3.83% on September 30th, and 3.88% at the end of the third quarter. The 5-year Treasury decreased 9 basis points over the quarter, moving from 4.09% on September 30th, to 4.00% at the end of the third quarter. Intermediate term yields more often reflect GDP and expectations for future economic growth and inflation rather than actions taken by the FOMC to adjust the Target Rate. The revised third quarter GDP print was 3.2% (quarter over quarter annualized rate). Looking forward, the current consensus view of economists suggests a GDP for 2023 around 0.3% with inflation expectations around 4.0%.iii

Being a more conservative asset manager, Cincinnati Asset Management Inc. does not buy CCC and lower rated securities. Additionally, our interest rate agnostic philosophy keeps us generally positioned in the five to ten year maturity timeframe. After three quarters of negative performance, Q4 closed positive with quality leading the way. That quality focus that CAM is known for was certainly on display this quarter. Further, our underweight within communications and our credit selections within aerospace & defense and consumer cyclicals were a benefit to performance. The cash position was a drag on performance as was our credit selections within food & beverage. All totaled, the CAM High Yield Composite Q4 gross of fees total return of 4.78% (4.71% net of fees) outperformed the Index. The full year 2022 Composite gross of fees total return of -12.90% (-13.16% net of fees) underperformed the Index. Additionally, the Composite 5-year annualized gross of fees total return was 1.87% (1.55% net of fees) versus 2.31% for the Index, and the Composite 10-year annualized gross of fees total return was 2.33% (1.99% net of fees) versus 4.03% for the Index.

The Bloomberg US Corporate High Yield Index ended the fourth quarter with a yield of 8.96%. Equity volatility, as measured by the Chicago Board Options Exchange Volatility Index (“VIX”), had an average of 25 over the quarter moving from a high of 33 in mid-October to a low of 19 in early December. For context, the average was 15 over the course of 2019, 29 for 2020, and 19 for 2021. The fourth quarter had zero bond issuers default on their debt. The trailing twelve month default rate stands at 0.84%.iv The current default rate is relative to the 0.27%, 0.23%, 0.86%, 0.83% default rates from the previous four quarter end data points listed oldest to most recent. The fundamentals of high yield companies still look good considering the economic backdrop. From a technical view, fund flows were positive in October and November but negative in December. The 2022 year-to-date outflow stands at $56.6 billion.v While this was the second worst high yield market on record, it is important to remember that bonds are a contractual agreement with a defined maturity date. Thus, despite price volatility, without default, par will be paid at the stated maturity date. Currently, defaults are quite low and fundamentals are still providing a cushion. No doubt there are risks, but we are of the belief that for clients that have an investment horizon over a complete market cycle, high yield deserves to be considered as part of the portfolio allocation.
As we move into 2023, the Fed will continue to remain a large part of the story. The message from the Fed is unequivocal. Breaking the back of inflation is job number one. While caution is warranted as uncertainty remains around the cycle’s terminal rate and depth of an economic slowdown, it seems like progress is being made as there has been five consecutive lower inflation reports. Markets have been roughed up this year, but brighter days will eventually appear. As this cycle plays out, current uncertainty and volatility can create opportunities that lead back to positive returns. Our exercise of discipline and selectivity in credit selections is important as we continue to evaluate that the given compensation for the perceived level of risk remains appropriate. As always, we will continue our search for value and adjust positions as we uncover compelling situations. Finally, we are very grateful for the trust placed in our team to manage your capital.
This information is intended solely to report on investment strategies identified by Cincinnati Asset Management. Opinions and estimates offered constitute our judgment and are subject to change without notice, as are statements of financial market trends, which are based on current market conditions. This material is not intended as an offer or solicitation to buy, hold or sell any financial instrument. Fixed income securities may be sensitive to prevailing interest rates. When rates rise the value generally declines. Past performance is not a guarantee of future results. Gross of advisory fee performance does not reflect the deduction of investment advisory fees. Our advisory fees are disclosed in Form ADV Part 2A. Accounts managed through brokerage firm programs usually will include additional fees. Returns are calculated monthly in U.S. dollars and include reinvestment of dividends and interest. The index is unmanaged and does not take into account fees, expenses, and transaction costs. It is shown for comparative purposes and is based on information generally available to the public from sources believed to be reliable. No representation is made to its accuracy or completeness. Additional disclosures on the material risks and potential benefits of investing in corporate bonds are available on our website: https://www.cambonds.com/disclosure-statements/.
i Bloomberg January 4, 2023: Saudi Arabia Kept Oil Exports Steady in December
ii Bloomberg January 4, 2023: Fed Affirms Inflation Resolve
iii Bloomberg January 4, 2023: Economic Forecasts (ECFC)
iv JP Morgan January 3, 2023: “Default Monitor”
v Wells Fargo December 29, 2022: “Credit Flows”