Category: Insight

14 Jan 2022

CAM High Yield Weekly Insights

 Fund Flows & Issuance:  According to a Wells Fargo report, flows week to date were -$1.6 billion and year to date flows stand at -$1.0 billion.  New issuance for the week was $6.0 billion and year to date issuance is at $10.5 billion.

 (Bloomberg)  High Yield Market Highlights

  • The U.S. junk-bond market rebounded from last week’s losses and is on track to end the week with gains, powered by a jump in oil prices and shrugging off outflows from retail funds. The rally boosted the primary market, which has seen $6 billion price.
  • The risk-on mood was evident as two first-time issuers came to market. Borrowers sold debt to fund a dividend and buy back shares even as investors pulled cash from U.S. high-yield funds.
  • The broader junk-bond index has made modest gains of 0.28% week-to-date after posting a small loss of 0.05% on Thursday.
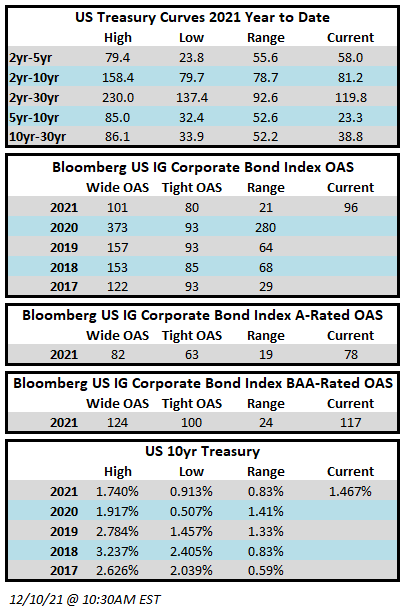
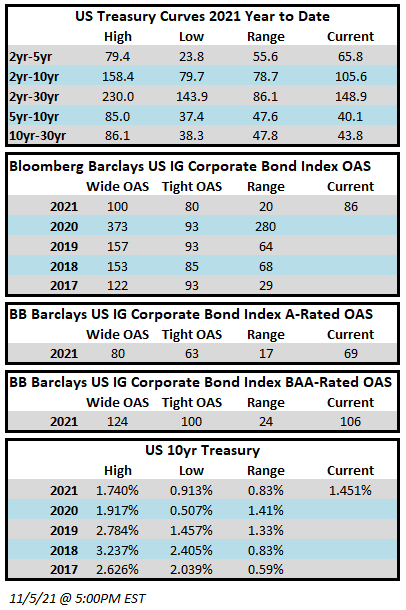
  • Junk-bond index yields rose to 4.51% yesterday, up 6bps, and is down 9bps week-to-date.
  • The CCC index has gained 0.31% week-to-date after posting a modest loss of 0.02% yesterday.
  • CCC yields rose 4bps to close at 6.95%, down 11bps week-to-date.
  • The markets may waver as U.S. equity futures fluctuated ahead of the earnings season as investors turn away from inflation concerns and Federal Reserve policy. And oil, meanwhile, headed for a fourth straight weekly gain, the longest streak since October.


(Bloomberg)  U.S. Inflation Hits 39-Year High of 7%, Sets Stage for Fed Hike

  • U.S. consumer prices soared last year by the most in nearly four decades, sapping the purchasing power of American families and setting the stage for the Federal Reserve to begin hiking interest rates as soon as March.
  • The consumer price index climbed 7% in 2021, the largest 12-month gain since June 1982, according to Labor Department data released Wednesday. The widely followed inflation gauge rose 0.5% from November, exceeding forecasts.
  • Excluding the volatile food and energy components, so-called core prices accelerated from a month earlier, rising by a larger-than-forecast 0.6%. The measure jumped 5.5% from a year earlier, the biggest advance since 1991.
  • The increase in the CPI was led by higher prices for shelter and used vehicles. Food costs also contributed. Energy prices, which were a key driver of inflation through most of 2021, fell last month.
  • The data bolster expectations that the Fed will begin raising interest rates in March, a sharp policy adjustment from the timeline projected just a few months ago. High inflation has proven more stubborn and widespread than the central bank predicted amid unprecedented demand for goods along with capacity constraints related to the supply of both labor and materials.
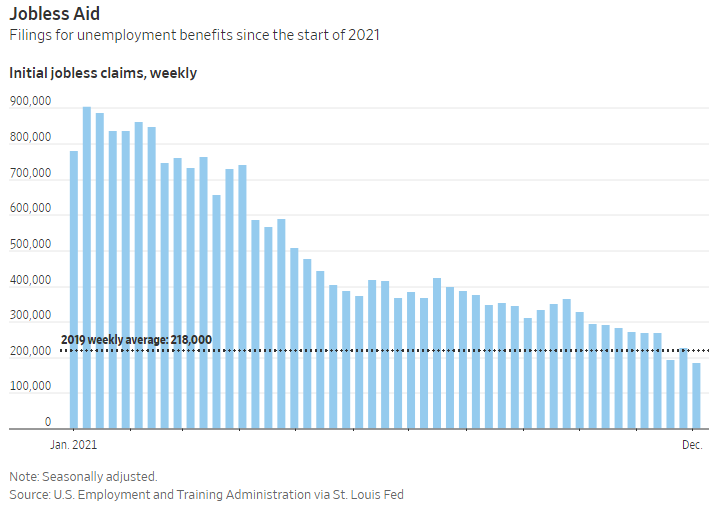
  • Meanwhile, the unemployment rate has now fallen below 4%. Against this evolving backdrop, some Fed policy makers have said that it could be appropriate to begin shrinking the central bank’s balance sheet soon after raising rates.
  • “In terms of where the Fed is on their dual mandate — inflation and the labor market — they’re basically there,” Michael Gapen, chief U.S. economist at Barclays Plc, said on Bloomberg Television. “I don’t really think anything stops them going in March except one of these kind of outlier events. I think they’re ready.”


(Bloomberg)  U.S. Retail Sales Slide Most in 10 Months on Inflation, Omicron

  • U.S. retail sales slumped in December by the most in 10 months, suggesting the fastest inflation in decades is taking a greater toll on consumers just as the nation confronts more coronavirus infections.
  • The value of overall purchases decreased 1.9%, after a revised 0.2% gain a month earlier, Commerce Department figures showed Friday.
  • The median estimate in a Bloomberg survey called for a 0.1% drop in overall retail sales from the prior month.
  • The year-end slide in retail purchases sets up for a tepid handoff to the first quarter. Combined with the impact from the omicron variant, which is denting outlays for services such as travel and dining out, the figures help explain why economists project household spending to soften.
  • Furthermore, falling price-adjusted wages, dwindling savings and the end of the government’s pandemic-related financial programs suggest a more moderate pace of spending.
  • December, at the tail end of the holiday-shopping season, is traditionally a solid month for retail sales. However, concerns about shipping delays prompted many consumers to shop earlier than usual to ensure gifts arrived on time. Because the figures are adjusted for seasonal variations, the earlier shopping may have contributed to the weaker-than-expected figures.


(Bloomberg)  Fed’s Brainard Says Curbing Inflation Is ‘Most Important Task’

  • Federal Reserve Governor Lael Brainard said tackling inflation and getting it back down to 2% while sustaining an inclusive recovery is the U.S. central bank’s most pressing task.
  • “Inflation is too high, and working people around the country are concerned about how far their paychecks will go,” Brainard said in remarks prepared for a confirmation hearing before the Senate Banking Committee. “Our monetary policy is focused on getting inflation back down to 2% while sustaining a recovery that includes everyone. This is our most important task.”
  • Brainard was nominated by President Joe Biden to serve as Fed vice chair.
11 Jan 2022

2021 Q4 Investment Grade Quarterly

Investment grade corporate credit spreads finished the year little changed. For the full year 2021, the option adjusted spread (OAS) on the Bloomberg US Corporate Bond Index tightened by 4 basis points to 92 after having opened the year at an OAS of 96. The 4th quarter saw more movement, with the spread on the index moving wider, opening the quarter at 84 and closing at 92.

Treasuries finished the 4th quarter nearly unchanged. The 10yr Treasury opened the 4th quarter at 1.49% and closed at 1.51%. There was much more movement within the full year number with the benchmark 10yr opening 2021 at 0.91% and closing as high as 1.74% at the end of the first quarter before receding into the close of the second quarter and then trading higher from there, closing the full year 60 basis points higher at 1.51%.

The Corporate Index eked out a positive return during the fourth quarter, posting a total return of +0.23%. This compares to CAM’s net 4th quarter total return of -0.30%.

For the full year 2021, although spreads were slightly tighter, it was not enough to offset the move higher in interest rates. The Corporate Index posted a full year total return of -1.04%. This compares to CAM’s net full year total return of -1.38%.

Few Things Worked in 2021
Broadly speaking it was a tough year for investment grade credit. The Long portion (10+ years to maturity) of the US Corporate Index underperformed the Intermediate portion by 13 basis points on the back of higher Treasury rates. The “risk-on” trade has been in full effect since mid-2020 and that theme continued in 2021 with lower quality IG credit outperforming higher quality during 2021.

Recall that CAM has a structural underweight in Baa-credit and targets a ceiling of 30% exposure to this riskier segment of the market while the index is >50% Baa-rated. CAM also targets an A rating for its client portfolios
while the index is rated A3/Baa1.

As far as individual sectors go, there were a couple winners. At the sector level, only Energy and the Other Industrial sectors posted positive total returns on the year, of +1.39% and +0.88%, respectively. While Energy represented a major sector with a 7.72% index weighting, Other Industrial is quite small and represented just 0.48% of the Corporate Index. As far as individual industries were concerned, those industries under the Energy umbrella led the way with Independent Energy, Oil Field Services, Refining and Midstream posting total returns of +1.60%, +2.45%, +2.48% and +2.46%, respectively. The best performing individual industry was Airlines with a +4.48% total return.

The sectors that posted the biggest losses were Utilities, Technology and Consumer Noncyclical with returns of -2.15%, -1.98% and -1.30%, respectively. It may seem counterintuitive but while these industries are some of the most stable, high quality was not in favor during 2021 and instead risk taking ruled the day. Outside of the various utility sub-industries, the worst performing individual industries were Tobacco and Cable & Satellite with returns of -2.32% and -2.12%, respectively.

A Year of Little Change
2021 was one of the least volatile years for IG credit—the index OAS traded in a range of just 21 basis points. To find a less volatile year we have to go all the way back to 2006 when the range was just 12 basis points.

Ironically, the low volatility of 2006 continued well into 2007, just prior to the two most chaotic years in the history of investment grade credit. Please note that we do not expect a repeat performance of this in 2022 given the exogenous factors that were in play back in 2008-2009. In fact we predict quite the opposite, and our opinion is that 2022 will be a year of spread stability similar to 2021. There have been sustained periods of time in the history of our market where spreads have traded at levels beneath or near 100, and barring a geopolitical crisis or unexpected shock to the global economy, we see little reason that spreads should move meaningfully over the course of the next year. They may move wider or they may move tighter but we feel pretty comfortable pegging a spread of 100 +/- 20bps type of valuation target for the end of 2022.

Predicting fund flows is always a difficult but, even after $323.8 billion of inflows during 2021 into IG credit, making it the second largest year on record, we expect demand to remain positive going into 2022i. After such a strong performance for equities in 2021, pension funds will continue to look to rebalance and demand from institutional investors both domestic and foreign should remain strong. Additionally, IG credit will likely benefit from “flattish” gross new issuance supply and most Wall Street prognosticators are predicting substantially less net new issue supply as the amount of debt that matures in 2022 is larger than what we have experienced in recent years. Less supply of new bonds creates a more supportive environment for credit spreads in the secondary market and for the market as a whole. One factor that could make a difference at the margin is the amount of high yield debt that is upgraded to investment grade during the course of the year. Current expectations are calling for a robust upgrade cycle in 2022 and these companies will often issue new debt when they achieve investment grade status. Past experience tells us that much of this debt ends up being “leverage neutral” as lower interest rate investment grade debt is used to retire higher interest rate legacy high yield debt. However, the debt is still net new for the investment grade market since these companies were previously part of the high yield market. If we experience even more upgrades than the upper limit of the rosiest predictions then that could make for higher new issue supply numbers within the IG market.

In our view, the biggest potential driver of benign spread volatility during 2022 is that the economy is likely to continue to grow at above average levels and that the typical investment grade company is in good health from a balance sheet perspective. The median real GDP forecast is predicting growth of +3.9% in 2022 which is solidly above trendii. Companies are still sitting on elevated cash balances but as we have written about in past commentaries this will not last forever. As we move into 2022, it becomes increasingly likely that this cash will start being deployed for shareholder returns and M&A will move to the forefront. 2022 is shaping up to be much more of a credit pickers market instead of a market that generically rewards all risk-taking.

The Return of Dispersion

We have seen erosion in the quality of the investment grade universe, especially over the course of the last dozen years. That data set below is representative of just the past 10 years but the trend really started to manifest itself at the end of 2008, when the Corporate Index was just 33.15% Baa-rated compared to today when it is north of 50%.

Since 2008, the proportion of Baa-rated credit has crept higher with each passing year. There is some noise in these numbers, given the wave of downgrades from investment grade to high yield that occurred in 2020 and that is precisely why the percentage of Baa-rated debt decreased from 2019-2020 –those companies exited the investment grade universe entirely and joined the high yield universe. So the IG universe increased its quality by subtraction, not by improving its credit metrics. Many of these companies that were downgraded to junk have since repaired their balance sheets and some will earn upgrades and will be returning to investment grade in 2022, boosting the number of lower rated IG companies by the end of the year. Additionally, there are a relatively large number of rising stars within the high yield ranks currently that were not previously rated IG, many of which will be earning upgrades throughout the year. Taking it altogether, there is a good chance that year end 2022 will mark a new high for the proportion of Baa-rated credit within the Corporate Bond Index.

The purpose of this example is not to show that all Baa-risk is bad, because that is not the case. Consistently, the worst performers in IG credit are those companies that move from Aa or A rated down to Baa. On the other hand, some of the best performing credits are those companies that are currently high yield or split rated (half high yield, half investment grade) with the potential to improve their credit metrics and earn a full investment grade rating. We believe that 2022 will offer opportunity, both in the form of identifying such companies and by avoiding those weakly positioned A-rated credits that will join the ranks of the growing Baa-rated cohort. This is one of the reasons that you will see us occasionally invest in companies with just one IG rating and up to 1 or 2 HY ratings. It is usually because we expect the company to become fully IG-rated and we want to take advantage of associated spread compression for our clients. We also do not hamper ourselves with “automatic sale” rules in the event that a current portfolio holding loses IG ratings by getting downgraded to HY. Instead we will rely on our credit research to determine if it makes sense to continue to hold the bonds of a downgraded company and if it has a chance to regain IG status over our investment time horizon. The Baa-universe is chock full companies with bonds that trade at unattractive valuations from a risk reward standpoint. We are looking to provide our clients with a return that is equal to or greater than the Corporate Index but we want to do so by incurring less volatility –hence our structural underweight of Baa-rated credit versus the index. At the end of the day the only way an investor can identify these opportunities is by blocking and tackling and good old fashioned credit work which is one of the cornerstones of our investment grade program and but one of the ways we will look to add value for our clients in the year ahead.

The Federal Reserve & The “I” Word

At its November meeting, the Fed signaled its intent to complete the tapering of its asset purchases by the end of June. However, the landscape had changed by the time the December 15 meeting came around, and in a move to combat rising inflation, the Fed accelerated its tapering timeline. The Fed now expects to finish its taper by the end of March which would create the potential for a Fed Funds rate hike as soon as its March 16 2022 meetingiii. With the end of tapering occurring in the near term, it will be quite interesting to hear the Fed’s plans for the central bank’s $8.76 trillion asset portfolio. Discussions are ongoing and will continue at the January 2022 FOMC meeting but Chairman Powell and other Fed officials have hinted that shrinking the asset portfolio could be another arrow in the quiver that it may use to rein in inflationiv. It could be that the Fed elects to play it very slow with increases in the Fed Funds Rate, instead relying on balance sheet reduction to slow the economy and cool inflation toward its long term target level of 2%. The Fed believes that inflation will slow in the second half of 2022 and this is in line with the consensus view of most economists. In short, we believe the Fed will use all the tools at its disposal to make this a reality even if it means they must use some measures to slow economic growth.

Wrap It Up
2022 is poised to be an interesting year for the credit markets. Although we don’t expect wild swings in the level of credit spreads there could be some pockets of rate-driven volatility at times throughout the year as the Fed embarks on its first tightening cycle since 2018. Inflation will remain at the forefront and time will tell if those pressures ease in the second half of the year. The pandemic enters its third year and geopolitical uncertainty looms as it pertains to Russian and the Ukraine, both of which could impact risk assets or spark a flight to quality. The case for Investment Grade as an asset class today is for its downside protection, diversification and income generation. The time will come when total returns move back to the forefront but it is hard to make an argument for more than coupon-like returns in the current environment. Investors with strategic goals and medium to long time horizons have recognized the benefits of a permanent allocation to IG credit.

We wish you a happy and healthy 2022. We will be doing our best to navigate the credit markets in a successful manner and we appreciate the trust you have placed in us as a manager of your hard earned capital. As always, thank you for your business and please do not hesitate to reach out to us with any questions or comments.

i Wells Fargo Securities, January 3 2022 “Credit Flows | Special FY 2021 Edition”
ii Bloomberg, January 3 2022 “US GDP Economic Forecast Real GDP (YoY%) (78 responses)
iii Federal Reserve Open Market Committee, December 15 2021 “Statement Release”
iv The Wall Street Journal, January 4 2022 “Fed Weights Proposals for Eventual Reduction in Bond Holding”

This information is intended solely to report on investment strategies identified by Cincinnati Asset Management. Opinions and estimates offered constitute our judgment and are subject to change without notice, as are statements of financial market trends, which are based on current market conditions. This material is not intended as an offer or solicitation to buy, hold or sell any financial instrument. Fixed income securities may be sensitive to prevailing interest rates. When rates rise the value generally declines. Past performance is not a guarantee of future results. Gross of advisory fee performance does not reflect the deduction of investment advisory fees. Our advisory fees are disclosed in Form ADV Part 2A. Accounts managed through brokerage firm programs usually will include additional fees. Returns are calculated monthly in U.S. dollars and include reinvestment of dividends and interest. The index is unmanaged and does not take into account fees, expenses, and transaction costs. It is shown for comparative purposes and is based on information generally available to the public from sources believed to be reliable. No representation is made to its accuracy or completeness.

11 Jan 2022

2021 Q4 High Yield Quarterly

In the fourth quarter of 2021, the Bloomberg Barclays US Corporate High Yield Index (“Index”) return was 0.71% bringing the year to date (“YTD”) return to 5.28%. The CAM High Yield Composite net of fees total return was 0.45% bringing the YTD net of fees return to 4.03%. The S&P 500 stock index return was 11.02% (including dividends reinvested) for Q4, and the YTD return stands at 28.68%.

The 10 year US Treasury rate (“10 year”) was mostly range bound finishing at 1.51%, up 0.02% from the beginning of the quarter. Over the period, the Index option adjusted spread (“OAS”) tightened 6 basis points moving from 289 basis points to 283 basis points. The top two quality segments of the High Yield Market participated in the spread tightening as BB rated securities tightened 9 basis points and B rated securities tightened 14 basis points, while the CCC rated securities widened 25 basis points. Take a look at the chart below from Bloomberg to see a visual of the spread moves in the Index over the past five years. The graph illustrates the speed of the spread move in both directions during 2020 and the continuation of lower spreads in the first half of 2021. The OAS record low (not shown) is 233 basis points set back in 2007.

The Energy, Other Industrial, and Finance Companies sectors were the best performers during the quarter, posting returns of 1.56%, 1.38%, and 1.23%, respectively. On the other hand, Communications, Banking, and REITs were the worst performing sectors, posting returns of -0.24%, 0.05%, and 0.27%, respectively. Clearly the market was strong as only one sector posted a negative return in the period. At the industry level, auto, midstream, life insurance, and independent energy all posted the best returns. The auto industry posted the highest return 2.17%. The lowest performing industries during the quarter were cable, media, wirelines, and retailers. The cable industry posted the lowest return -0.66%.

The energy sector performance has continued to remain strong. Crude oil had a $20 per barrel range in Q4 and averaged $77 per barrel. Meanwhile, the natural gas market moved lower throughout the quarter coming down off highs not seen in three years. OPEC+ recently had a meeting and decided to further raise production levels.i The group has “restarted about two-thirds of the production they halted in 2020, and are seeking to drip-feed the remainder at a pace that will satisfy the recovery in fuel consumption — and stave off any inflationary price spike — without sending the market into a new slump. So far they’ve succeeded, with international crude prices trading near $78 a barrel.” OPEC has also chosen a new Secretary General that will take over in August as the group’s public face. The outgoing Secretary General will step down after completing a full term as permitted by governing rules.

During the fourth quarter, the high yield primary market continued at a strong pace posting $84.3 billion in issuance and making 2021 a record year. After two very active years for issuance, 2022 is likely to take a breather but the expectation is still in the ballpark of $400 billion. The issuance in Consumer Discretionary continued to be very strong with approximately 19% of the total during the quarter. Second place was broad based as Communications, Energy, and Financials each made up 14% of the total new paper placed in the market.

The Federal Reserve maintained the Target Rate to an upper bound of 0.25% at both the meetings in November and December. The chart to the left shows the updated Fed dot plot post the December meeting. Of note, the Fed median Target Rate for 2022 increased from 0.25 to 0.875, and the median increased for 2023 from 1.00 to 1.625. Additionally, at the December meeting the Fed agreed to accelerate the taper pace of their asset purchases. The change in the taper pace sets in place a plan for the program to end in March of 2022. The Fed has previously spoken of the desire to end the taper before starting Target Rate hikes. These moves are being driven by a tight employment market and inflation that is running higher than any point in the last 30 years. “There’s a real risk now, I believe, that inflation may be more persistent and…the risk of higher inflation becoming entrenched has increased,” said Mr. Powell at a news conference after the December meeting.

“That’s part of the reason behind our move today, is to put ourselves in a position to be able to deal with that risk.”ii

Intermediate Treasuries increased 2 basis points over the quarter, as the 10-year Treasury yield was at 1.49% on September 30th, and 1.51% at the end of the fourth quarter. The 5-year Treasury increased 29 basis points over the quarter, moving from 0.97% on September 30th, to 1.26% at the end of the fourth quarter. Intermediate term yields more often reflect GDP and expectations for future economic growth and inflation rather than actions taken by the FOMC to adjust the Target Rate. The revised third quarter GDP print was 2.3% (quarter over quarter annualized rate). Looking forward, the current consensus view of economists suggests a GDP for 2022 around 3.9% with inflation expectations around 3.5%.iii

Being a more conservative asset manager, Cincinnati Asset Management Inc. does not buy CCC and lower rated securities. This policy generally served our clients well in 2020. However, the lowest rated segment of the market outperformed during 2021. Thus, our higher quality orientation was not optimal for the year. As a result and noted above, our High Yield Composite net of fees total return did underperform the Index YTD. Our Composite also underperformed over the fourth quarter measurement period. A sizeable contributor was the Index strong performance in the under one year and over ten year duration buckets. These are both areas that our strategy tends not to participate in any meaningful way. Further, with the market staying strong during the fourth quarter, our cash position remained a drag on overall performance. Outside of that, credit selection drove much of the story in Q4. The downside was driven by selections in the energy sector and retailer industry, while the top positive offsets were found within the homebuilders and wireline industries.

The Bloomberg Barclays US Corporate High Yield Index ended the fourth quarter with a yield of 4.21%. The market yield is an average that is barbelled by the CCC rated cohort yielding 6.82% and a BB rated slice yielding 3.30%. Equity volatility, as measured by the Chicago Board Options Exchange Volatility Index (“VIX”), had an average of 19 over the quarter with a spike to a high of 35 as the market was coming to grips with the omicron variant. For context, the average was 15 over the course of 2019 and 29 for 2020. The fourth quarter had one bond issuer default on their debt. The trailing twelve month default rate fell to 0.27%.iv The current default rate is relative to the 6.17%, 4.80%, 1.63%, 0.92% default rates from the previous four quarter end data points listed oldest to most recent. Pre-Covid, fundamentals of high yield companies had been mostly good and in the aggregate fundamentals are back to those pre-covid levels. From a technical view, fund flows were roughly flat in October, negative in November, and positive in December. The 2021 year-end outflow stands at $4.8 billion.v In spite of this outflow, a strong bid remains in the market for high yield paper, and the declining default rate is keeping a risk on attitude in place for market participants. We are of the belief that for clients that have an investment horizon over a complete market cycle, high yield deserves to be considered as part of the portfolio allocation.

Covid, then delta, now omicron….the hits just keep on coming. All things considered, the market did very well this year. This is no doubt in part due to Congress and the Fed supplying trillions of dollars of support in response to the pandemic. November was indeed a tough month as market participants dealt with news of an emerging new variant. Many naturally sensed a buying opportunity as December was quite strong posting the best monthly return for the year. Participants surely understood that we are no longer in March 2020 operating largely in the dark and full of uncertainty. Uncertainty will always be a factor in the equation, but today we are much better prepared to deal with the ongoing pandemic. The vaccine has been rolled out and according to the CDC, 86% of the US population ages 18+ has received at least one shot. We now have boosters and emergency use pills approved. As cases continue to climb, signs point to much less severe outcomes.vi Additionally, companies are generally in good financial shape. As a country, we are currently in a place where the economy is booming and inflation is escalated. That is the backdrop as we move into 2022. Clearly, it is important that we exercise discipline and selectivity in our credit choices moving forward. We are very much on the lookout for any pitfalls as well as opportunities for our clients. We will continue to carefully monitor the market to evaluate that the given compensation for the perceived level of risk remains appropriate on a security by security basis. As always, we will continue our search for value and adjust positions as we uncover compelling situations. Finally, we are very grateful for the trust placed in our team to manage your capital.

This information is intended solely to report on investment strategies identified by Cincinnati Asset Management. Opinions and estimates offered constitute our judgment and are subject to change without notice, as are statements of financial market trends, which are based on current market conditions. This material is not intended as an offer or solicitation to buy, hold or sell any financial instrument. Fixed income securities may be sensitive to prevailing interest rates. When rates rise the value generally declines. Past performance is not a guarantee of future results. Gross of advisory fee performance does not reflect the deduction of investment advisory fees. Our advisory fees are disclosed in Form ADV Part 2A. Accounts managed through brokerage firm programs usually will include additional fees. Returns are calculated monthly in U.S. dollars and include reinvestment of dividends and interest. The index is unmanaged and does not take into account fees, expenses, and transaction costs. It is shown for comparative purposes and is based on information generally available to the public from sources believed to be reliable. No representation is made to its accuracy or completeness.

i Bloomberg January 4, 2022: OPEC+ Agrees to Revive More Output
ii The Wall Street Journal December 15, 2021: Fed Officials Project Three Interest Rate Rises in 2022
iii Bloomberg January 4, 2022: Economic Forecasts (ECFC)
iv JP Morgan January 3,, 2022: “Default Monitor”
v Wells Fargo January 3, 2022: “Credit Flows”
vi Bloomberg January 4, 2022: Omicron Spares US ICUs So Far, Mirroring S. Africa Trajectory

10 Dec 2021

CAM Investment Grade Weekly Insights

Spreads will finish the week tighter, reclaiming some ground after having experienced headwinds in the week prior which saw the index close two days at 101 –its widest level of 2021.  The OAS on the Bloomberg US Corporate Bond Index closed at 96 on Thursday, December 9, after having closed the week prior at 100.  Treasury volatility has been a common theme in recent weeks and this week was no exception.  The 10yr Treasury is 1.47% on Friday morning after having closed last week at 1.34%.  Through Thursday, the Corporate Index had posted a year-to-date total return of -1.26% and an excess return over the same time period of +1.25%.  The Federal Reserve is currently within its blackout period as the market patiently awaits the next FOMC decision on Wednesday of next week.


The primary market was active this week with Merck leading all issuers with an outsize $8bln print.  In all, over $38bln in new debt was brought to market during the week.  This month can be seasonally slow but that has not been the case this year with a record breaking amount of new issuance during the month of December ($61.7bln) which is impressive to be sure given we are not yet half  way through the month. According to data compiled by Bloomberg, $1,411bln of new debt has been issued year-to-date.  2021 has firmly secured its place in history as the 2nd busiest year for issuance on record but it still trails 2020’s record breaking volume by almost 20%.  Issuance consensus estimates for next week are calling for only $5bln but we are skeptical and would not be surprised if Monday and Tuesday bring some activity.  Wednesday is likely to be very quiet with the FOMC on the tape.

Per data compiled by Wells Fargo, flows into investment grade credit for the week of December 2–8 were +$0.885bln which brings the year-to-date total to +$321bln.

10 Dec 2021

CAM High Yield Weekly Insights

Fund Flows & Issuance:  According to a Wells Fargo report, flows week to date were $0.2 billion and year to date flows stand at -$6.2 billion.  New issuance for the week was $5.2 billion and year to date issuance is at $459.9 billion.

 (Bloomberg)  High Yield Market Highlights

  •  The recent selloff in the U.S. junk-bond market looks like the distant past as the index is now poised to post gains for the second consecutive week, and potentially the biggest gains in more than three months.
  • The riskiest segment of the junk bond market, CCCs, are also on track to close the week with the highest returns since the end of August and are likely to be the best-performing asset class in the U.S. fixed-income market.
  • Returns on the broader junk-bond index week-to-date stood at 0.67% and CCC gains at 0.8%.
  • As investors rush back to the asset, U.S. high-yield funds saw an inflow for the week after outflows the two previous weeks.
  • “The late November weakness in risk assets has come and gone, with sentiment reversing completely in December,” Barclays strategist Brad Rogoff wrote on Friday.
  • In corporate cash markets, the high-yield to investment-grade spread has shrunk after the recent decompression, Barclays wrote in the note.
  • The primary market was steady pricing deals to take the week’s tally to more than $5b.
  • The broader junk bond yields rose 6bps to close at 4.46% but will end the week lower for the second time this month.
  • The Single B index may see the biggest weekly gains in 12 months, with week-to-date returns of 0.72%.
  • CCC yields closed at 7.06% and may end the week lower to see the biggest weekly drop in more than three months.


  (Wall Street Journal)  U.S. Jobless Claims Fall to Lowest Level in 52 Years

  • Worker filings for unemployment benefits hit the lowest level in more than half a century last week as a tight labor market keeps layoffs low.
  • Initial jobless claims, a proxy for layoffs, fell to 184,000 in the week ended Dec. 4, the lowest level since September 1969, the Labor Department said Thursday. That was close to a recent record total of 194,000 recorded in late November.
  • The prior week’s level was revised up to 227,000. The four-week moving average, which smooths out weekly volatility, fell to 218,750.
  • Unemployment claims have been steadily falling all year as the labor market has tightened. They have now fallen below where they were before the pandemic caused layoffs to surge in March 2020. Claims averaged 218,000 in 2019, the year before the pandemic hit the U.S.
  • Economists say seasonal volatility around the holiday season may have contributed to last week’s low number.
  • The decline in new claims is an indication that employers are reluctant to lay off workers as jobs are plentiful, consumer demand is high and the pool of prospective workers remains lower than before the pandemic.
  • “We expect claims will start to more consistently hover around pre-Covid averages of 220,000 or perhaps slightly lower given current tight labor market conditions,” said Nancy Vanden Houten, lead economist at Oxford Economics.
  • More unemployed workers should eventually get new jobs as they exhaust their benefits, she added.
  • The unemployment rate fell to 4.2% in November from 4.6% in October, the Labor Department reported Friday. The share of people ages 25 to 54 who are either working or looking for work rose to 82.1% from 81.9%, a sign that prime-age Americans are starting to get back into the labor force. But the labor-force participation rate for that age group remains below where it was in February 2020, when it stood at 83.1%.
  • “The overriding dynamic in the job market of late has been this shortage of workers,” said Mark Hamrick, senior economic analyst at Bankrate. “The issue of fresh job loss has not been key for many months now.”


05 Nov 2021

CAM Investment Grade Weekly Insights

Spreads inched tighter throughout the week.  The OAS on the Blomberg Barclays Corporate Index closed at 86 on Friday, November 5, after having closed the week prior at 88.  On Wednesday, in a move that was widely anticipated, the Federal Reserve proceeded with the implementation of its plan to gradually taper the pace of asset purchases. Treasury yields moved lower after the FOMC meeting with the yield on the 10yr Treasury finishing the week at 1.45%, 10 basis points lower from its close the week prior.  Even a solid payrolls report with an upward revision to prior data was not enough to stem the rally in rates.  Through Friday, the Corporate Index had posted a year-to-date total return of -0.14% and an excess return over the same time period of +2.06%.

The primary market saw another somewhat active week with $20bln in new debt having been brought to market.   According to data compiled by Bloomberg, $1,258bln of new debt has been issued year-to-date.

Per data compiled by Wells Fargo, outflows from investment grade credit for the week of October 28–November 3 were -$0.280bln which brings the year-to-date total to +$313bln.  This marked the first outflow since March and only the second recorded outflow in the past calendar year.

22 Oct 2021

CAM High Yield Weekly Insights

Fund Flows & Issuance:  According to a Wells Fargo report, flows week to date were $2.1 billion and year to date flows stand at -$2.2 billion.  New issuance for the week was $12.7 billion and year to date issuance is at $417.2 billion.

 (Bloomberg)  High Yield Market Highlights

  • The riskiest part of the junk bond market is poised to post gains for the second consecutive week.  Should the current trend hold, CCCs will close the week as the best performing asset in high yield amid rate volatility and inflation anxiety.
  • The broader junk bond index may also end the week with modest gains for the second straight week, with 0.04% largely propelled by CCCs.
  • While risk assets managed to tune out macro concerns, “continued rate volatility could be a potential source of risk for valuations and at least create opportunities within credit”, Barclays strategist Brad Rogoff wrote on Friday.
  • U.S. junk bond yields have come under pressure and have jumped 34bps since August to close at 4.18%; CCC yields rose 38bps to close at 6.53% as inflation fears took on momentum with the 5-year U.S. Treasury yields rising about 46bps in that period to close at a 20-month high of 1.243%.
  • Investors assessed rising yields and falling prices, re-entering the market to pour cash into retail funds.
  • U.S. high yield funds report an inflow of $2.1b this week, the biggest since April.
  • The primary market remained healthy with $12.7b of issuance.


(Bloomberg)  Fed’s Quarles Urges November Taper and Warns of Inflation Risks

  •  Federal Reserve Governor Randal Quarles said he favors an initial move to slow monetary stimulus next month and is concerned by a broadening of inflationary pressures that could require a policy response.
  • “I would support a decision at our November meeting to start reducing these purchases,” he said in remarks prepared for a speech Wednesday to a Milken Institute conference in Los Angeles, referring to the central bank’s bond-buying program, which is currently running at $120 billion a month.
  • Fed officials are getting ready to begin winding down the bond-buying program they put in place last year in the early days of the pandemic. They broadly agreed to start the process in either mid-November or mid-December, according to minutes of their last meeting on Sept. 21-22.
  • Quarles said he agreed that current high inflation is “transitory,” and that the central bank is not “behind the curve” with its monetary policy. While price moves have been prompted by supply disruptions during the Covid-19 pandemic, the surges have lasted longer than expected and there has been a broadening of the number of items that have seen price surges, he said.
  • “There is evidence in the past couple of months that a broader range of prices are beginning to increase at moderate rates, and I am closely watching those developments,” he said.
  • Quarles’ prepared remarks didn’t give an explicit forecast for the timing of interest-rate liftoff. Projections published at the conclusion of the Fed’s September meeting showed officials were evenly split on whether increases in its benchmark interest rate, which is currently near zero, would be necessary next year.
  • During a question and answer session, he said that “if we are still seeing 4% inflation or in that area next spring, then I think we might have to reassess the speed with which we would be thinking about raising interest rates.”
  • Quarles’ position as Fed vice chairman of supervision expired earlier this month and the Fed Board in Washington decided not to have any single governor take that position while awaiting a fresh nomination by President Joe Biden.
15 Oct 2021

CAM High Yield Weekly Insights

Fund Flows & Issuance:  According to a Wells Fargo report, flows week to date were -$1.2 billion and year to date flows stand at -$3.0 billion.  New issuance for the week was $5.2 billion and year to date issuance is at $404.4 billion.

(Bloomberg)  High Yield Market Highlights

  • Junk bonds bounced back from a recent dip, taking a cue from equities, to post the biggest one-day gains in seven and yields saw the biggest decline in almost five weeks, ending the day at 4.19%.
  • The junk bond index is poised to snap its three-week losing streak and post the biggest gains since mid-September, with week-to-date returns of 0.11%
  • Gains were across the board as oil prices closed at a seven-year high of $81.31 on Thursday.
  • Primary market resilience was evident as issuance continued at a steady pace.
  • US. junk-bond investors, while continuing their search for yield, were demanding appropriate risk premium.
  • Amid broader resilience, investors are growing cautious amid concerns about increasing volatility. That was evident in the lack of interest as debt-laden alarm company Monitronics International struggles to find enough buyers for its $1.1b 7-year notes, the inaugural bond offering since emerging from bankruptcy two years ago.
  • These were slated to price earlier in the week.
  • Investors also pulled cash from retail funds, with an outflow of $1.2b from U.S. high yield funds, the biggest since mid-June.
  • The broader junk bond index spreads dropped 6bps to +295bps and posted gains of 0.29% on Thursday, the biggest one-day returns since March.
  • Single B yields also dropped 12bps to close at 4.60%, the biggest decline in six weeks, and the index posted gains of 0.29%, also the biggest since March.


(CNBC)  Fed says it could begin ‘gradual tapering process’ by mid-November

  • Federal Reserve officials could begin reducing the extraordinary help they’ve been providing to the economy by as soon as mid-November, according to minutes from the central bank’s September meeting released Wednesday.
  • The meeting summary indicated members feel the Fed has come close to reaching its economic goals and soon could begin normalizing policy by reducing the pace of its monthly asset purchases.
  • In a process known as tapering, the Fed would reduce the $120 billion a month in bond buys slowly. The minutes indicated the central bank probably would start by cutting $10 billion a month in Treasurys and $5 billion a month in mortgage-backed securities. The Fed is currently buying at least $80 billion in Treasurys and $40 billion in MBS.
  • The target date to end the purchases should there be no disruptions would be mid-2022.
  • The minutes noted “participants generally assessed that, provided that the economic recovery remained broadly on track, a gradual tapering process that concluded around the middle of next year would likely be appropriate.”
  • “Participants noted that if a decision to begin tapering purchases occurred at the next meeting, the process of tapering could commence with the monthly purchase calendars beginning in either mid-November or mid-December,” the summary said.
  • St. Louis Fed President James Bullard told CNBC on Tuesdaythat he thinks tapering should be more aggressive in case the Fed needs to rate interest rates next year to combat persistent inflation.
  • At the September policymaking session, the committee voted unanimously to hold the central bank’s benchmark short-term borrowing rate at zero to 0.25%.
  • The committee also released the summary of its economic expectations, including projections for GDP growth, inflation and unemployment. Members scaled back their GDP estimates for this year but upped their outlook for inflation, and indicated they expect unemployment to be lower than earlier estimates.
  • In the “dot plot” of individual members’ expectations for interest rates, the committee indicated it could begin raising interest rates as soon as 2022. Markets currently are pricing in the first rate hike for next September, according to the CME FedWatch tool. Following the release of the minutes, traders increased the likelihood of a September hike to 65% from 62%.
  • Officials, though, stressed that a tapering decision should not be seen as implying pending interest rate hikes.
  • However, some members at the meeting showed concern that current inflation pressures might last longer than they had anticipated. Traders are pricing in a 46% chance of two rate hikes in 2022.
  • “Most participants saw inflation risks as weighted to the upside because of concerns that supply disruptions and labor shortages might last longer and might have larger or more persistent effects on prices and wages than they currently assumed,” the minutes stated.
  • The document noted that “a few participants” said there could be some “downside risks” for inflation as long-standing factors that have kept prices in check come back into play. The majority of Fed officials have been holding to theme that the current price increases are transitory and due to supply chain bottlenecks, and other factors likely to subside.
  • Inflation pressures have continued, though, with a reading Wednesday showing that consumer prices are up 5.4% over the past year, the fastest pace in decades.
15 Oct 2021

2021 Q3 Investment Grade Quarterly

Investment grade corporate credit finished the third quarter little changed from where it began the period. The option adjusted spread (OAS) on the Bloomberg Barclays US Corporate Bond Index ended the third quarter at 84 just modestly wider from where it started at a spread of 80.

Treasuries finished the quarter nearly unchanged as well. The 10yr Treasury opened the 3rd quarter at 1.47% and closed at 1.49%. There was some volatility along the way, as the benchmark rate closed as low as 1.17% near the beginning of August with much of its move higher coming in the last week of September.

It has been a relatively low volatility year for investment grade credit spreads with the Corporate Index having traded so far this year within its narrowest band since 2006, with a spread range of just 20 basis points. The index saw its tightest level when it closed at 80 the last day of June and its widest level of 100 in early March. For context, during the volatile year of 2020, the index saw a range of 280 basis points. The index traded in a range of 64 and 68 basis points in 2019 and 2020, respectively.

There are several reasons why we believe volatility has been subdued thus far in 2021. First, demand for investment grade credit as an asset class has been very strong which can be supportive of lower volatility and tighter credit spreads. According to data compiled by Wells Fargo Securities, there has been over $300bln in fund flows into investment grade credit through September 29.i A second reason we believe there has been less volatility is due to low net new issue supply. Gross supply has exceeded $1.1 trillion in 2021, the second busiest year on record.ii However, a closer examination of the numbers reveals that much of 2021’s supply has been for the replacement of existing higher cost debt. After subtracting tenders, refinancing and maturities, that $1.1 trillion gross supply figure gets whittled down to less than $300bln in net new issue supply through the end of the third quarter.iii Simply put, demand for credit has overwhelmed available supply. Finally, investment grade companies have strong balance sheets and high cash balances. Combining this strength with a yield starved environment and a “risk-on” sentiment has created a feeling among some investors that there is very little risk at the moment in IG credit and we believe this is the largest factor that has contributed to low volatility

Although most companies in IG credit are well positioned, this is an environment where investors need to tread especially lightly and do their homework on each individual company. Yes IG credit is generally in good or even great condition. Many companies issued debt during the worst of the pandemic because they wanted to shore up liquidity in the face of uncertainty. As a result, gross leverage is still elevated from pre-pandemic levels. Much of the cash that was borrowed is sitting idle on company balance sheets. As an additional consequence of the pandemic, there are scores of companies that paused share buybacks in 2020 or even dividends and have yet to resume them. There will be pressure from shareholders to resume these activities as well as additional shareholder remuneration. Management teams and boards have stockpiles of cash and may be tempted by ample M&A opportunities at some of the richest valuations the market has ever seen. It is important for a bond manager to identify those companies that are committed to maintaining or repairing the health of their balance sheets and to avoid those that will use excess liquidity for pursuits that are negative for bondholders. Shareholder rewards and M&A are fine as long as they are done within the confines of the balance sheet. It is when these activities rise to excess levels resulting in downgrades from A to BAA or from BAA to junk that it starts to impair total return potential for bondholders.

In a move that was largely expected at its September meeting the Federal Reserve said that it could start to reduce its $120 billion in monthly asset purchases as soon as its next scheduled meeting in early November. The tapering messaging has been deliberate and carefully crafted, and although there has not yet been a formal decision, Chairman Powell said that it would be a gradual process “that concludes around the middle of next year is likely to be appropriate.”iv
It has received much less press coverage but we would argue that the Fed began the tapering process back in July when it started selling down its corporate credit facilities. Recall that during the height of the crisis in March of 2020, the Fed went to extraordinary measures and began to purchase corporate bond ETFs as well as individual corporate bonds. The maximum size of the facility was $750bln, but at its peak the facility only grew to $14bln. The Fed quietly exited all of these positions by September 1 with no discernible market impact.v Clearly, the program was a success and it did much to reinstall confidence in the credit markets at a time when it was desperately needed.
As far as the federal funds rate is concerned, the September meeting was slightly more hawkish than expectations but again the message was clear that tapering will come first and any rate hikes will come thereafter. The committee was split on the timing of the first rate hike, with half of 18 Fed officials expecting at least one increase by the end of 2022 with additional increases forthcoming during 2023. We also expect that this will be a slow and steady process. The Fed Funds rate is a very short term interest rate and its impact is limited to the front end of the yield curve, while maturities further out the curve, like the 10yr and 30yr Treasury are much more impacted by the overall direction of the economy and inflation expectations. We think incremental increases in the Fed Funds rate are entirely manageable for corporate credit so long as the Fed keeps a watchful eye on the economy to prevent it from overheating.

We often receive questions from clients about our intermediate positioning, as our portfolios are typically invested in bonds that range from 5-10 years until maturity. A bond portfolio is generally seeking to accomplish four goals: income generation, preservation of capital, inflation protection and diversification. We believe positioning the portfolio within an intermediate maturity range helps to accomplish all of these goals but it is especially useful in limiting downside and preserving purchasing power. Intermediate maturities give the portfolio a chance to benefit if Treasury rates go lower but it also provides much more protection from rising interest rates than if the portfolio were invested in longer maturities 20 to 30 years out the curve. More importantly, it gives the portfolio a chance to generate a positive total return in environments where rates exhibit little movement, even if absolute yields are low like they are currently. The 5/10 curve is one of the most reliably steep portions of both the Treasury curve and the corporate credit curve, which is the spread that one is afforded for owning a corporate bond on top of a Treasury.

As you can see from the chart, the steepness afforded from the 5/10 portion of these curves is attractive relative to the longer portions. Take the corporate yield curve as an example (green). We get 91 basis points of additional yield by selling a bond at 5yrs and using the proceeds to buy a bond that matures in 10yrs. The way that bond math works, all else being equal, in a static rate and spread environment, we would collect 91 basis points of roll down from holding a generic investment grade corporate bond from 10yrs selling it at 5yrs. The mere 68 basis points of compensation afforded from extending from 10yrs to 30yrs pales in comparison to the intermediate positioning. The extension from 10/30 is also accompanied by substantially more interest rate risk.

Now let’s take a look at duration to provide some more context to this discussion. At September 30 2021, the modified duration of the Bloomberg Barclays US Corporate 5-10yr index was 6.47 and the OAS was 80. The modified duration of the US Corporate 10+yr index was 15.19 and the OAS was 122. One very basic measure of risk/reward we like to use is yield per unit of duration. In this instance we are receiving 12.4 basis points per year of duration if we invest in the 5-10yr index but only 8 basis points per year of duration if we invest in the 10+ portion of the index. Given the way that we at CAM view the world, by investing in the 10+ year portion of the index, we would be receiving significantly less compensation in exchange for more interest rate risk.

The big themes that will carry us into year-end are the ongoing pandemic, the domestic economy, China and the FOMC; on these topics there are more questions than answers at this point. Will the economy continue to recover or will new variants take the wind out of its sails? Will policy makers be able to offer targeted relief to those sectors of the economy that have not come close to recovering lost earnings without offering relief that is so broad that it leads to overheating? Will problems with China’s domestic economy lead to systemic issues for the global economy – for the record we think not –but could there be ramifications for certain industries? And finally, the FOMC’s November meeting looms large with the potential for an announcement on tapering asset purchases.
As we stated earlier in this missive, corporate credit is generally in solid shape but this is not a risk free asset class. Mistakes will be made by some management teams that become too aggressive amid an environment that is still rife with uncertainty and it is our job to do our best to avoid those issues for our client portfolios. We are still positioning our portfolio in a more defensive manner than the market as a whole and we do not see that changing in the near term. Please feel free to contact us with any comments, questions or concerns. Thank you for your business and continued interest.

This information is intended solely to report on investment strategies identified by Cincinnati Asset Management. Opinions and estimates offered constitute our judgment and are subject to change without notice, as are statements of financial market trends, which are based on current market conditions. This material is not intended as an offer or solicitation to buy, hold or sell any financial instrument. Fixed income securities may be sensitive to prevailing interest rates. When rates rise the value generally declines. Past performance is not a guarantee of future results. Gross of advisory fee performance does not reflect the deduction of investment advisory fees. Our advisory fees are disclosed in Form ADV Part 2A. Accounts managed through brokerage firm programs usually will include additional fees. Returns are calculated monthly in U.S. dollars and include reinvestment of dividends and interest. The index is unmanaged and does not take into account fees, expenses, and transaction costs. It is shown for comparative purposes and is based on information generally available to the public from sources believed to be reliable. No representation is made to its accuracy or completeness.

i Wells Fargo Securities, September 30 2021 “Credit Flows | Supply & Demand: 9/23-9/29”
ii Bloomberg, September 30 2021 “IG ANALYSIS: CNO FABN Debut Leads Docket; $90-$100bn October”
iii Credit Suisse, September 13 2021 “CS Credit Strategy Daily Comment”
iv The Wall Street Journal, September 22 2021 “Fed Tees Up taper and Signals Rate Rises Possible Next Year”
v Federal Reserve Statistical Release, September 2 2021 “H. 4. 1 statistical release”

15 Oct 2021

2021 Q3 High Yield Quarterly

In the third quarter of 2021, the Bloomberg Barclays US Corporate High Yield Index (“Index”) return was 0.89% bringing the year to date (“YTD”) return to 4.53%. The CAM High Yield Composite net of fees total return was 1.10% bringing the YTD net of fees return to 3.56%. The S&P 500 stock index return was 0.58% (including dividends reinvested) for Q3, and the YTD return stands at 15.91%.

The 10 year US Treasury rate (“10 year”) had a move down to a 1.17% low in early August and then moved back up to finish at 1.49%, up 0.02% from the beginning of the quarter. Over the period, the Index option adjusted spread (“OAS”) widened 21 basis points moving from 268 basis points to 289 basis points. Each quality segment of the High Yield Market participated in the spread widening as BB rated securities widened 3 basis points, B rated securities widened 33 basis points, and CCC rated securities widened 62 basis points. Take a look at the chart below from Bloomberg to see a visual of the spread moves in the Index over the past five years. The graph illustrates the speed of the spread move in both directions during 2020 and the continuation of lower spreads in 2021. The OAS record low (not shown) is 233 basis points set back in 2007.

The Energy, REITs, and Other Financial sectors were the best performers during the quarter, posting returns of 1.70%, 1.22%, and 1.17%, respectively. On the other hand, Finance Companies, Consumer Cyclicals, and Communications were the worst performing sectors, posting returns of 0.44%, 0.56%, and 0.56%, respectively. Clearly the market was strong as no sector posted a negative return in the period. At the industry level, life insurance, independent energy, restaurants, and paper all posted the best returns. The life insurance industry posted the highest return 3.43%. The lowest performing industries during the quarter were refining, gaming, cable, and health insurance. The refining industry posted the lowest return -0.63%.

The energy sector performance has continued to remain strong. While crude oil held its own averaging $70 per barrel in Q3, the natural gas market has moved steadily higher. The acceleration to the upside is a function of both supply and demand being impacted. Excessive summer heat particularly in the northwest called for higher than normal power demand. This left a situation of below average gas storage. Then hurricane Ida resulted in knocking much of the Gulf of Mexico production offline. In fact, over 75% of the production is still shut-in. The icing on this story is that traders are beginning to look towards the possibility of a colder than normal winter. If that situation comes to be more priced in as consensus, this price train will just keep chugging higher.

During the third quarter, the high yield primary market continued its record pace and posted $115.9 billion in issuance. Many companies continued to take advantage of the open new issue market that is offering very attractive financing. Year to date there has been $433 billion in issuance and will no doubt set a new record by topping last year’s $442 billion. The issuance in Consumer Discretionary continued to be very strong with approximately 22% of the total during the quarter. Financials issuance was best for second place by making up 17% of the total new paper placed in the market.

The Federal Reserve maintained the Target Rate to an upper bound of 0.25% at both the July and September meetings. The chart to the left shows the updated Fed dot plot post the September meeting. Also, the market is currently pricing in one rate hike by year end 2022.i As expected, the Fed signaled that the time to taper is at hand with Chair Powell commenting that tapering “could come as soon as the next meeting.” He further noted that the taper is separate and distinct from rate hikes by saying “the timing and pace of the coming reduction in asset purchases will not be intended to carry a direct signal regarding the timing of interest-rate liftoff.”ii The transitory nature of red hot inflation is very much a front and center concern with supply chain issues being particularly troubling. Recently, on a panel including several central bankers from across the globe, Powell said “it is also frustrating to see the bottlenecks and supply chain problems not getting better — in fact, at the margin, apparently getting a little bit worse. We see that continuing into next year, probably, and holding inflation up longer than we had thought.”iii On October 1st, the personal consumption expenditures report was released. This is a price gauge that the Fed uses for its inflation target. The report showed the largest increase in 30 years.

Intermediate Treasuries increased 2 basis points over the quarter, as the 10-year Treasury yield was at 1.47% on June 30th, and 1.49% at the end of the third quarter. The 5-year Treasury increased 8 basis points over the quarter, moving from 0.89% on June 30th, to 0.97% at the end of the third quarter. Intermediate term yields more often reflect GDP and expectations for future economic growth and inflation rather than actions taken by the FOMC to adjust the Target Rate. The revised second quarter GDP print was 6.7% (quarter over quarter annualized rate). Looking forward, the current consensus view of economists suggests a GDP for 2022 around 4.1% with inflation expectations around 2.5%.iv

Being a more conservative asset manager, Cincinnati Asset Management Inc. does not buy CCC and lower rated securities. This policy generally served our clients well in 2020. However, the lowest rated segment of the market has outperformed year to date in 2021. Thus, our higher quality orientation was not optimal during the first half of the year, but it was once again a benefit during Q3. As a result and noted above, our High Yield Composite gross total return has underperformed the Index YTD. However, our Composite did outperform over the third quarter measurement period. With the market staying strong during the third quarter, our cash position remained a drag on overall performance. Outside of that, credit selection drove much of the story in Q3. The downside was driven by selections in the consumer cyclical services and wirelines industries while the top positive offsets were found within aerospace/defense, autos, and transportation

The Bloomberg Barclays US Corporate High Yield Index ended the third quarter with a yield of 4.04%. The market yield is an average that is barbelled by the CCC-rated cohort yielding 6.26% and a BB rated slice yielding 3.18%. Equity volatility, as measured by the Chicago Board Options Exchange Volatility Index (“VIX”), had an average of 18 over the quarter. For context, the average was 15 over the course of 2019 and 29 for 2020. The third quarter had zero bond issuers default on their debt. The trailing twelve month default rate fell to 0.92% with the energy sector accounting for about a third of that rate.<sup>v</sup> The current 0.92% default rate is relative to the 5.80%, 6.17%, 4.80%, 1.63% default rates for the third and fourth quarters of 2020, and the first and second quarters of 2021 respectively. Pre-Covid, fundamentals of high yield companies had been mostly good and in the aggregate fundamentals are back to those pre-covid levels. From a technical view, fund flows were roughly flat in July, positive in August and September, and the year-to-date outflow stands at $1.3 billion.<sup>vi</sup> In spite of this outflow, a strong bid remains in the market for high yield paper, and the declining default rate is keeping a risk on attitude in place for market participants. We are of the belief that for clients that have an investment horizon over a complete market cycle, high yield deserves to be considered as part of the portfolio allocation.

It is quite interesting to think through just how much has transpired over the last year and a half. The US has spent trillions in response to the covid pandemic providing support to people and companies impacted. The vaccine has been rolled out and according to the CDC, 77% of the US population ages 18+ has received at least one shot. This is up from 55% at the time of our Q2 commentary and 32% as of our Q1 commentary. As a country, we are currently in a place where the economy is booming and inflation is escalated. The Federal Reserve has signaled that they will begin the taper of asset purchases in short order. Moving from Q3 into Q4, Congress is wrangling with funding to avoid a shutdown, raising the debt ceiling, passing an infrastructure bill, and passing a fresh social programs spending bill that will have a price tag in the trillions of dollars. There is certainly no slowdown of information flow as we move into the last quarter of 2021. Clearly, it is important that we exercise discipline and selectivity in our credit choices moving forward. We are very much on the lookout for any pitfalls as well as opportunities for our clients. We will continue to carefully monitor the market to evaluate that the given compensation for the perceived level of risk remains appropriate on a security by security basis. As always, we will continue our search for value and adjust positions as we uncover compelling situations. Finally, we are very grateful for the trust placed in our team to manage your capital through such a historic time.

This information is intended solely to report on investment strategies identified by Cincinnati Asset Management. Opinions and estimates offered constitute our judgment and are subject to change without notice, as are statements of financial market trends, which are based on current market conditions. This material is not intended as an offer or solicitation to buy, hold or sell any financial instrument. Fixed income securities may be sensitive to prevailing interest rates. When rates rise the value generally declines. Past performance is not a guarantee of future results. Gross of advisory fee performance does not reflect the deduction of investment advisory fees. Our advisory fees are disclosed in Form ADV Part 2A. Accounts managed through brokerage firm programs usually will include additional fees. Returns are calculated monthly in U.S. dollars and include reinvestment of dividends and interest. The index is unmanaged and does not take into account fees, expenses, and transaction costs. It is shown for comparative purposes and is based on information generally available to the public from sources believed to be reliable. No representation is made to its accuracy or completeness.

i Bloomberg September 30, 2021: WIRP – World Interest Rate Probability
ii Bloomberg September 22, 2021: Powell Says Fed Taper Could Start ‘Soon’
iii The New York Times September 29, 2021: The World’s Top Central Bankers See Supply Chain Problems Prolonging Inflation
iv Bloomberg October 1, 2021: Economic Forecasts (ECFC)
v JP Morgan October 1,, 2021: “Default Monitor”
vi Wells Fargo October 1, 2021: “Credit Flows”