(Bloomberg) High Yield Market Highlights
- US junk bond yields rose for the third day in a row to an almost 12-month high of 42%, driving losses for the fourth straight session on concerns over the Middle East conflict and the potential impact of “restrictive rates” on corporate balance sheets.
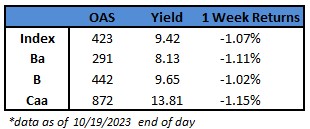
- Yields rose and losses extended across the US high yield market. Junk bonds are headed toward ending the week with a loss of more than 1%. The week-to-date loss stands at 1.07%. Losses were reinforced after Federal Reserve Bank of New York President John Williams said on Wednesday that interest rates will have to stay at restrictive levels “for some time,” a day after stronger-than-expected economic reports.
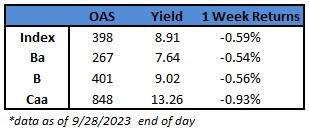
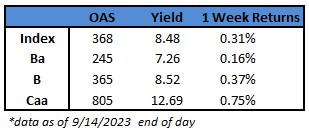
- BB yields soared for the fourth day in a row to a more than three-year high of 8.13%, driving week-to-date losses to 1.11%, the most since the week ended Feb 10, after steadily falling for four sessions this week.
- Single B yields jumped to a new four-month high of 9.65%.
- CCC yields surged to near 14% — closing at 13.81% driving Thursday’s loss to 0.42%, the sixth consecutive session of losses. The week-to-date losses are at 1.15%.
- Fed Chair Powell said while the US central bank was inclined to hold interest rates steady, “decisions about additional policy firming and how long to stay restrictive will be based on totality of incoming data, evolving outlook, and the balance of risks,” signaling that the Fed was open to raising rates at least one more time should the data show strong resilience.
- Economic data this week has been pretty robust. Thursday’s jobless claims data dropped to the lowest since January.
- Economic growth projections have been revised upwards and recession odds reduced materially.
- The economy probably expanded at an annualized 3.5% rate in the third quarter, the fastest in nearly two years as economists in the latest Bloomberg monthly survey marked up their estimates for gross domestic product.
- Besides raising interest rates, the Federal Reserve is also shrinking its balance sheet, sending long term rates to their highest level. This will continue for another a couple of years, pushing rates higher, wrote Bill Dudley earlier this week.
- Rising yields, renewed concerns about “restrictive rates” after robust macro data, and the eruption of tensions in the Middle East kept US borrowers away from the market. The primary market has priced a modest $6.7b month-to-date.
- Central banks have broadly been emphasizing that rates will stay higher for longer, triggering investor worries that “something will eventually break” in credit markets, Goldman Sachs strategists including Lotfi Karoui and Ben Shumway wrote in a note.
- Higher-for-longer rates would translate to a more persistent drag on growth from tighter financial conditions. The ability of corporate borrowers to adjust to this shift without a significant uptick in financial distress remains a key concern, the strategists wrote.
- Goldman analysts revised their recommendation yesterday. They suggest investors should be underweight CCCs and overweight single Bs.
This information is intended solely to report on investment strategies identified by Cincinnati Asset Management. Opinions and estimates offered constitute our judgment and are subject to change without notice, as are statements of financial market trends, which are based on current market conditions. This material is not intended as an offer or solicitation to buy, hold or sell any financial instrument. Fixed income securities may be sensitive to prevailing interest rates. When rates rise the value generally declines. Past performance is not a guarantee of future results.