Category: Insight

08 Mar 2024

CAM High Yield Weekly Insights

(Bloomberg)  High Yield Market Highlights

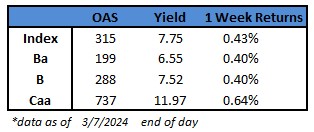
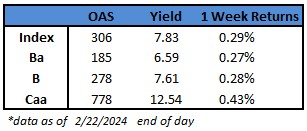
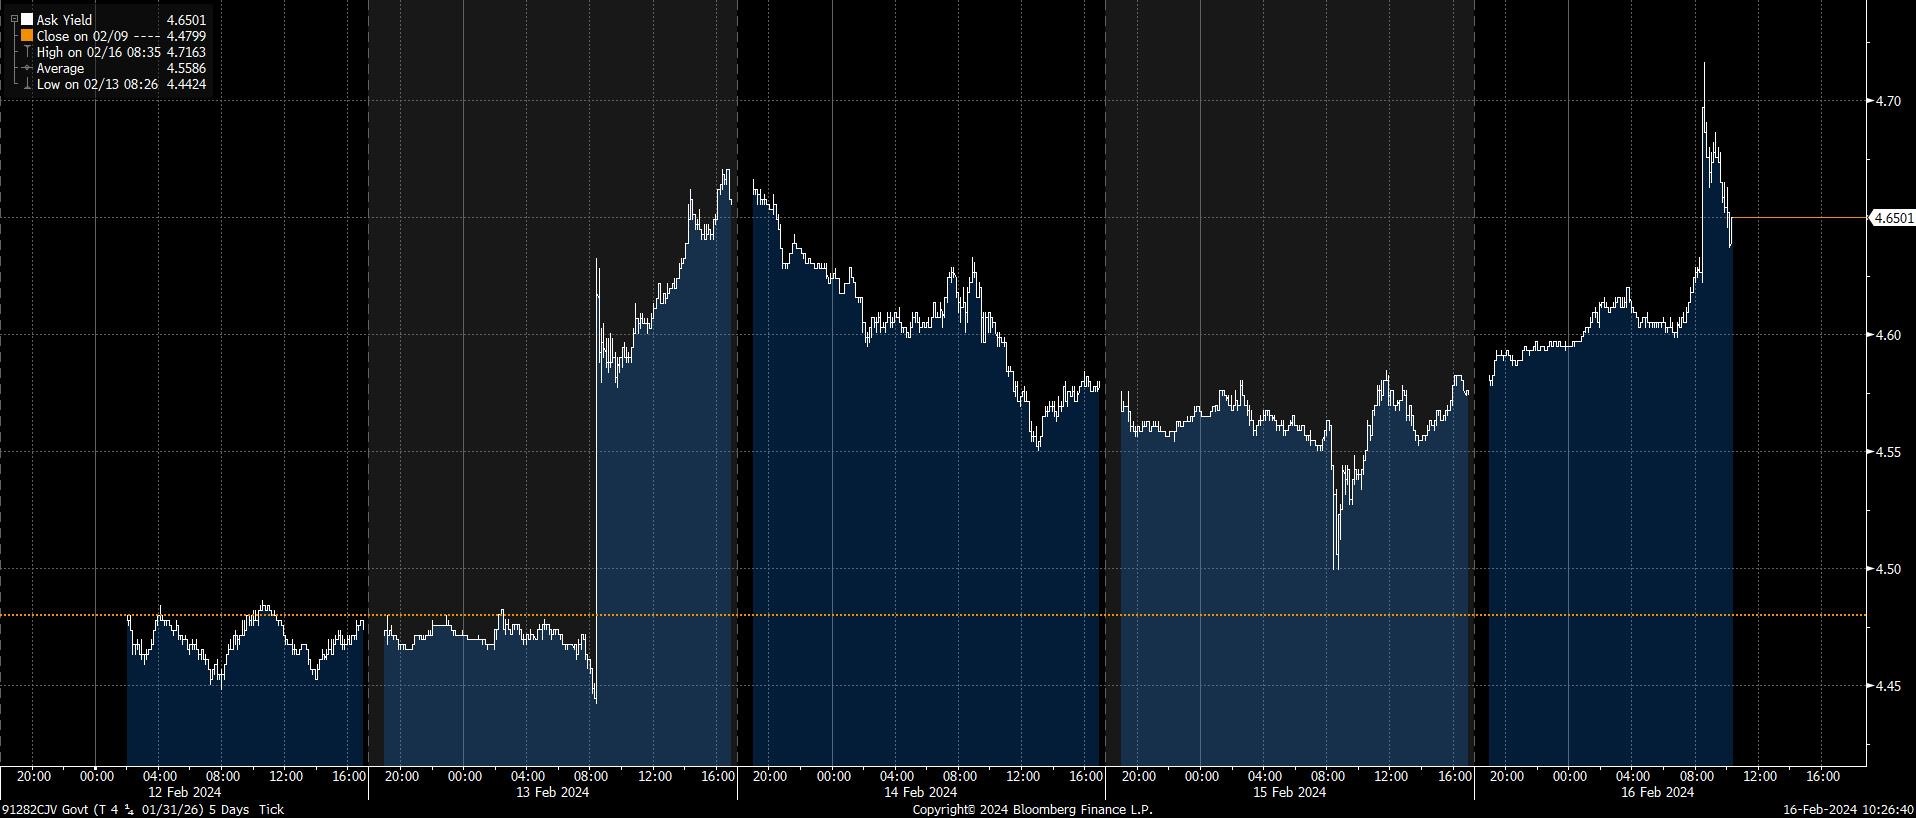
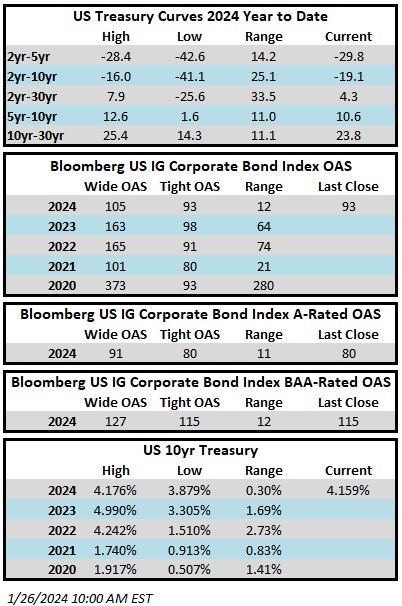
  • The US junk bond market is headed toward a third-straight weekly gain, with its current six-day winning streak the longest this year and yields dropping to 7.75%.
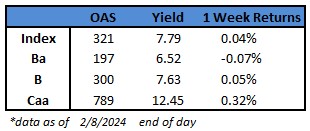
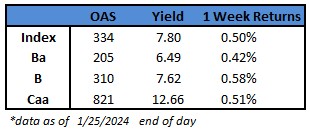
  • It’s allowed yields for the riskiest part of the market, CCCs, to fall below 12% for the first time this year.
  • They’ve fallen 21 basis points so far this week, on top of last week’s 31bp plunge, putting weekly returns at 0.64%.
  • CCC notes have had positive returns for 11 consecutive sessions, the longest since June, as it’s the best-performing asset class in US fixed income.
  • Spreads have dropped 15 basis points this week to 737, the tightest since May 2022.
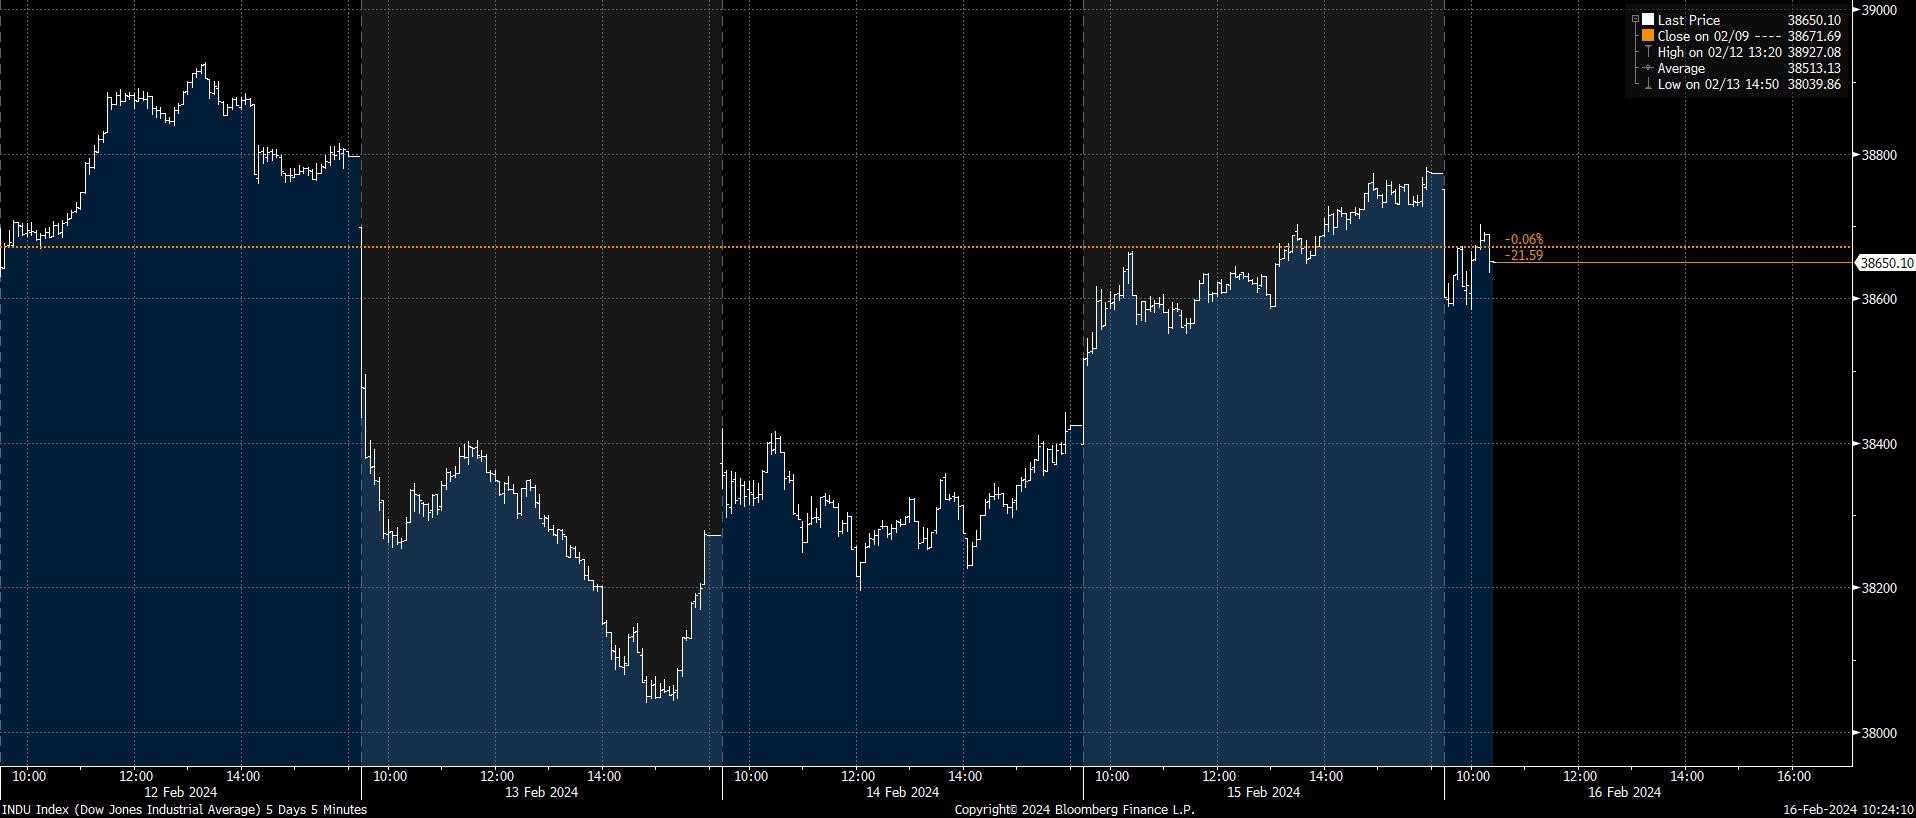
  • The junk market’s rally gained momentum after Fed Chair Powell told Congress that rate cuts are likely this year and recession risks are not elevated in the near term.
  • Jobs data remains robust on the openings and unemployment claims front, ahead of this morning’s employment report for February.
  • Steady yields and historically tight spreads across ratings continue to draw borrowers and investors into the market.
  • Bloomberg Intelligence analysts Noel Hebert and Sam Geier predicted high-yield bond sales this month will range from 25b-$29b.
  • While things may slow some ahead of the next Fed meeting, bankers are prepping to begin a debt sale for the leveraged buyout of Truist Financial’s insurance brokerage business as loans for the deal get done.
  • Conversations with investors continue to indicate that yields of 7.8% in high yield and 5.3% in investment grade are attractive enough even though spreads are tight to support strong demand, Barclays’ Brad Rogoff and Dominique Toublan wrote in note this morning.


This information is intended solely to report on investment strategies identified by Cincinnati Asset Management. Opinions and estimates offered constitute our judgment and are subject to change without notice, as are statements of financial market trends, which are based on current market conditions. This material is not intended as an offer or solicitation to buy, hold or sell any financial instrument. Fixed income securities may be sensitive to prevailing interest rates. When rates rise the value generally declines. Past performance is not a guarantee of future results.

01 Mar 2024

CAM High Yield Weekly Insights

(Bloomberg)  High Yield Market Highlights


  • The broad rally in risk assets has propelled CCCs, the riskiest part of the junk bond market, to the top as the best performing asset class in February. Returns for the month were 1.7% after climbing for six consecutive sessions. The gains came after S&P 500 breached the 5,000 level and steadily climbed to close at an all-time high.
  • CCC returns turned positive year-to-date for the first time in the last week of February, only to accelerate to rise as the best asset class for total returns in the US fixed income market.
  • CCC yields tumbled 43 basis points in February to close at a nine-week low of 12.24% bucking the broader trend as BB yields rose 17 basis points to 6.65%. Single B yields barely moved to close at 7.64%.
  • Broad macro economic data reiterated the narrative about strong and resilient growth amid a slower-than-expected decline in inflation. However, robust economic growth, against the backdrop of relatively stable inflation reading, bolstered risk assets across markets.
  • The recent outperformance of lower-quality assets has coincided with large gains in some of the riskier and more speculative parts of the market, such as cryptocurrencies, Barclays analysts Brad Rogoff and Dominique Toublan wrote in a Friday note.
  • Loose financial conditions continue to support risk-taking in the markets, they wrote.
  • Though spreads are historically tight, yields are supporting strong demand, the analysts reiterated again this morning.
  • Tight spreads, attractive yields and resilient economy have drawn US borrowers into the market powering a supply boom.
  • February supply of almost $27b pushed the year-to-date tally to $58b, a 70% jump year-over year.
  • New bond sales in February were up 86% over last February.


This information is intended solely to report on investment strategies identified by Cincinnati Asset Management. Opinions and estimates offered constitute our judgment and are subject to change without notice, as are statements of financial market trends, which are based on current market conditions. This material is not intended as an offer or solicitation to buy, hold or sell any financial instrument. Fixed income securities may be sensitive to prevailing interest rates. When rates rise the value generally declines. Past performance is not a guarantee of future results.

23 Feb 2024

CAM High Yield Weekly Insights

(Bloomberg)  High Yield Market Highlights

  • US junk bonds notched their biggest one-day gains in more than four weeks and are poised for a rebound off last week’s losses to score the biggest weekly gains in four, as equities hit an all-time high, driving spreads to a more than two-year low of 306 basis points.
  • With the Federal Reserve signaling caution about its next move, credit markets remain quite “upbeat,” with strong “yield-driven” demand, Barclays analysts Brad Rogoff and Dominique Toublan wrote this morning.
  • While inflation risks remain in focus, growth is resilient and corporate earnings are still strong across cyclicals and noncyclicals, they wrote, adding that higher yields continue to compress spreads.
  • Dollar prices in the junk bond market are still low, making yields attractive to investors and supporting strong demand.
  • Spreads were crushed across ratings, with BB spreads tumbling to 185 basis points, the lowest since Jan. 2020.
  • Single B spreads plummeted to 278 basis points, the lowest since July 2007.
  • CCCs spreads dropped to a more than eight week low of 778 basis points, the lowest since December.
  • The gains were across the board as risk assets shrugged off inflation concerns and rallied on a resilient economy and strong labor market.
  • Yields dropped seven basis points to 7.83% and spreads moved closer to 300 basis points.
  • US borrowers are capitalizing on demand supported by low spreads and higher yields.
  • The primary market has priced more than $4b in new bonds this week, putting issuance at $23b for the month.
  • Year-to-date supply is at $54b, up 59% year-over-year.
  • Robust corporate earnings, combined with strong macro data, have pushed back recession concerns and bolstered risk assets.


This information is intended solely to report on investment strategies identified by Cincinnati Asset Management. Opinions and estimates offered constitute our judgment and are subject to change without notice, as are statements of financial market trends, which are based on current market conditions. This material is not intended as an offer or solicitation to buy, hold or sell any financial instrument. Fixed income securities may be sensitive to prevailing interest rates. When rates rise the value generally declines. Past performance is not a guarantee of future results.

23 Feb 2024

CAM Investment Grade Weekly Insights

Another week is in the books and once again it is a year-to-date tight for credit spreads.  The Bloomberg US Corporate Bond Index closed at 89 on Thursday February 22 after having closed the week prior at 92.  The 10yr is trading at 4.26% this Friday morning after closing last week at 4.28%. Through Thursday, the Investment Grade Corporate Index YTD total return was -1.76%.

Economics

It was an extremely light week for economic data.  Perhaps the highlight of the week was the release of the Fed minutes from the most recent meeting that highlighted consensus among policymakers about the risks of cutting rates too quickly.  Next week brings some more action with many data releases including GDP, Core PCE and Personal Spending.

Issuance

It was a huge week for issuance even despite the fact that the market was closed on Monday.  More than $53bln of new debt priced through Thursday and there is a rare large deal in the market on Friday that is likely to push the total past $60bln.  Next week is expected to be reasonably busy with syndicate desks estimating about $30bln of new issuance.

Flows

According to LSEG Lipper, for the week ended February 21, investment-grade bond funds reported a net inflow of +$2.27bln.  This was the tenth consecutive weekly inflow for IG funds.


This information is intended solely to report on investment strategies identified by Cincinnati Asset Management. Opinions and estimates offered constitute our judgment and are subject to change without notice, as are statements of financial market trends, which are based on current market conditions. This material is not intended as an offer or solicitation to buy, hold or sell any financial instrument. Fixed income securities may be sensitive to prevailing interest rates. When rates rise the value generally declines. Past performance is not a guarantee of future results.

16 Feb 2024

CAM High Yield Weekly Insights

(Bloomberg)  High Yield Market Highlights

  • US junk bonds may end a three-week rally as they head to close the week with modest negative returns. Markets were jolted earlier this week when faster-than-expected inflation caused the biggest one-day loss in four months.
  • The consumer price index rose by more than forecast in January on a monthly and annual basis, suggesting that the road back to the 2% inflation target will be bumpy.
  • However, the markets quickly pared those losses. The rebound got a boost after data showed US factory production declined for the first time in three months and retail sales dropped in January, indicating that inflation will moderate steadily toward the target.
  • Yields climbed to a five-week high of 7.91% on Tuesday after the surprise rise in inflation, but dropped to 7.84% after data showed retail sales fell the most in year and factory production declined. However, yields are still up nine basis points week-to-date at 7.84%.
  • The modest losses extend across ratings in the US junk bond market. CCC yields rose eight basis points for the week to 12.58% after jumping to 12.68% on Tuesday.
  • BB yields closed at 6.59% after rising to 6.63%, up eight basis points for the week. BBs are headed toward a second straight week of losses.
  • As the market was rattled by inflation data, US borrowers stayed on the sidelines as they assessed the risk appetite.
  • The primary market was relatively quiet after Monday. More than $6b priced on Monday to make it the busiest day since April 2023.
  • The month-to-date supply stood at almost $19b and year-to-date at $50b.
  • Even amid volatility, spreads were closer to 300 basis points and yields were still below 8%.
  • Barclays expects spreads to compress further to a range of 290-315 basis points in the next six months.
  • Marginal demand for yield is strong, and spreads seems to be an afterthought, Brad Rogoff and Dominique Toublan of Barclays wrote this morning.
  • We see limited headwinds from the macro side and credit fundamentals, they wrote.


This information is intended solely to report on investment strategies identified by Cincinnati Asset Management. Opinions and estimates offered constitute our judgment and are subject to change without notice, as are statements of financial market trends, which are based on current market conditions. This material is not intended as an offer or solicitation to buy, hold or sell any financial instrument. Fixed income securities may be sensitive to prevailing interest rates. When rates rise the value generally declines. Past performance is not a guarantee of future results.

16 Feb 2024

CAM Investment Grade Weekly Insights

Credit spreads are back at the tightest levels of the year.  The Bloomberg US Corporate Bond Index closed at 92 on Thursday February 15 after having closed the week prior at 95.  The 10yr is trading at 4.30% this Friday morning after closing last week at 4.18%. Through Thursday, the Investment Grade Corporate Index YTD total return was -1.63%.

Economics

There was a boatload of data this week and it resulted in volatility in equities and Treasuries. The three major highlights are as follows: first, CPI came in hotter than expected on Tuesday morning which sent rates higher and stocks lower. Thursday morning was for the doves as retail sales data came in much weaker than expected –this sent rates lower.  Finally on Friday morning, a data release showed that the producer price index rose more than expected.  The PPI release sent rates to their highest levels of the week and stocks had a modestly negative reaction.  At the end of the this note we have attached a weekly price graph of the 2-year Treasury as well as the Dow Jones Industrial average to illustrate some of the volatility that occurred in those markets during the week.  As far as investment grade credit was concerned, the asset class fared well during the week as spreads shot tighter but there is a cautious tone in the market amid higher Treasury yields as we go to print this Friday morning.  Next week is a holiday shortened week that is light on economic data.  We are of the mind that the price action this week was ultimately helpful as we felt that there was far too much consensus from market participants on imminent rate cuts at the March meeting.  The economic data has served to all but squash the prospect of a cut at the March 20 meeting and now we are seeing much more reasonable estimates from market prognosticators that the first rate cut may be delayed until the May, June or July meetings.  We still don’t think it is a lock that the Fed cuts rates at all this year and we cannot discount entirely the possibility that inflation data remains sticky, pushing the first cut into 2025 and thus increasing the odds of a landing that isn’t necessarily hard but certainly isn’t soft.

Issuance

It was another active week for issuance as borrowers priced more than $37bln in new debt.  Bristol Myers led the way as it printed $13bln across 9 tranches to fund its acquisitions of Karuna Therapeutics and Rayzebio.  Next week is expected to be especially busy even despite the fact that the market is closed on Monday.  Estimates are calling for as much as $45bln in new debt when the market reconvenes after Presidents Day.

Flows

According to LSEG Lipper, for the week ended February 14, investment-grade bond funds reported a net inflow of +$2.28bln.  This was the ninth consecutive weekly inflow for IG funds.

U.S. 2 Year Treasury Last 5 Days:

Dow Jones Industrial Average Last 5 Days:


This information is intended solely to report on investment strategies identified by Cincinnati Asset Management. Opinions and estimates offered constitute our judgment and are subject to change without notice, as are statements of financial market trends, which are based on current market conditions. This material is not intended as an offer or solicitation to buy, hold or sell any financial instrument. Fixed income securities may be sensitive to prevailing interest rates. When rates rise the value generally declines. Past performance is not a guarantee of future results.

09 Feb 2024

CAM High Yield Weekly Insights

(Bloomberg)  High Yield Market Highlights

  • After a bumpy start to the year, US junk bonds are headed for their third straight week of gains, propelled by CCCs, the riskiest tier of the high yield market.
  • Gains spanned across the market, spurred by economic growth backed by strong labor market, expanding business activity and cooling inflation data, brushing off Federal Reserve officials’ chorus reiterating that the central bank is not in a hurry to ease monetary policy.
  • Risk assets were mostly higher this week, along with yields, as earnings results remained largely positive, Barclays’ Brad Rogoff and Dominique Toublan wrote on Friday
  • With macro data still benign, spreads should continue to react to yield moves as the incremental buyer is yield-focused, they wrote
  • CCC yields fell 11 basis points week-to-date to 12.45%, the biggest weekly decline within the high yield market. CCCs are on track to be the best performing asset in the US junk bond market, with week-to-date gains of 0.32%
  • The rally gained legs as fears of a recession receded in the backdrop of continuing strength in the labor market as US unemployment claims fell for the first time in three weeks
  • The broader US high yield index yield rose by three basis points to 7.79%. The rally in CCCs drove the modest gains in broader index
  • As spreads dropped to a six-week low of 321 basis points and yields hovered near 8%, US borrowers continued to crowd the primary market. Borrowers were in a hurry to capitalize on the still-low cost of debt, yet high enough to attract buyers, before the economy begins to show some expected signs of slowing in the second half
  • After a busy January, with the month-to-date supply at $8.55b, February is on track to be the busiest since 2021


This information is intended solely to report on investment strategies identified by Cincinnati Asset Management. Opinions and estimates offered constitute our judgment and are subject to change without notice, as are statements of financial market trends, which are based on current market conditions. This material is not intended as an offer or solicitation to buy, hold or sell any financial instrument. Fixed income securities may be sensitive to prevailing interest rates. When rates rise the value generally declines. Past performance is not a guarantee of future results.

26 Jan 2024

CAM High Yield Weekly Insights

(Bloomberg)  High Yield Market Highlights

  • US junk bond supply so far this month is 13% above that for all of January 2023, helped by $3.5b of sales Thursday that was the busiest session in three months.
  • The market is on track to have its heaviest overall month in more than two years, with new borrowers led by sponsor-owned companies rushing to refinance debt and extend maturities. Yields have held firmly below 8% and spreads remain below 350 basis points.
  • At least four borrowers are expected to sell about $4b in the coming days
  • Economic data continue to bolster sentiment, the latest being GDP growth trouncing forecasts amid a jump in personal spending
  • Resilient growth, strong business investment and new home sales have spurned recession calls and bolstered risk assets
  • Junk bonds are headed for weekly gains, with yields down 9bps to 7.80% and spreads narrowing 4bps to 334bps
  • Strength has been across ratings
  • BB yields have dropped back below 6.5% and spreads hover near 200bps, with the segment returning 0.4% so far this week
  • CCCs have climbed for six consecutive sessions, generating combined gains of 0.5% since Monday


This information is intended solely to report on investment strategies identified by Cincinnati Asset Management. Opinions and estimates offered constitute our judgment and are subject to change without notice, as are statements of financial market trends, which are based on current market conditions. This material is not intended as an offer or solicitation to buy, hold or sell any financial instrument. Fixed income securities may be sensitive to prevailing interest rates. When rates rise the value generally declines. Past performance is not a guarantee of future results.

26 Jan 2024

CAM Investment Grade Weekly Insights

Credit spreads are once again trading at the tightest levels of the year as we go to print.  The Bloomberg US Corporate Bond Index closed at 93 on Thursday January 25 after having closed the week prior at 95.  The 10yr is trading at 4.16% this Friday morning after closing last week at 4.12% –the 10yr yield is 24bps higher than where it began 2024.  Through Thursday, the Corporate Index YTD total return was -0.99%.

Economics

It was a robust week of data and central bank meetings, although none of the releases resulted in large market swings.  The Bank of Canada held its key rate at 5% on Wednesday while the ECB held its deposit rate at 4% for the third consecutive meeting on Thursday.  In the U.S. the most anticipated release was Friday morning when the Federal Reserve’s preferred inflation measure hit the tape. PCE rose 0.2% in December from the previous month after posting a 0.1% decline in November.  It showed that prices were up 2.6% on the year, which is much lower than the reading at the end of 2022.  Bottom line, the data is showing significant progress in the war against inflation.  Next week, all eyes are on the FOMC which releases its first rate decision of the year on Wednesday.  Market prognosticators are looking for the Fed to hold steady but it is the commentary around the timing of easing that could impact global markets.

Issuance

Issuance this week was not paltry but it was underwhelming compared to the consensus estimate as companies priced $18.55bln in new debt relative to expectations of $25bln.  There is one deal pending on Friday morning with its size to-be-determined which will add to the monthly total through Thursday of $167.8bln.  Recall that the all-time record for the month of January was $175bln which was set in 2017.  This record is well within striking distance as preliminary estimates for issuance next week are $20-$25bln.

Flows

According to Refinitiv Lipper, for the week ended January 24, investment-grade bond funds reported a net inflow of +$1.24bln.  This was the sixth consecutive weekly inflow for IG funds.

This information is intended solely to report on investment strategies identified by Cincinnati Asset Management. Opinions and estimates offered constitute our judgment and are subject to change without notice, as are statements of financial market trends, which are based on current market conditions. This material is not intended as an offer or solicitation to buy, hold or sell any financial instrument. Fixed income securities may be sensitive to prevailing interest rates. When rates rise the value generally declines. Past performance is not a guarantee of future results.

24 Jan 2024

2023 Q4 High Yield Quarterly

In the fourth quarter of 2023, the Bloomberg US Corporate High Yield Index (“Index”) return was 7.16% bringing the year to date (“YTD”) return to 13.44%.  The S&P 500 index return was 11.68% (including dividends reinvested) bringing the YTD return to 26.26%.  Over the period, while the 10 year Treasury yield decreased 69 basis points, the Index option adjusted spread (“OAS”) tightened 71 basis points moving from 394 basis points to 323 basis points.

All ratings segments of the High Yield Market participated in the spread tightening as BB rated securities tightened 63 basis points, B rated securities tightened 89 basis points, and CCC rated securities tightened 72 basis points.  The chart below from Bloomberg displays the spread moves in the Index over the past five years.  For reference, the average level over that time period was 413 basis points.

The sector and industry returns in this paragraph are all Index return numbers.  The Index is mapped in a manner where the “sector” is broader with the more specific “industry” beneath it.  For example, Energy is a “sector” and the “industries” within the Energy sector include independent energy, integrated energy, midstream, oil field services, and refining.  The Brokerage, Banking, and Finance sectors were the best performers during the quarter, posting returns of 11.80%, 9.37%, and 8.40%, respectively.  On the other hand, Transportation, Energy, and Other Industrial were the worst performing sectors, posting returns of 4.25%, 5.24%, and 6.53%, respectively.  At the industry level, retailers, media, and building materials all posted the best returns.  The retailers industry posted the highest return of 10.03%.  The lowest performing industries during the quarter were oil field services, airlines, and independent energy.  The oil field services industry posted the lowest return of 3.10%.

While there was a dearth of issuance during 2022 as interest rates rapidly increased and capital structures were previously refinanced, the primary market perked up a bit during each quarter this year.  Issuance has remained low by historical standards as so much was pushed out by the large issuance during 2020 and 2021.  For 2024, strategists are looking for issuance in the range of $200-$230 billion.  Of the issuance that did take place during Q4, Finance took 29% of the market share followed by Energy at 28% share and Industrials at 13% share.

The Federal Reserve did hold the Target Rate steady at the November and December meetings.  There was no meeting held in October.  This made three consecutive meetings without a hike.  The last hike was back in July.  For the first time since March of 2021, the Fed is not projecting additional hikes.  In fact, the Fed dot plot shows that Fed officials are forecasting 75 basis points in cuts during 2024.  It sure seems like the worm has finally turned and the market is responding positively.  During the December post meeting press conference, Chair Powell did pay lip service to the ability to hike again if needed, but the focus moved to rate cuts.  With regard to when it will become appropriate to cut rates, Powell said “That begins to come into view and is clearly a topic of discussion out in the world and also a discussion for us at our meeting today.”i  The Fed’s main objective has been lowering inflation and it continues to trend in the desired direction.  The most recent report for Core CPI showed a year over year growth rate of 4.0% down from a peak of 6.6% over one year ago.  Further, the most recent Core PCE growth rate measured 3.2% off the peak of 5.6% from February of 2022.

Intermediate Treasuries decreased 69 basis points over the quarter, as the 10-year Treasury yield was at 4.57% on September 30th, and 3.88% at the end of the fourth quarter.  The 5-year Treasury decreased 76 basis points over the quarter, moving from 4.61% on September 30th, to 3.85% at the end of the fourth quarter.  Intermediate term yields more often reflect GDP and expectations for future economic growth and inflation rather than actions taken by the FOMC to adjust the target rate.  The revised third quarter GDP print was 4.9% (quarter over quarter annualized rate).  Looking forward, the current consensus view of economists suggests a GDP for 2024 around 1.3% with inflation expectations around 2.6%.ii

Being a more conservative asset manager, Cincinnati Asset Management does not buy CCC and lower rated securities.  Additionally, our interest rate agnostic philosophy keeps us generally positioned in the five to ten year maturity timeframe.  During Q4, Index performance was very strong leading to our cash position being a drag on performance.  Additional performance drag was due to our credit selections within banking and brokerage as we positioned in high quality credits in those sectors.  Benefiting our performance this quarter were our credit selections in capital goods, technology, and electric utilities.

The Bloomberg US Corporate High Yield Index ended the fourth quarter with a yield of 7.59%.  Treasury volatility, as measured by the Merrill Lynch Option Volatility Estimate (“MOVE” Index), has picked up quite a bit the past couple of years.  The MOVE averaged 121 during 2023 relative to a 62 average over 2021.  However, the current rate of 114 is well below the spike near 200 back in March during the banking scare.  Data available through November shows 39 defaults during 2023 which is up from 16 defaults during all of 2022.  The trailing twelve month dollar-weighted default rate is 2.46%.iii  The current default rate is relative to the 1.14%, 1.30%, 1.74%, 1.93% default rates from the previous four quarter end data points listed oldest to most recent.  While defaults are ticking up, the fundamentals of high yield companies still look good.  From a technical view, fund flows were positive in the quarter at $6.7 billion and total -$22.6 billion YTD.iv  No doubt there are risks, but we are of the belief that for clients that have an investment horizon over a complete market cycle, high yield deserves to be considered as part of the portfolio allocation.

What a difference several months can make.  Not too long ago 10 year rates were at 15 year highs topping out close to 5%.  Today the 10 year rate is just under 4%.  Crude oil was over $90 per barrel and now it is a touch over $70 per barrel.  As we move forward in 2024, the labor market is holding up but cooling as job seekers are beginning to struggle to find work.  Consumer delinquencies have been ticking up across most loan categories while savings have dwindled and the savings rate remains below average.v  No doubt that this softness is being taken into account by market participants.  That is the reason for the lower GDP projections and the Fed talking potential cuts at this point in time.  Our exercise of discipline and credit selectivity is important as we continue to evaluate that the given compensation for the perceived level of risk remains appropriate.  As always, we will continue our search for value and adjust positions as we uncover compelling situations.  Finally, we are very grateful for the trust placed in our team to manage your capital.

This information is intended solely to report on investment strategies identified by Cincinnati Asset Management. Opinions and estimates offered constitute our judgment and are subject to change without notice, as are statements of financial market trends, which are based on current market conditions. This material is not intended as an offer or solicitation to buy, hold or sell any financial instrument.  Fixed income securities may be sensitive to prevailing interest rates.  When rates rise the value generally declines.  Past performance is not a guarantee of future results.  Gross of advisory fee performance does not reflect the deduction of investment advisory fees.  Our advisory fees are disclosed in Form ADV Part 2A.  Accounts managed through brokerage firm programs usually will include additional fees.  Returns are calculated monthly in U.S. dollars and include reinvestment of dividends and interest. The index is unmanaged and does not take into account fees, expenses, and transaction costs.  It is shown for comparative purposes and is based on information generally available to the public from sources believed to be reliable.  No representation is made to its accuracy or completeness.  Additional disclosures on the material risks and potential benefits of investing in corporate bonds are available on our website: https://www.cambonds.com/disclosure-statements/.

i Bloomberg December 13, 2023:  Fed Pivots to Rate Cuts

ii Bloomberg January 2, 2024: Economic Forecasts (ECFC)

iii Moody’s December 14, 2023:  November 2023 Default Report and data file

iv CreditSights December 21, 2023:  “Credit Flows”

v Moody’s December 2023:  State of the US Consumer