Comentarios y perspectivas sobre el primer trimestre
Abril de 2026
La inestabilidad en Oriente Medio supuso un obstáculo para los activos de riesgo durante el primer trimestre. Si bien el crédito con grado de inversión resistió mejor que la mayoría, los diferenciales más amplios y la venta de bonos del Tesoro afectaron el rendimiento.

Resumen del primer trimestre
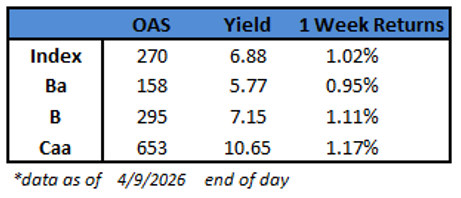
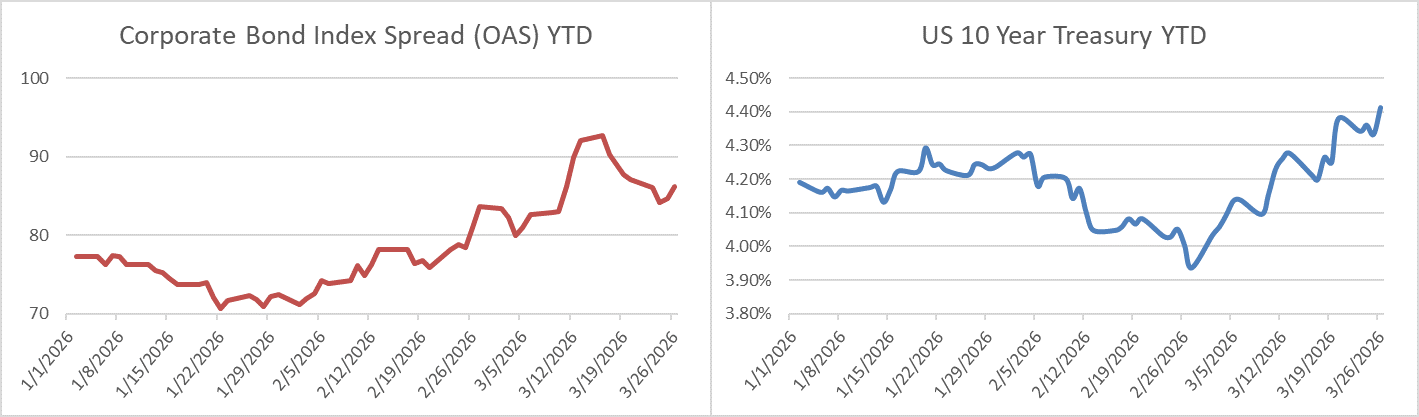
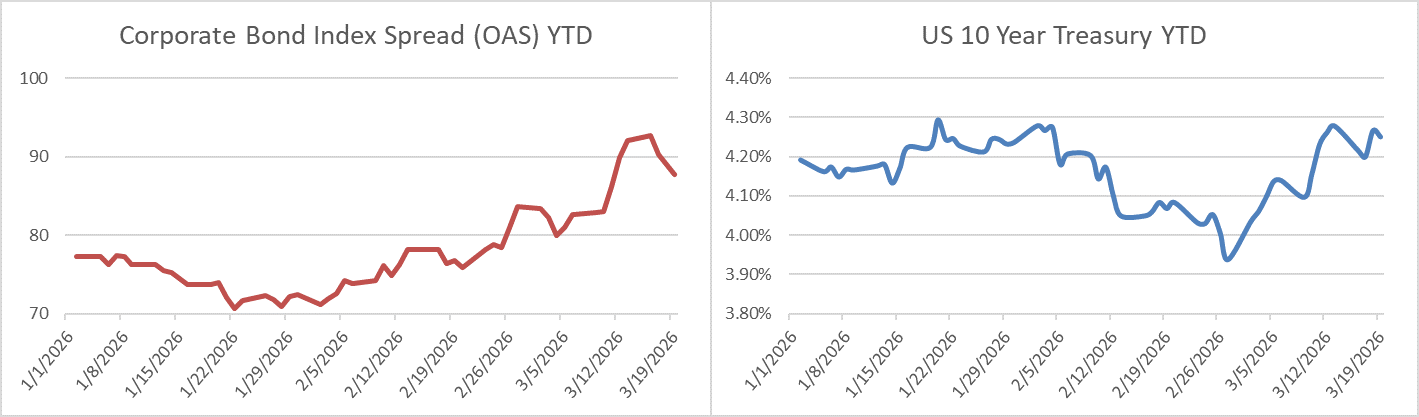
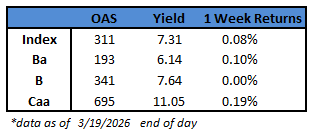
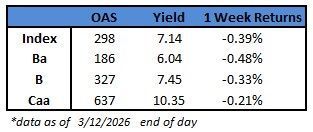
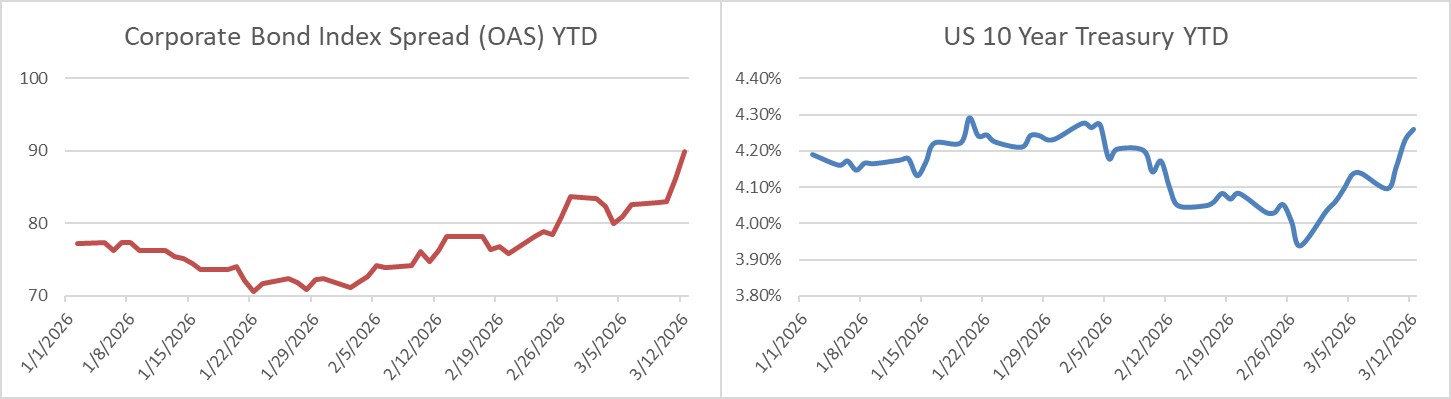
El primer trimestre destacó por un marcado contraste entre un comienzo tranquilo y un final turbulento. Enero marcó un ajuste metódico, con el diferencial ajustado por opciones (OAS) del Índice de bonos corporativos de EE. UU. de Bloomberg (el Índice) al comenzar el período en 78 antes de subir a 71 cerca del final de ese mes, el nivel más ajustado para los diferenciales de crédito desde 1998.i Los diferenciales experimentaron un ligero respiro durante el mes de febrero, pero se mantuvieron en niveles estables, con una cotización en torno a los 70 hasta los últimos días de negociación del mes. Los ataques aéreos coordinados entre Estados Unidos e Israel contra Irán a finales de febrero tuvieron repercusiones en los activos de riesgo. Marzo fue el mes de la volatilidad, y si bien el crédito con grado de inversión se comportó relativamente bien, no salió ileso. El OAS del Índice llegó a cotizar 93 a mediados de marzo antes de recuperar algo de impulso, y finalizó el período en un diferencial de 89.

Los bonos del Tesoro se mantuvieron estables en enero y luego repuntaron durante todo febrero, impulsados por inversores que reaccionaron a la debilidad del empleo en EE. UU. y anticiparon múltiples recortes de política monetaria por parte de la Reserva Federal. En marzo, la percepción del mercado se modificó de manera abrupta, ya que el conflicto en Irán provocó un fuerte aumento de los rendimientos de los bonos del Tesoro. Fue un movimiento contradictorio en las tasas; lo habitual es que un conflicto bélico genere una fuga hacia activos seguros y una subida de los bonos del Tesoro, pero esta evolución de los precios fue una clara respuesta a los elevados precios del petróleo y a la posibilidad de una inflación más elevada. Al cierre del trimestre, la evolución general de los tipos de interés provocó que los bonos del Tesoro a 2, 5 y 10 años terminaran el período con un alza de 32, 21 y 15 puntos básicos, respectivamente. El impacto desproporcionado en el extremo inicial de la curva estuvo relacionado con los cálculos de los inversores en torno al tipo de interés oficial de la Reserva Federal. Al comienzo del trimestre, los futuros de los fondos federales reflejaban más de 2 recortes completos en 2026, pero al cierre, no reflejaban ningún recorte para ese año.ii
El impacto del aumento de los rendimientos de los bonos del Tesoro y la ampliación de los diferenciales de crédito en 11 puntos básicos resultaron demasiado difíciles de superar para el crédito con grado de inversión, lo que provocó una rentabilidad total ligeramente negativa para esta clase de activos durante el primer trimestre.
Mayores rendimientos = Protección contra pérdidas
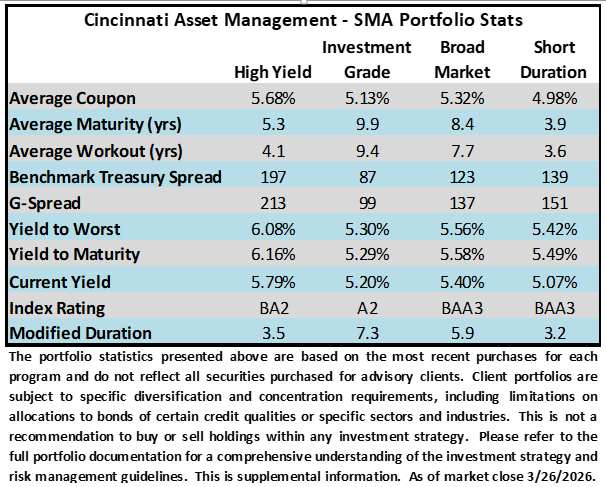
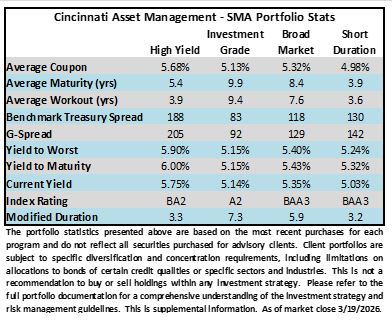
No es de nuestro agrado reportar un trimestre con resultados negativos, pero consideramos alentador el comportamiento del crédito con grado de inversión durante el mes de marzo en medio de un entorno de extrema volatilidad. Históricamente, el crédito con grado de inversión desempeñó un papel importante a la hora de proporcionar estabilidad a la asignación general de una cartera, y creemos que cumplió con ese cometido al superar el rendimiento de la mayoría de las demás clases de activos importantes. La rentabilidad se mantiene elevada, lo que contribuye a proporcionar un margen de seguridad a los inversores en crédito, incluso en un entorno con diferenciales de crédito más ajustados que los promedios históricos. El siguiente análisis muestra la rentabilidad total anual aproximada que un inversor podría anticipar en diversos escenarios de fluctuación de los tipos de interés, tanto al alza como a la baja. También incluye datos de marzo de 2021 para ilustrar el impacto que esos mismos choques habrían tenido al invertir con rendimientos totales mucho más bajos.

Este análisis, de carácter simplificado, buscaba aislar el efecto de los movimientos de tasas de interés, asumiendo que no habría cambios en los diferenciales de crédito. La realidad es que, si bien los diferenciales de crédito pueden comenzar y terminar un período relativamente sin cambios, están en constante movimiento a lo largo de cada jornada de negociación. Sin embargo, este ejercicio ilustra el poder de invertir a tasas de interés más altas. Un mejor punto de partida conlleva una mayor protección ante las pérdidas y un mayor potencial de rentabilidad en las ganancias.
Crédito privado
Recibimos consultas de algunos de nuestros inversores sobre el posible riesgo sistémico derivado del malestar en el crédito privado y cómo podría afectar a las inversiones en bonos públicos. El crédito privado es simplemente una de las muchas clases de activos dentro del amplio mundo de la renta fija, que incluye valores respaldados por activos (ABS), valores respaldados por hipotecas (MBS), obligaciones garantizadas por préstamos (CLO), bonos corporativos con grado de inversión, bonos corporativos de alto rendimiento, bonos del Tesoro y bonos municipales, entre otros. El impacto general sobre otras clases de activos de renta fija es mínimo, particularmente en el caso de las empresas con grado de inversión, que rara vez utilizan los mercados de crédito privado dentro de su estructura financiera.
En su libro Principios de Economía, Greg Mankiw describe un principio clave del costo de oportunidad: “Para conseguir algo que nos gusta, generalmente tenemos que renunciar a otra cosa que también nos gusta. Tomar decisiones implica sacrificar un objetivo en favor de otro”. El crédito privado suele ofrecer una mayor rentabilidad que el crédito que cotiza en bolsa, pero a costa de una menor liquidez, una mayor opacidad y, en muchos casos, una menor diversificación (basta con observar la enorme exposición que algunos prestamistas privados tienen en la industria del software).iii El crédito privado se otorga con poca frecuencia y a discreción del administrador. Los precios de los créditos públicos se actualizan pocos minutos después de cada transacción. No hay nada intrínsecamente malo en el crédito privado; como todas las inversiones, se trata de una cuestión de idoneidad. Si un inversor posee una parte de su cartera que adopta una perspectiva estratégica a muy largo plazo, con una tolerancia al riesgo adecuada y sin necesidades de liquidez en el futuro previsible, es probable que cumpla con los requisitos para destinar una parte de esa cartera al crédito privado. Según estimaciones de Bloomberg, los inversores intentaron retirar $13,000 millones de más de una docena de fondos de crédito privados durante el primer trimestre, pero solo lograron disponer de aproximadamente $8,400 millones.iv Lamentablemente, es probable que muchos de estos inversores no comprendieran del todo las limitaciones de liquidez que implica invertir en este tipo de fondos.
Nueva emisión de oferta
El mercado primario de grado de inversión está casi siempre abierto a los negocios, y en marzo hizo honor a esa reputación. Según datos recopilados por Bloomberg, fue el cuarto mes con mayor volumen de operaciones de la historia, y el de mayor volumen fuera del auge de préstamos de la era de la pandemia.v

Las perturbaciones en los mercados de capitales no disuadieron a prestatarios e inversores de reunirse para cerrar acuerdos. Este alto grado de funcionalidad es una de las características que definen la categoría de Grado de inversión como clase de activo. Incluso en momentos de tensión en el mercado, los inversores y las empresas casi siempre tienen acceso a liquidez.
Reserva Federal
Durante el trimestre, el Comité Federal de Mercado Abierto (FOMC) tomó dos decisiones sobre la tasa de interés de referencia, y en ambas reuniones la mayoría del comité optó por mantener sin cambios la tasa de los fondos federales. Por otra parte, el presidente Trump presentó formalmente la candidatura de Kevin Warsh para suceder a Jerome Powell en la presidencia de la Junta de Gobernadores cuando finalice el mandato de Powell en mayo. Aunque todavía el Senado no lo confirmó, los mercados parecían estar de acuerdo con la elección de Warsh, ya que lo consideran una opción segura y aceptable.
Tal como mencionamos antes en este informe, las proyecciones sobre recortes de tasas a corto plazo se modificaron de manera considerable durante el trimestre. En un principio, se daba por hecho que habría 1-2 recortes de tasas en 2026, pero últimamente se planteó la posibilidad de subas de tasas si la inflación se recrudece debido al aumento de los precios del petróleo. Las cifras del mercado laboral mostraron resultados dispares: un reporte de empleo muy débil en febrero y, en contraste, el más fuerte desde 2024 en marzo. Dado el carácter retrospectivo de los datos de la Oficina de Estadísticas Laborales (BLS), la salud del mercado laboral es ahora mucho menos relevante de lo que habría sido en otras circunstancias, debido a la guerra con Irán. En resumen, creemos que la Reserva Federal permanecerá a la espera hasta que exista un avance más claro hacia una solución con Irán. Como mínimo, el FOMC necesitará varios meses de datos económicos “posteriores a la guerra” para poder evaluar con mayor precisión el impacto del aumento de los precios del petróleo en la economía estadounidense.
Lo mantenemos simple
No reaccionamos a la volatilidad del mercado con cambios importantes en nuestra filosofía o procesos. La construcción de nuestra cartera es conservadora por diseño y siempre se realiza desde una perspectiva de horizonte temporal más amplio. Lo último que queremos para nuestros clientes es que inviertan en una empresa cuyo destino dependa del próximo titular en la prensa. Por el contrario, nos centramos en incorporar a nuestras carteras empresas sólidas que puedan operar en diversos entornos económicos. Si la volatilidad se acelera y hay buenas empresas disponibles con descuentos significativos, entonces pueden contar con que nuestra actitud será aprovechar la oportunidad.
Agradecemos su confianza y colaboración. No dude en contactarnos para conversar sobre los mercados crediticios mientras atravesamos este período de incertidumbre.
Esta información solo tiene el propósito de dar a conocer las estrategias de inversión identificadas por Cincinnati Asset Management. Las opiniones y estimaciones ofrecidas están basadas en nuestro criterio y están sujetas a cambios sin previo aviso, al igual que las declaraciones sobre las tendencias del mercado financiero, que dependen de las condiciones actuales del mercado. Este material no tiene como objetivo ser una oferta ni una solicitud para comprar, mantener ni vender instrumentos financieros. El rendimiento pasado no es garantía de resultados futuros. El rendimiento bruto de la tarifa de asesoramiento no refleja la deducción de las tarifas de asesoramiento de inversión. Nuestras tarifas de asesoramiento se comunican en el Formulario ADV Parte 2A. En general, las cuentas administradas a través de programas de firmas de corretaje incluyen tarifas adicionales. Los retornos se calculan mensualmente en dólares estadounidenses e incluyen la reinversión de dividendos e intereses. El Índice no está administrado y no considera las tarifas de la cuenta, los gastos y los costos de transacción. Los rendimientos de los índices y los datos relacionados, como los rendimientos y los diferenciales, se presentan con fines comparativos y se basan en información generalmente disponible al público, proveniente de fuentes que se consideran confiables. No se realiza ningún tipo de declaración con respecto a la integridad o precisión de la información.
Los escenarios de rentabilidad que se presentan en el apartado “Mayores rendimientos = Protección contra pérdidas” son hipotéticos, tienen solo fines ilustrativos y no representan resultados de inversión reales. Están dirigidos a inversores institucionales o a un público con conocimientos financieros sólidos, capaz de evaluar las hipótesis y limitaciones del rendimiento hipotético. El análisis estima la rentabilidad total anual combinando el rendimiento inicial en el peor de los casos con el impacto estimado en el precio de los cambios paralelos en las tasas de los bonos del Tesoro de EE. UU. en función de la duración. Como se indicó anteriormente, este análisis no contempla cambios en los diferenciales de crédito, ni incumplimientos, ni costos de transacción, y no refleja el impacto de la gestión activa ni de la selección de valores. Los resultados reales pueden diferir sustancialmente debido a cambios en las tasas de interés, los diferenciales de crédito, los fundamentos del emisor, la liquidez del mercado, entre otros factores. El rendimiento hipotético tiene limitaciones inherentes y no refleja la experiencia real de los inversores ni de las operaciones comerciales.
La información proporcionada en este informe no debe considerarse una recomendación para comprar o vender ningún valor en particular. Los distintos tipos de inversiones implican distintos grados de riesgo y no puede garantizarse que cualquier inversión específica sea adecuada o rentable para la cartera de un cliente. Las inversiones de renta fija tienen distintos grados de riesgo crediticio, riesgo de tasa de interés, riesgo de incumplimiento y riesgo de prepago y extensión. En general, los precios de los bonos suben cuando las tasas de interés bajan y viceversa. Este efecto suele ser más pronunciado en el caso de los valores a largo plazo. No hay garantía de que los valores que se tratan en este documento hayan permanecido o permanecerán en la cartera de una cuenta en el momento en que reciba este informe o que los valores vendidos no se hayan vuelto a comprar. Los valores analizados no representan la cartera completa de una cuenta y, en conjunto, pueden representar solo un pequeño porcentaje de las tenencias de cartera de una cuenta. No debe suponerse que las transacciones de valores o participaciones analizadas fueron rentables o demostrarán serlo, o que las decisiones de inversión que tomemos en el futuro serán rentables o igualarán el rendimiento de la inversión de los valores examinados en este documento. Si se lo solicita, Cincinnati Asset Management proporcionará una lista de todas las recomendaciones de valores realizadas durante el último año.
En nuestro sitio web se encuentran disponibles las divulgaciones adicionales sobre los riesgos materiales y los posibles beneficios de invertir en bonos corporativos: https://www.cambonds.com/disclosure-statements/
i Bloomberg, 23 de enero de 2026, “AI Debt Binge Is Set to Test Credit’s 1990s-Like Euphoria”
ii Bloomberg, 31 de diciembre de 2025 y 31 de marzo de 2026, “World Interest Rate Probability”
iii The Wall Street Journal, 29 de marzo de 2026, “Private Credit’s Exposure to Ailing Software Industry Is Bigger Than Advertised”
iv Bloomberg, 26 de marzo de 2026, “Trapped in Private Credit, Investors Wait to Pull Out $5 Billion”
v Bloomberg, 2 de abril de 2026, “US IG ISSUANCE: Hyundai Capital America to Close Out 1Q Alone”