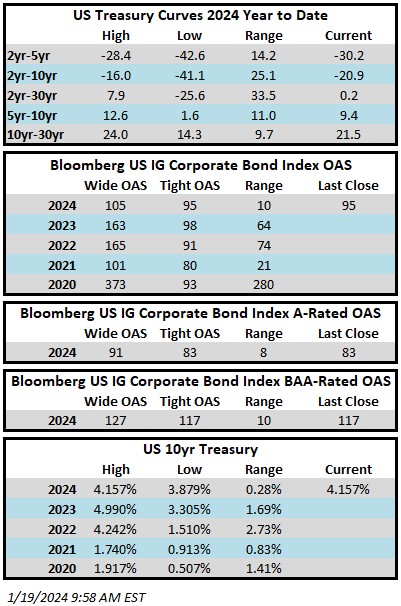
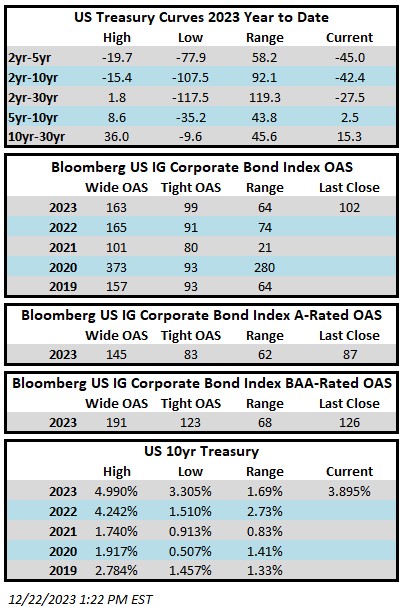
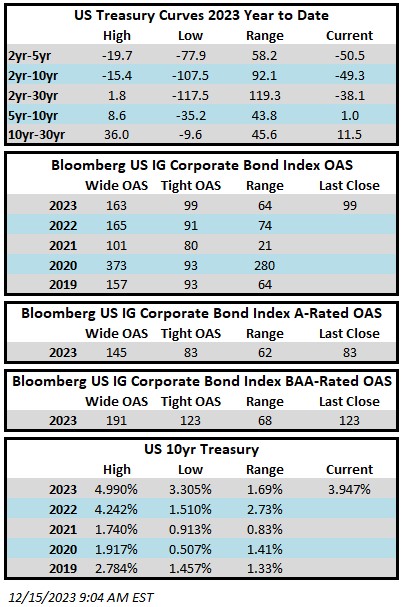
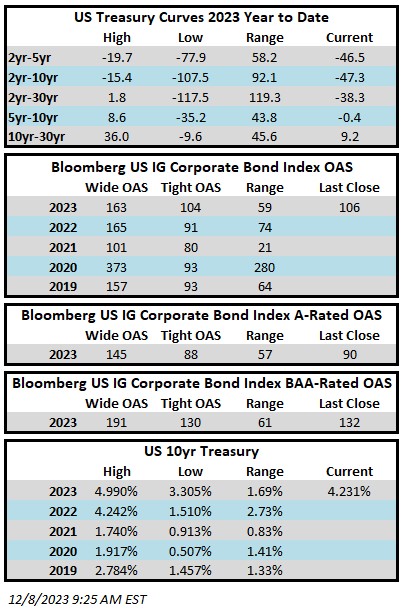
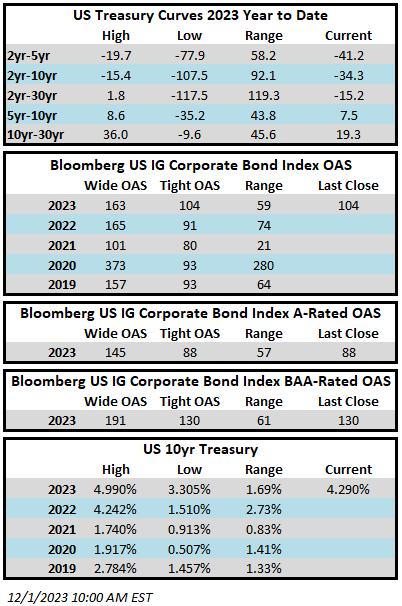
El crédito con grado de inversión se recuperó en 2023. El ejercicio fue una fuerte demostración de la reducción de los diferenciales y del beneficio residual asociado con altas tasas de interés. Para todo el año 2023, el diferencial ajustado por opciones (OAS) en el índice de bonos corporativos de EE. UU. de Bloomberg se redujo en 31 puntos básicos a 99 después de haber abierto el año en 130. Las tasas de interés fueron volátiles durante 2023, pero el rendimiento de los bonos del Tesoro al final del período terminó muy cerca de donde comenzó. Los bonos del Tesoro a 10 años terminaron 2023 en 3,88 %, que es el mismo número con el que cerraron en 2022. Los bonos del Tesoro a 2 y 5 años terminaron 2023 con una disminución de 18 y 15 puntos básicos, respectivamente, respecto de donde empezaron.

Año 2023 en revisión
Se trató de un año sólido con rendimiento positivo para el crédito con grado de inversión, aunque hubo algunos obstáculos en el camino. El índice corporativo se mantuvo en territorio positivo durante todas las jornadas bursátiles de los primeros nueve meses de 2023, salvo por dos días, hasta que las tasas de interés más altas afectaron la rentabilidad en las tres primeras semanas de octubre. El 19 de octubre, la rentabilidad total del último año para este índice estuvo en su punto más bajo, con una disminución de -2,53 %, lo que coincidió con el día en que el bono del Tesoro a 10 años cerró en 4,99 %, su nivel más alto del ciclo actual y su rendimiento más alto desde julio de 2007.

Desde ese punto en octubre se produjo un doble impacto de diferenciales más ajustados y tasas de interés más bajas, lo que se tradujo en rentabilidades más altas hacia fin de año. El OAS del índice bajó de 129, el 19 de octubre, a 99, a fin de año, mientras que el bono del Tesoro a 10 años descendió de 4,99 % a 3,88 % durante el mismo período. Como resultado de la reducción de los diferenciales y la disminución de las tasas de interés, el Índice corporativo registró una rentabilidad total de +11,33 % entre el 19 de octubre y finales del año 2023. ¿Cuál fue el catalizador de un cambio de rumbo tan drástico en el rendimiento en tan poco tiempo? Creemos que existen varias razones para que los inversores volvieran positivo el crédito con grado de inversión: una inflación controlada, un mercado de empleo resiliente y un crecimiento económico sólido, por nombrar algunas. Sin embargo, en nuestra opinión, el mayor impulsor del aumento del rendimiento fue la probabilidad de que la Reserva Federal hubiera llegado al final de su actual ciclo de subidas. La Reserva Federal optó por hacer una pausa en sus reuniones de septiembre, noviembre y diciembre, y en su comunicado de la reunión más reciente, se sugirió que no habría más subidas. A lo largo del ciclo de subidas, hemos argumentado que el crédito corporativo podría tener un buen desempeño cuando quedara más claro que la Reserva Federal había concluido con su política de suba de tasas, pero la profundidad y velocidad del repunte del cuarto trimestre superó nuestras expectativas.


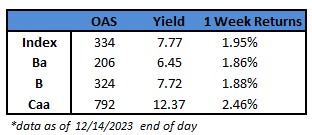
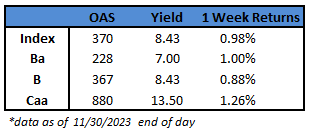
En lo que respecta al rendimiento del diferencial, 2023 fue testigo de diferenciales más ajustados en todos los ámbitos. Más de la mitad (4,55 %) de la rentabilidad total del índice para 2023 (8,52 %) se pudo atribuir a diferenciales de crédito más ajustados. El crédito con calificación de grado de inversión (IG) de menor calidad lideró el camino, especialmente a medida que se redujeron los diferenciales de crédito durante los últimos dos meses del año. Las industrias con un mejor rendimiento en 2023 fueron la de Medios y Entretenimiento y Servicios de Yacimientos Petrolíferos. Si bien el rendimiento para los rezagados fue positivo, Maquinaria de Construcción y Productos de Consumo fueron las dos industrias más rezagadas en relación con el índice corporativo. No hubo ninguna industria del universo con grado de inversión que se acercara lo más mínimo a un registro de rentabilidad total anual negativa.


Perspectiva para el 2024
Tenemos una postura positiva sobre el mercado de crédito con grado de inversión para el año entrante. El rendimiento de esta clase de activos continúa cotizando a niveles mucho más elevados en relación con la historia reciente. El rendimiento promedio del Índice durante los últimos 10 años fue de 3,45 % y finalizó a 5,06 % en 2023. No es atractivo hoy en día como lo era durante la liquidación de tasas de octubre cuando el índice cerró con un rendimiento superior a 6,4 %, pero la compensación ofrecida sigue siendo significativamente más alta que en el pasado reciente.

Nuestra visión positiva del mercado, según lo descrito anteriormente, se refiere a la compensación “total” para IG que está compuesta por el Tesoro subyacente, así como una compensación adicional que recibe el inversor por la tenencia de un bono en forma de diferencial de crédito. Hablando específicamente de la valoración de los diferenciales de crédito, no tenemos una visión tan positiva sobre los diferenciales cuando prestamos atención a los rendimientos producidos con los niveles actuales de negociación, y creemos que los diferenciales terminaron el año cerca del extremo más ajustado del valor de mercado. Si observamos los últimos 20 años de datos, el diferencial promedio del índice fue de 149, aunque este período incluye la Crisis Financiera Global (GFC) cuando el diferencial del índice se disparó a más de 600. El punto bajo fue de 75 en marzo de 2005 y el más bajo del ciclo de crédito actual fue de 80 en 2021. El diferencial del índice cerró el año en 99 y definitivamente es capaz de mantenerse operando lateralmente en este nivel durante un largo período de tiempo e incluso puede ajustarse a niveles más bajos a partir de aquí. Pero queremos ser realistas con nuestros inversores sobre el potencial alcista de los diferenciales de crédito. Creemos que los diferenciales de crédito están negociándose con una probabilidad relativamente alta de un impacto controlado, y cualquier dato que indique lo contrario (léase: recesión) provocará diferenciales más amplios. La buena noticia es que cuando se comienza con un rendimiento superior al 5 %, hay un cómodo margen de seguridad disponible para la ampliación de los diferenciales mientras se generan rendimientos totales positivos. También señalaríamos que la mayoría de las recesiones están acompañadas por una disminución de los rendimientos de los bonos del Tesoro, lo que podría compensar la ampliación de los diferenciales de crédito.
Tenemos una visión favorable de la salud general del mercado de créditos y creemos que la solidez de las métricas crediticias es convincente desde el punto de vista de la recompensa por el riesgo. Si bien el punto máximo de las métricas crediticias del ciclo actual se produjo a finales de 2021, la solvencia del mercado de créditos con grado de inversión como un todo es estable e incluso algunas mediciones muestran una mejora.1Fi Según la investigación recopilada por Barclays, a finales del tercer trimestre de 2023, el apalancamiento neto para el índice fue 2,8 veces mayor, los márgenes de EBITDA fueron del 29,6 % y la cobertura de intereses fue de 12,7 veces mayor.a1 Si bien el apalancamiento y la cobertura de intereses no tuvieron tan buen desempeño como en los últimos años, estuvieron dentro de niveles razonables y mostraron una mejora reciente, mientras los márgenes de EBITDA han sido notablemente estables y estuvieron solo un 0,4 % por debajo de los máximos históricos. Salvo unas pocas excepciones, las compañías calificadas con grado de inversión están en muy buena forma.

Posicionamiento de la cartera
Nos centramos en la gestión del riesgo crediticio a través de un proceso de investigación detallado; así que aunque tengamos una visión macro, pasamos la mayor parte del tiempo pensando en cómo esa visión más amplia puede afectar a las inversiones individuales dentro de las carteras de los clientes. Como recordatorio, estructuramos cada cuenta individual administrada de la siguiente manera.
- Diversificación: se ingresan datos iniciales para cada cliente individual o cartera institucional con 20 a 25 posiciones. Diversificamos las carteras buscando limitar cada cuenta a una exposición de 20 % a nivel sectorial y un 15 % a nivel de industria individual, con excepción del sector de Instituciones financieras (Finanzas). Para el sector de Finanzas, limitamos cada cuenta a una exposición de 30 % porque este sector representa una amplia porción del índice de IG con una ponderación del 32,97 % a finales de 2023.
- Calidad crediticia: uno de los mayores diferenciadores entre la cartera de CAM y el Índice radica en nuestro sesgo hacia créditos de mayor calidad, en el sentido de que buscamos limitar cada cuenta de cliente a una exposición del 30 % en bonos con calificación BAA. El índice tuvo una ponderación de 47,14 % en créditos con calificación BAA a finales de 2023 y esta cifra ha superado el 50 % varias veces para el índice en los últimos años: esto deja la cartera de CAM con una exposición significativamente menor a créditos de calificación más baja en comparación con el índice.
- Vencimiento: siempre buscaremos posicionar la cartera dentro de una banda de vencimiento intermedio que oscila entre los 5 y 10 años. Ocasionalmente verá que mantenemos algunos vencimientos más cortos que vencen a menos de 5 años. Esto se da especialmente durante el entorno actual, donde ciertas partes de la curva del Tesoro están invertidas; queremos ser pacientes y permitir más tiempo para que nuestras operaciones de venta y extensión sean rentables. Ocasionalmente también adquiriremos un bono con un vencimiento superior a 10 años pero esto no es habitual y una compra de esa naturaleza no tendrá una duración sustancialmente mayor a 10 años. Durante la fase de inversión, normalmente llenaremos nuevas carteras con vencimientos que fluctúan entre los 8 y los 10 años. A medida que una cuenta se vuelve antigua, buscamos vender los bonos con aproximadamente 5 años de vencimiento y, a continuación, reinvertimos los ingresos de esas ventas en vencimientos de aproximadamente 10 años. Como resultado de nuestro posicionamiento intermedio, a finales de 2023, nuestro compuesto tuvo una duración modificada de 5,4 en relación con la duración de 7,3 del índice.
La misión de nuestra Estrategia de grado de inversión es proporcionar a nuestros clientes rentabilidades superiores ajustadas al riesgo. Nuestra meta es minimizar la volatilidad incurriendo en menos riesgo crediticio y menos riesgo de tasas de interés que con el índice.
Vigilancia de la Reserva Federal
En sus comentarios preparados después de la reunión de diciembre del Comité Federal del Mercado Abierto (FOMC), el presidente Powell dijo que “…nuestra tasa de referencia probablemente esté en su punto máximo, o cerca de él, para este ciclo de ajuste”.ii Aunque no descartó específicamente nuevas alzas en las tasas, cada vez está más claro que es improbable que la Reserva Federal vuelva a subirlas. Ahora toda la atención se ha centrado en el relato del recorte de tasas de la Reserva Federal, lo que seguramente dominará el ciclo de noticias empresariales en 2024. La versión más reciente del “gráfico de puntos” de la Reserva Federal lanzado en su reunión de diciembre mostró que la banca central espera recortes de 0,75 % en las tasas para 2024. Una manera de interpretarlo es que si la Reserva Federal opera con aumentos de 25 puntos básicos, se prevén recortes en las tasas tres veces en el año. Cabe destacar que el gráfico de puntos solo es la mejor estimación en un punto temporal específico y no implica necesariamente que la estimación por consenso se hará realidad. Por ejemplo, el gráfico de puntos publicado en la reunión de septiembre de 2023 mostró que habría un aumento de 25 puntos básicos adicionales en 2023, pero eso no ocurrió.
La Reserva Federal causó un revuelo con sus comentarios moderados en su reunión de diciembre. Una medición que rastreamos para evaluar la percepción del mercado es el índice de condiciones financieras de Goldman Sachs, que es un promedio ponderado de tasas de interés a corto y largo plazo, el valor del dólar estadounidense, los diferenciales de crédito y la relación de los precios de las acciones con el promedio de 10 años de las ganancias por acción (EPS).

Como se puede ver en el gráfico anterior, las condiciones se fueron ajustando rápidamente en septiembre y octubre, antes de que empezaran a relajarse rápidamente, comenzando con la reunión del FOMC del 1 de noviembre y nuevamente en la reunión del 13 de diciembre (indicado por la línea vertical del gráfico). No consideramos que se trate necesariamente de un error de política, pero creemos que la conferencia de prensa de diciembre fue una oportunidad perdida para el presidente Powell de oponerse a la relajación de las condiciones financieras, que terminaron el 2023 cerca de los niveles más cómodos del año. La economía de Estados Unidos sumó 4.8 millones de empleos en 2022 y otros 2.7 millones en 2023.iii Creemos que el umbral para los recortes de las tasas a corto plazo es bastante alto, a menos que la economía experimente una desaceleración proporcional del crecimiento del empleo en 2024.
Esto nos conduce a nuestra reflexión final respecto de la política de la Reserva Federal. El margen deseado para los Fondos Federales fue de 5,25 % a 5,5 % al final del año y la tasa efectiva de Fondos Federales, según los datos recopilados por la Reserva Federal de Nueva York, fue del 5,33 % a finales de 2023. Un movimiento de 75 puntos básicos en una tasa efectiva de 5,33 % supone una disminución porcentual de 14 %. Nos preguntamos si la perspectiva de un movimiento de apenas el 14 % es realmente suficiente para sostener la exuberancia que experimentaron los activos de riesgo en los últimos dos meses de 2023. Creemos que, independientemente de lo que digan, esta Reserva Federal tiene la determinación de no repetir los errores del pasado y debe tener la máxima confianza en que la inflación llegará a su objetivo del 2 % antes de comenzar a tener un impacto significativo en los recortes de tasas. La mejor manera que tiene la Reserva Federal para lograr esto es mantener su tasa de referencia “más alta por más tiempo”. Un período prolongado de tasas elevadas no es necesariamente algo malo para los bonos ni para las empresas con calificación de grado de inversión y balances sólidos, pero podría representar un obstáculo para las acciones y ciertos sectores de la economía, como el mercado comercial de bienes raíces. En última instancia, creemos que una tasa “más alta por más tiempo” disminuye la posibilidad de un impacto controlado y aumenta la probabilidad de que la economía entre en una recesión cerca del final de 2024 o en algún momento de 2025. El marco temporal de esta opción siempre es la parte más difícil.
De cara al futuro
Gracias por su continuo entusiasmo y apoyo y por depositar su confianza en nosotros para administrar el capital que tanto esfuerzo les costó ganar. Ansiamos colaborar con ustedes en 2024.
.
This information is intended solely to report on investment strategies identified by Cincinnati Asset Management. Opinions and estimates offered constitute our judgment and are subject to change without notice, as are statements of financial market trends, which are based on current market conditions. This material is not intended as an offer or solicitation to buy, hold or sell any financial instrument. Fixed income securities may be sensitive to prevailing interest rates. When rates rise the value generally declines. Past performance is not a guarantee of future results. Gross of advisory fee performance does not reflect the deduction of investment advisory fees. Our advisory fees are disclosed in Form ADV Part 2A. Accounts managed through brokerage firm programs usually will include additional fees. Returns are calculated monthly in U.S. dollars and include reinvestment of dividends and interest. The index is unmanaged and does not take into account fees, expenses, and transaction costs. It is shown for comparative purposes and is based on information generally available to the public from sources believed to be reliable. No representation is made to its accuracy or completeness.
The information provided in this report should not be considered a recommendation to purchase or sell any particular security. There is no assurance that any securities discussed herein will remain in an account’s portfolio at the time you receive this report or that securities sold have not been repurchased. The securities discussed do not represent an account’s entire portfolio and in the aggregate may represent only a small percentage of an account’s portfolio holdings. It should not be assumed that any of the securities transactions or holdings discussed were or will prove to be profitable, or that the investment decisions we make in the future will be profitable or will equal the investment performance of the securities discussed herein.
Additional disclosures on the material risks and potential benefits of investing in corporate bonds are available on our website: https://www.cambonds.com/disclosure-statements/
i Barclays Bank PLC, December 11 2023 “US Investment Grade Credit Metrics, Q3 23 Update: Stable”
ii Federal Reserve System Board of Governors Chairman Jerome H. Powell News Conference, December 13 2023 “Federal Reserve System”
iii The Wall Street Journal, January 5 2024 “Job Gains Picked Up in December Capping Year of Healthy Hiring”