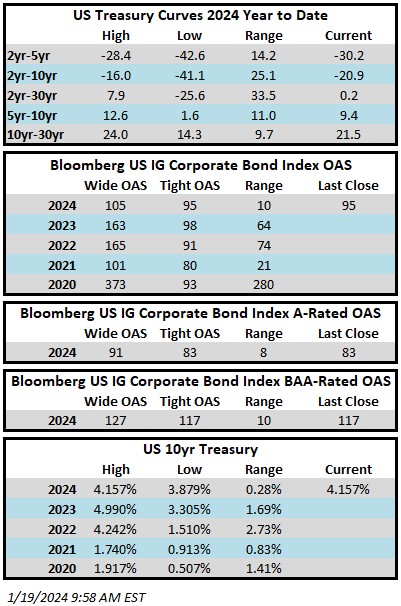
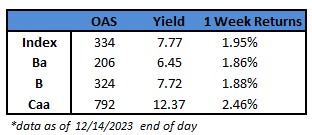
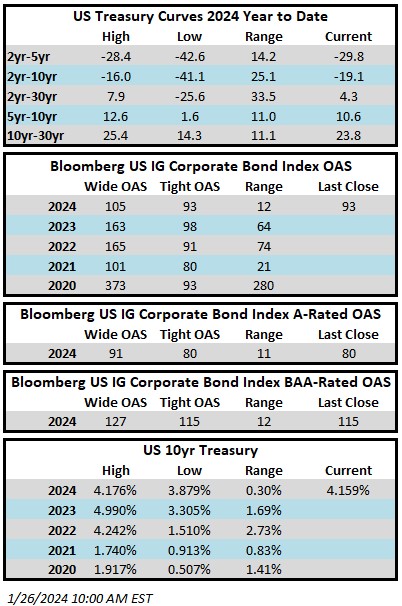
Category: Insight

04 Mar 2022

CAM Investment Grade Weekly Insights

For the second consecutive week, spreads will finish a Thursday evening at the widest levels of the year.  The tone of the market is also feeling heavy this Friday morning as we got to print amid geopolitical fallout from Europe.  The prospect of a nuclear incident at a Ukrainian facility is not something the markets are taking lightly. On the domestic front, the Friday morning jobs report showed that U.S. hiring was strong in February with employment numbers handily beating consensus estimates along with an unemployment rate that edged lower, to 3.8%.  This news likely keeps the Federal Reserve on track to begin its hiking cycle at its meeting later this month.  The OAS on the Bloomberg US Corporate Bond Index closed at 125 on Thursday, March 3, after having closed the week prior at 121.  The Investment Grade Corporate Index has posted a negative YTD total return of -5.8% through Thursday.  The YTD S&P500 Index return was -8.4% and the Nasdaq Composite Index return was -13.5%.

The primary market was extremely active this week with 31 deals totaling over $53bln with at least one deal pending on Friday that will add to this total.  This speaks to the resiliency of the investment grade credit market– even amid geopolitical uncertainty; the market remains open for business in a big way.  Next week’s consensus forecast is calling for things to remain busy with predictions of more than $40bln in new issue.  March is typically a seasonally busy month for issuance and it appears that 2022 is no exception.

Per data compiled by Wells Fargo, flows for investment grade were negative on the week.  Flows for the week of February 24–March 2 were -$2.1bln which brings the year-to-date total to -$14.7bln.

04 Mar 2022

CAM High Yield Weekly Insights

Fund Flows & Issuance: According to a Wells Fargo report, flows week to date were -$0.4 billion and year to date flows stand at -$26.0 billion. New issuance for the week was $1.7 billion and year to date issuance is at $34.9 billion.

(Bloomberg) High Yield Market Highlights

  • U.S. junk bonds are headed to the first back-to-back weekly gains since December with the risk-off mood easing after Federal Reserve Chair Jerome Powell said U.S. economic growth was strong enough to warrant a quarter-percentage-point interest rate hike this month.
  • That buoyed a market that had been weighed down by uncertainty over the economic outlook and the scope of the Fed’s coming interest rate hikes; traders last month speculated that the Fed could begin with a half-point rate increase.
  • Even as the war in Ukraine intensifies and commodity prices soar, credit market technicals have held up, Barclays’ strategist Brad Rogoff wrote on Friday, though he added that spreads could come under pressure near-term.
  • While sustained higher energy prices pose downside risks to the outlook, Barclays does not view them as sufficient to derail the recovery, Rogoff wrote.
  • Yields have been resilient through the week, closing unchanged at 5.66% week-to- date.
  • The 5-year and 10-year Treasury yields fell about 13bps week-to-date at close yesterday at 1.73% and 1.84%, respectively.
  • Spreads closed at +358bps, just up by 5bps
  • Junk bonds gained across ratings for the second straight week, with 0.21% returns for BBs, 0.22% single Bs and 0.15% CCCs.
  • CCCs have lost some momentum and were the worst performing segment for the second consecutive week, pushing single Bs to the top.
  • U.S. high yield may be in a holding pattern as equity futures slide and European stocks tumble to a one-year low as war risks intensified. Oil, meanwhile, is headed for the biggest weekly surge in almost two years after Russia’s invasion of Ukraine roiled global markets


(Bloomberg) Powell Backs Quarter-Point March Rate Hike, Open to Bigger Moves

  • Federal Reserve Chair Jerome Powell backed a quarter-point interest-rate hike this month to commence a series of increases and didn’t rule out a larger move at some stage, despite uncertainty caused by Russia’s invasion of Ukraine.
  • “I am inclined to propose and support a 25 basis-point rate hike,” Powell told the House Financial Services Committee Wednesday. “To the extent that inflation comes in higher or is more persistently high than that, then we would be prepared to move more aggressively by raising the federal funds rate by more than 25 basis points at a meeting or meetings.”
  • Fed officials are pivoting to tackle the fastest inflation in 40 years and a few have publicly discussed the potential need to hike by a half point some time this year if inflation comes in too hot. They get February data on consumer prices on March 10, five days before they start their next policy meeting.
  • While acknowledging the uncertainty posed by the attack on Ukraine, Powell said the need to remove pandemic policy support had not changed.
  • “The bottom line is that we will proceed but we will proceed carefully as we learn more about the implications of the Ukraine war for the economy,” he said.
  • Investors increased their bets on the pace of rate hikes this year as the Fed chief spoke, pricing in around 140 basis points of tightening starting this month — which will mark the first increase since 2018. U.S. stocks advanced and 10-year Treasury yields rose on Powell’s message that the economy is expanding with enough force to withstand higher borrowing costs.
  • Powell said the labor market is “extremely tight,” essentially a message to lawmakers that the central bank has met its maximum employment goal in current conditions, which opens the door to its inflation fight. He said employers are having difficulties filling job openings, while workers are quitting and taking new jobs, helping wages rise at the fastest pace in years.
  • “We know that the best thing we can do to support a strong labor market is to promote a long expansion, and that is only possible in an environment of price stability,” Powell said, restating a line he has used several times now that interprets the inflation fight in terms of preserving the expansion.
  • The Fed chief said it wasn’t clear how high rates would have to rise to get inflation under control, in relation to the so-called “neutral” level that neither speeds up nor slows economic activity.
  • “We talk about getting to neutral, which is a neutral rate which would be somewhere between 2% and 2.5%. It may well be that we need to go higher than that. We just don’t know,” he said, adding that he believed it was possible to deliver that tightening without causing a recession.
25 Feb 2022

CAM Investment Grade Weekly Insights

Spreads finished Thursday of this week at their widest levels of the year but there has been a significant retracement through Friday morning.  The first half of the trading day on Thursday was extraordinarily weak with poor performance for risk assets as investors digested the news out of Europe before equities and credit staged a stunning reversal that afternoon.  The OAS on the Bloomberg US Corporate Bond Index closed at 124 on Thursday, February 25, after having closed the week prior at 118.  Investment grade has posted its worst start to a year ever with the Corporate Index down -6.5% total returns through Thursday.  The YTD S&P500 Index return was -9.77% and the Nasdaq Composite Index return was -13.69%.

The primary market was less active than expected this week with the backdrop of geopolitical tensions but investment grade companies still managed to issue $18bln of new debt.  Next week’s consensus forecast is calling for more than $25bln in new issue and some sell side prognosticators are predicting an extremely busy calendar for March with as much as $175bln+.  There are some jumbo deals waiting in the wings that could print next month which could balloon that figure even further.

Per data compiled by Wells Fargo, flows into investment grade were modestly positive on the week.  Flows for the week of February 17–23 were +$0.4bln which brings the year-to-date total to -$12.7bln.

25 Feb 2022

CAM High Yield Weekly Insights

Fund Flows & Issuance:  According to a Wells Fargo report, flows week to date were -$2.3 billion and year to date flows stand at -$25.6 billion.  New issuance for the week was $1.0 billion and year to date issuance is at $33.2 billion.


(Bloomberg)  High Yield Market Highlights

  • U.S. junk bonds are headed toward the sixth straight weekly loss as yields jump to a fresh 16-month high of 5.85% amid global market turmoil after Russia’s invasion of Ukraine. This would be the longest losing streak in more than six years.
  • The primary market ground to a halt after pricing a little more than $9b this month, the slowest February since 2016. It’s also the slowest start to a year for issuance since 2016, with year- to-date volume at $33b.
  • Rising yields and steady losses in junk bonds across ratings came amid broader market turbulence this year caused by inflation concerns, a hawkish Federal Reserve and geopolitical tensions.
  • Given the lack of clarity on macro risks, “risk assets will be under pressure in the near term,” Barlcays’ strategist Brad Rogoff wrote on Friday.
  • The BB index, the most rate-sensitive part of the high-yield market, is now set to post its eighth straight weekly loss, the longest period of losses since July 2013, after yields veered toward a 19-month high of 4.83%.
  • CCCs, the riskiest part of the junk-bond market, is also headed to end the week with losses. This would be the sixth consecutive week of losses as yields rose to a new 15-month high of 8.53%.


 (Bloomberg)  What the Russian Invasion Means for Credit

  • Russia’s invasion of Ukraine will translate to more trouble for corporate debt, money managers say. Some also wonder if the latest market weakness is a buying opportunity.
  • For now, few market participants are taking that risk. Companies postponed bond sales in the U.S. and Europe on Feb. 24 and credit risk gauges surged after Russia invaded Ukraine.
  • The military action heightened volatility in global bond markets already roiled by inflation and tightening monetary policy. Now oil prices are rising to their highest levels since 2014, and wheat prices in Paris hit a record. The result of inflation plus slower growth may be stagflation that can be terrible for corporate bondholders.
  • “The escalated uncertainty in Ukraine, and the spike in commodity prices, moderates the outlook for global growth and therefore increases the risk for corporate credit,” said Matt Toms, chief investment officer of fixed-income at Voya Investment Management.
  • Borrowers who could sell debt easily on any day for much of the last two years are now having to look for windows of relative calm. Price swings in secondary markets are widening.
  • New sales of U.S. investment-grade and junk bonds will likely shut down for the remainder of the week, according to people familiar with the matter. BellRing Brands on Feb. 24 withdrew a junk-bond deal that it had started marketing earlier in the week.
  • U.S. leveraged loan prices fell 1/2 to a full point in muted secondary trading on Feb. 24, according to people familiar. Meanwhile, a gauge of U.S. credit risk spiked, with the cost to protect a basket of investment-grade dollar bonds against default rising to the highest level since July 2020.
  • But even if the global growth picture is concerning, few U.S. companies will be severely affected by the invasion at this stage, investors said.
  • “The entire global economy is going to be impacted by Russia and Ukraine, but there’s not really going to be a lot of direct impact in the U.S., in terms of issuers whose results are going to be directly impacted by what’s going on there,” said Jeremy Burton, a portfolio manager at Pinebridge Investments.
  • Prices on investment-grade bonds now may end up being a great deal in retrospect, said Nicholas Elfner, co-head of research at Breckinridge Capital Advisors.
  • “Keep your eyes on the long-term and don’t get sucked into the abyss of negativity,” Elfner said. “Short-term blips in volatility and weakness in financial markets tend to be long-term buying opportunities.”


04 Feb 2022

CAM High Yield Weekly Insights

Fund Flows & Issuance:  According to a Wells Fargo report, flows week to date were -$3.6 billion and year to date flows stand at -$10.6 billion.  New issuance for the week was $6.0 billion and year to date issuance is at $25.4 billion.


 (Bloomberg)  High Yield Market Highlights

  • The U.S. junk bond primary market was powered by leveraged buyouts this week as cyber security firm McAfee Corp. and Scientific Games Holdings, a gaming and lottery operator, together sold almost $3b, accounting for one-half of this week’s issuance volume as the high yield market recovered from its worst January on record.
  • Junk bond borrowers of all stripes – funding strategic acquisitions, LBOs and plain-old refinancing outstanding debt – seemed to be in a hurry to rush to the market to get ahead of the rate-hike cycle, which is widely expected to begin as early as March, and avoid the uncertainty volatility that may follow.
  • The U.S. leveraged finance market was also undergoing a shift triggered by the Federal Reserve’s signal that rate hikes may begin in the next meeting and the overall hawkish tone suggesting an end to the easy money policy.
  • The shift became evident in McAfee Corp. and Scientific Games Holdings moving a portion of bonds to term loan as the latter, with a floating rate coupon and spot higher in the capital structure, were more attractive to investors in a rising rate environment.
  • The junk bond market was broadly resilient even as cautious investors pulled cash out of high yield retail funds.
  • Investors pulled almost $4b from U.S. high yield funds, the biggest weekly outflow since March of 2021 and the fourth consecutive week of outflows, the longest streak since June of 2021.
  • While weak earnings reports and increased central bank hawkishness drove a sharp sell-off in risk assets, “it is still too early to buy the dip,” Barclays strategist Brad Rogoff wrote on Friday, adding that monetary policy uncertainty is likely to remain elevated.
  • The broader junk bond returns came under pressure on Thursday posting losses of 0.4% as yields jumped 15bps to 4.21%.
  • Junk bonds may pause as U.S. equity futures reversed gains as concerns over inflation and monetary tightening outweighed earnings optimism driven by Amazon.com, Inc.
  • Oil, meanwhile, has rocketed to a fresh seven-year high near $92 a barrel, and almost every indicator is pointing to the rally extending.


(Bloomberg)  U.S. Job Growth Blows Past Estimates, Defying Gloom Over Omicron

  • U.S. employers extended a hiring spree last month despite a record spike in Covid-19 infections and related business closures, with surging wages adding further pressure on the Federal Reserve to raise interest rates.
  • Nonfarm payrolls increased 467,000 in January in a broad-based advance that followed substantial upward revisions to the prior two months, a Labor Department report showed Friday. The unemployment rate ticked up to 4%, and average hourly earnings jumped.
  • The median estimate in a Bloomberg survey of economists called for a 125,000 advance in payrolls, though forecasts ranged widely. A variety of factors including omicron, seasonal adjustment and the way workers who are home sick are factored in make interpreting the January data challenging.
  • The surprise display of strength suggests the labor market continues to improve, despite the temporary disruption from record-high levels of coronavirus infections and the resulting absenteeism from work. The data further reinforce Fed Chair Jerome Powell’s description last week of the labor market as “strong” and validate the central bank’s intention to raise interest rates in March to combat the highest inflation in nearly 40 years.
  • The dollar jumped along with Treasury yields following the report. U.S. stock-index futures dipped slightly. Investors began to price in the slight possibility of a sixth quarter-point Fed rate hike by the end of this year, while continuing to see a March increase as a lock and nudging up the chance of a 50-basis-point jump.
  • Meanwhile, the Labor Department’s report showed average hourly earnings rose 0.7% in January and 5.7% from a year ago, further fanning concerns about the persistence of inflation. The average workweek dropped.
  • The faster-than-expected advance in pay could fuel market concerns about the Fed taking an even more aggressive stance on inflation this year.
  • Despite the better-than-expected report, the impact of omicron on the labor market in January was substantial. There were 3.6 million employed Americans not at work due to illness, more than double that in December. Meanwhile, 6 million people were unable to work in the month because their employer closed or lost business due to the pandemic, roughly twice that in December.
  • The potential for a weak — or even negative — payrolls print, largely because of virus-related disruptions, was well telegraphed in the days ahead of the report, including by White House and Fed officials.
  • The job gains were broad based, led by a 151,000 advance in leisure and hospitality. Transportation and warehousing, retail trade and professional and business services also posted solid increases.
  • The solid employment growth in several categories may reflect businesses choosing to retain more holiday workers than normal in the face of a tight labor market.
14 Jan 2022

CAM High Yield Weekly Insights

 Fund Flows & Issuance:  According to a Wells Fargo report, flows week to date were -$1.6 billion and year to date flows stand at -$1.0 billion.  New issuance for the week was $6.0 billion and year to date issuance is at $10.5 billion.

 (Bloomberg)  High Yield Market Highlights

  • The U.S. junk-bond market rebounded from last week’s losses and is on track to end the week with gains, powered by a jump in oil prices and shrugging off outflows from retail funds. The rally boosted the primary market, which has seen $6 billion price.
  • The risk-on mood was evident as two first-time issuers came to market. Borrowers sold debt to fund a dividend and buy back shares even as investors pulled cash from U.S. high-yield funds.
  • The broader junk-bond index has made modest gains of 0.28% week-to-date after posting a small loss of 0.05% on Thursday.
  • Junk-bond index yields rose to 4.51% yesterday, up 6bps, and is down 9bps week-to-date.
  • The CCC index has gained 0.31% week-to-date after posting a modest loss of 0.02% yesterday.
  • CCC yields rose 4bps to close at 6.95%, down 11bps week-to-date.
  • The markets may waver as U.S. equity futures fluctuated ahead of the earnings season as investors turn away from inflation concerns and Federal Reserve policy. And oil, meanwhile, headed for a fourth straight weekly gain, the longest streak since October.


(Bloomberg)  U.S. Inflation Hits 39-Year High of 7%, Sets Stage for Fed Hike

  • U.S. consumer prices soared last year by the most in nearly four decades, sapping the purchasing power of American families and setting the stage for the Federal Reserve to begin hiking interest rates as soon as March.
  • The consumer price index climbed 7% in 2021, the largest 12-month gain since June 1982, according to Labor Department data released Wednesday. The widely followed inflation gauge rose 0.5% from November, exceeding forecasts.
  • Excluding the volatile food and energy components, so-called core prices accelerated from a month earlier, rising by a larger-than-forecast 0.6%. The measure jumped 5.5% from a year earlier, the biggest advance since 1991.
  • The increase in the CPI was led by higher prices for shelter and used vehicles. Food costs also contributed. Energy prices, which were a key driver of inflation through most of 2021, fell last month.
  • The data bolster expectations that the Fed will begin raising interest rates in March, a sharp policy adjustment from the timeline projected just a few months ago. High inflation has proven more stubborn and widespread than the central bank predicted amid unprecedented demand for goods along with capacity constraints related to the supply of both labor and materials.
  • Meanwhile, the unemployment rate has now fallen below 4%. Against this evolving backdrop, some Fed policy makers have said that it could be appropriate to begin shrinking the central bank’s balance sheet soon after raising rates.
  • “In terms of where the Fed is on their dual mandate — inflation and the labor market — they’re basically there,” Michael Gapen, chief U.S. economist at Barclays Plc, said on Bloomberg Television. “I don’t really think anything stops them going in March except one of these kind of outlier events. I think they’re ready.”


(Bloomberg)  U.S. Retail Sales Slide Most in 10 Months on Inflation, Omicron

  • U.S. retail sales slumped in December by the most in 10 months, suggesting the fastest inflation in decades is taking a greater toll on consumers just as the nation confronts more coronavirus infections.
  • The value of overall purchases decreased 1.9%, after a revised 0.2% gain a month earlier, Commerce Department figures showed Friday.
  • The median estimate in a Bloomberg survey called for a 0.1% drop in overall retail sales from the prior month.
  • The year-end slide in retail purchases sets up for a tepid handoff to the first quarter. Combined with the impact from the omicron variant, which is denting outlays for services such as travel and dining out, the figures help explain why economists project household spending to soften.
  • Furthermore, falling price-adjusted wages, dwindling savings and the end of the government’s pandemic-related financial programs suggest a more moderate pace of spending.
  • December, at the tail end of the holiday-shopping season, is traditionally a solid month for retail sales. However, concerns about shipping delays prompted many consumers to shop earlier than usual to ensure gifts arrived on time. Because the figures are adjusted for seasonal variations, the earlier shopping may have contributed to the weaker-than-expected figures.


(Bloomberg)  Fed’s Brainard Says Curbing Inflation Is ‘Most Important Task’

  • Federal Reserve Governor Lael Brainard said tackling inflation and getting it back down to 2% while sustaining an inclusive recovery is the U.S. central bank’s most pressing task.
  • “Inflation is too high, and working people around the country are concerned about how far their paychecks will go,” Brainard said in remarks prepared for a confirmation hearing before the Senate Banking Committee. “Our monetary policy is focused on getting inflation back down to 2% while sustaining a recovery that includes everyone. This is our most important task.”
  • Brainard was nominated by President Joe Biden to serve as Fed vice chair.
11 Jan 2022

2021 Q4 Investment Grade Quarterly

Investment grade corporate credit spreads finished the year little changed. For the full year 2021, the option adjusted spread (OAS) on the Bloomberg US Corporate Bond Index tightened by 4 basis points to 92 after having opened the year at an OAS of 96. The 4th quarter saw more movement, with the spread on the index moving wider, opening the quarter at 84 and closing at 92.

Treasuries finished the 4th quarter nearly unchanged. The 10yr Treasury opened the 4th quarter at 1.49% and closed at 1.51%. There was much more movement within the full year number with the benchmark 10yr opening 2021 at 0.91% and closing as high as 1.74% at the end of the first quarter before receding into the close of the second quarter and then trading higher from there, closing the full year 60 basis points higher at 1.51%.

The Corporate Index eked out a positive return during the fourth quarter, posting a total return of +0.23%. This compares to CAM’s net 4th quarter total return of -0.30%.

For the full year 2021, although spreads were slightly tighter, it was not enough to offset the move higher in interest rates. The Corporate Index posted a full year total return of -1.04%. This compares to CAM’s net full year total return of -1.38%.

Few Things Worked in 2021
Broadly speaking it was a tough year for investment grade credit. The Long portion (10+ years to maturity) of the US Corporate Index underperformed the Intermediate portion by 13 basis points on the back of higher Treasury rates. The “risk-on” trade has been in full effect since mid-2020 and that theme continued in 2021 with lower quality IG credit outperforming higher quality during 2021.

Recall that CAM has a structural underweight in Baa-credit and targets a ceiling of 30% exposure to this riskier segment of the market while the index is >50% Baa-rated. CAM also targets an A rating for its client portfolios
while the index is rated A3/Baa1.

As far as individual sectors go, there were a couple winners. At the sector level, only Energy and the Other Industrial sectors posted positive total returns on the year, of +1.39% and +0.88%, respectively. While Energy represented a major sector with a 7.72% index weighting, Other Industrial is quite small and represented just 0.48% of the Corporate Index. As far as individual industries were concerned, those industries under the Energy umbrella led the way with Independent Energy, Oil Field Services, Refining and Midstream posting total returns of +1.60%, +2.45%, +2.48% and +2.46%, respectively. The best performing individual industry was Airlines with a +4.48% total return.

The sectors that posted the biggest losses were Utilities, Technology and Consumer Noncyclical with returns of -2.15%, -1.98% and -1.30%, respectively. It may seem counterintuitive but while these industries are some of the most stable, high quality was not in favor during 2021 and instead risk taking ruled the day. Outside of the various utility sub-industries, the worst performing individual industries were Tobacco and Cable & Satellite with returns of -2.32% and -2.12%, respectively.

A Year of Little Change
2021 was one of the least volatile years for IG credit—the index OAS traded in a range of just 21 basis points. To find a less volatile year we have to go all the way back to 2006 when the range was just 12 basis points.

Ironically, the low volatility of 2006 continued well into 2007, just prior to the two most chaotic years in the history of investment grade credit. Please note that we do not expect a repeat performance of this in 2022 given the exogenous factors that were in play back in 2008-2009. In fact we predict quite the opposite, and our opinion is that 2022 will be a year of spread stability similar to 2021. There have been sustained periods of time in the history of our market where spreads have traded at levels beneath or near 100, and barring a geopolitical crisis or unexpected shock to the global economy, we see little reason that spreads should move meaningfully over the course of the next year. They may move wider or they may move tighter but we feel pretty comfortable pegging a spread of 100 +/- 20bps type of valuation target for the end of 2022.

Predicting fund flows is always a difficult but, even after $323.8 billion of inflows during 2021 into IG credit, making it the second largest year on record, we expect demand to remain positive going into 2022i. After such a strong performance for equities in 2021, pension funds will continue to look to rebalance and demand from institutional investors both domestic and foreign should remain strong. Additionally, IG credit will likely benefit from “flattish” gross new issuance supply and most Wall Street prognosticators are predicting substantially less net new issue supply as the amount of debt that matures in 2022 is larger than what we have experienced in recent years. Less supply of new bonds creates a more supportive environment for credit spreads in the secondary market and for the market as a whole. One factor that could make a difference at the margin is the amount of high yield debt that is upgraded to investment grade during the course of the year. Current expectations are calling for a robust upgrade cycle in 2022 and these companies will often issue new debt when they achieve investment grade status. Past experience tells us that much of this debt ends up being “leverage neutral” as lower interest rate investment grade debt is used to retire higher interest rate legacy high yield debt. However, the debt is still net new for the investment grade market since these companies were previously part of the high yield market. If we experience even more upgrades than the upper limit of the rosiest predictions then that could make for higher new issue supply numbers within the IG market.

In our view, the biggest potential driver of benign spread volatility during 2022 is that the economy is likely to continue to grow at above average levels and that the typical investment grade company is in good health from a balance sheet perspective. The median real GDP forecast is predicting growth of +3.9% in 2022 which is solidly above trendii. Companies are still sitting on elevated cash balances but as we have written about in past commentaries this will not last forever. As we move into 2022, it becomes increasingly likely that this cash will start being deployed for shareholder returns and M&A will move to the forefront. 2022 is shaping up to be much more of a credit pickers market instead of a market that generically rewards all risk-taking.

The Return of Dispersion

We have seen erosion in the quality of the investment grade universe, especially over the course of the last dozen years. That data set below is representative of just the past 10 years but the trend really started to manifest itself at the end of 2008, when the Corporate Index was just 33.15% Baa-rated compared to today when it is north of 50%.

Since 2008, the proportion of Baa-rated credit has crept higher with each passing year. There is some noise in these numbers, given the wave of downgrades from investment grade to high yield that occurred in 2020 and that is precisely why the percentage of Baa-rated debt decreased from 2019-2020 –those companies exited the investment grade universe entirely and joined the high yield universe. So the IG universe increased its quality by subtraction, not by improving its credit metrics. Many of these companies that were downgraded to junk have since repaired their balance sheets and some will earn upgrades and will be returning to investment grade in 2022, boosting the number of lower rated IG companies by the end of the year. Additionally, there are a relatively large number of rising stars within the high yield ranks currently that were not previously rated IG, many of which will be earning upgrades throughout the year. Taking it altogether, there is a good chance that year end 2022 will mark a new high for the proportion of Baa-rated credit within the Corporate Bond Index.

The purpose of this example is not to show that all Baa-risk is bad, because that is not the case. Consistently, the worst performers in IG credit are those companies that move from Aa or A rated down to Baa. On the other hand, some of the best performing credits are those companies that are currently high yield or split rated (half high yield, half investment grade) with the potential to improve their credit metrics and earn a full investment grade rating. We believe that 2022 will offer opportunity, both in the form of identifying such companies and by avoiding those weakly positioned A-rated credits that will join the ranks of the growing Baa-rated cohort. This is one of the reasons that you will see us occasionally invest in companies with just one IG rating and up to 1 or 2 HY ratings. It is usually because we expect the company to become fully IG-rated and we want to take advantage of associated spread compression for our clients. We also do not hamper ourselves with “automatic sale” rules in the event that a current portfolio holding loses IG ratings by getting downgraded to HY. Instead we will rely on our credit research to determine if it makes sense to continue to hold the bonds of a downgraded company and if it has a chance to regain IG status over our investment time horizon. The Baa-universe is chock full companies with bonds that trade at unattractive valuations from a risk reward standpoint. We are looking to provide our clients with a return that is equal to or greater than the Corporate Index but we want to do so by incurring less volatility –hence our structural underweight of Baa-rated credit versus the index. At the end of the day the only way an investor can identify these opportunities is by blocking and tackling and good old fashioned credit work which is one of the cornerstones of our investment grade program and but one of the ways we will look to add value for our clients in the year ahead.

The Federal Reserve & The “I” Word

At its November meeting, the Fed signaled its intent to complete the tapering of its asset purchases by the end of June. However, the landscape had changed by the time the December 15 meeting came around, and in a move to combat rising inflation, the Fed accelerated its tapering timeline. The Fed now expects to finish its taper by the end of March which would create the potential for a Fed Funds rate hike as soon as its March 16 2022 meetingiii. With the end of tapering occurring in the near term, it will be quite interesting to hear the Fed’s plans for the central bank’s $8.76 trillion asset portfolio. Discussions are ongoing and will continue at the January 2022 FOMC meeting but Chairman Powell and other Fed officials have hinted that shrinking the asset portfolio could be another arrow in the quiver that it may use to rein in inflationiv. It could be that the Fed elects to play it very slow with increases in the Fed Funds Rate, instead relying on balance sheet reduction to slow the economy and cool inflation toward its long term target level of 2%. The Fed believes that inflation will slow in the second half of 2022 and this is in line with the consensus view of most economists. In short, we believe the Fed will use all the tools at its disposal to make this a reality even if it means they must use some measures to slow economic growth.

Wrap It Up
2022 is poised to be an interesting year for the credit markets. Although we don’t expect wild swings in the level of credit spreads there could be some pockets of rate-driven volatility at times throughout the year as the Fed embarks on its first tightening cycle since 2018. Inflation will remain at the forefront and time will tell if those pressures ease in the second half of the year. The pandemic enters its third year and geopolitical uncertainty looms as it pertains to Russian and the Ukraine, both of which could impact risk assets or spark a flight to quality. The case for Investment Grade as an asset class today is for its downside protection, diversification and income generation. The time will come when total returns move back to the forefront but it is hard to make an argument for more than coupon-like returns in the current environment. Investors with strategic goals and medium to long time horizons have recognized the benefits of a permanent allocation to IG credit.

We wish you a happy and healthy 2022. We will be doing our best to navigate the credit markets in a successful manner and we appreciate the trust you have placed in us as a manager of your hard earned capital. As always, thank you for your business and please do not hesitate to reach out to us with any questions or comments.

i Wells Fargo Securities, January 3 2022 “Credit Flows | Special FY 2021 Edition”
ii Bloomberg, January 3 2022 “US GDP Economic Forecast Real GDP (YoY%) (78 responses)
iii Federal Reserve Open Market Committee, December 15 2021 “Statement Release”
iv The Wall Street Journal, January 4 2022 “Fed Weights Proposals for Eventual Reduction in Bond Holding”

This information is intended solely to report on investment strategies identified by Cincinnati Asset Management. Opinions and estimates offered constitute our judgment and are subject to change without notice, as are statements of financial market trends, which are based on current market conditions. This material is not intended as an offer or solicitation to buy, hold or sell any financial instrument. Fixed income securities may be sensitive to prevailing interest rates. When rates rise the value generally declines. Past performance is not a guarantee of future results. Gross of advisory fee performance does not reflect the deduction of investment advisory fees. Our advisory fees are disclosed in Form ADV Part 2A. Accounts managed through brokerage firm programs usually will include additional fees. Returns are calculated monthly in U.S. dollars and include reinvestment of dividends and interest. The index is unmanaged and does not take into account fees, expenses, and transaction costs. It is shown for comparative purposes and is based on information generally available to the public from sources believed to be reliable. No representation is made to its accuracy or completeness.

11 Jan 2022

2021 Q4 High Yield Quarterly

In the fourth quarter of 2021, the Bloomberg Barclays US Corporate High Yield Index (“Index”) return was 0.71% bringing the year to date (“YTD”) return to 5.28%. The CAM High Yield Composite net of fees total return was 0.45% bringing the YTD net of fees return to 4.03%. The S&P 500 stock index return was 11.02% (including dividends reinvested) for Q4, and the YTD return stands at 28.68%.

The 10 year US Treasury rate (“10 year”) was mostly range bound finishing at 1.51%, up 0.02% from the beginning of the quarter. Over the period, the Index option adjusted spread (“OAS”) tightened 6 basis points moving from 289 basis points to 283 basis points. The top two quality segments of the High Yield Market participated in the spread tightening as BB rated securities tightened 9 basis points and B rated securities tightened 14 basis points, while the CCC rated securities widened 25 basis points. Take a look at the chart below from Bloomberg to see a visual of the spread moves in the Index over the past five years. The graph illustrates the speed of the spread move in both directions during 2020 and the continuation of lower spreads in the first half of 2021. The OAS record low (not shown) is 233 basis points set back in 2007.

The Energy, Other Industrial, and Finance Companies sectors were the best performers during the quarter, posting returns of 1.56%, 1.38%, and 1.23%, respectively. On the other hand, Communications, Banking, and REITs were the worst performing sectors, posting returns of -0.24%, 0.05%, and 0.27%, respectively. Clearly the market was strong as only one sector posted a negative return in the period. At the industry level, auto, midstream, life insurance, and independent energy all posted the best returns. The auto industry posted the highest return 2.17%. The lowest performing industries during the quarter were cable, media, wirelines, and retailers. The cable industry posted the lowest return -0.66%.

The energy sector performance has continued to remain strong. Crude oil had a $20 per barrel range in Q4 and averaged $77 per barrel. Meanwhile, the natural gas market moved lower throughout the quarter coming down off highs not seen in three years. OPEC+ recently had a meeting and decided to further raise production levels.i The group has “restarted about two-thirds of the production they halted in 2020, and are seeking to drip-feed the remainder at a pace that will satisfy the recovery in fuel consumption — and stave off any inflationary price spike — without sending the market into a new slump. So far they’ve succeeded, with international crude prices trading near $78 a barrel.” OPEC has also chosen a new Secretary General that will take over in August as the group’s public face. The outgoing Secretary General will step down after completing a full term as permitted by governing rules.

During the fourth quarter, the high yield primary market continued at a strong pace posting $84.3 billion in issuance and making 2021 a record year. After two very active years for issuance, 2022 is likely to take a breather but the expectation is still in the ballpark of $400 billion. The issuance in Consumer Discretionary continued to be very strong with approximately 19% of the total during the quarter. Second place was broad based as Communications, Energy, and Financials each made up 14% of the total new paper placed in the market.

The Federal Reserve maintained the Target Rate to an upper bound of 0.25% at both the meetings in November and December. The chart to the left shows the updated Fed dot plot post the December meeting. Of note, the Fed median Target Rate for 2022 increased from 0.25 to 0.875, and the median increased for 2023 from 1.00 to 1.625. Additionally, at the December meeting the Fed agreed to accelerate the taper pace of their asset purchases. The change in the taper pace sets in place a plan for the program to end in March of 2022. The Fed has previously spoken of the desire to end the taper before starting Target Rate hikes. These moves are being driven by a tight employment market and inflation that is running higher than any point in the last 30 years. “There’s a real risk now, I believe, that inflation may be more persistent and…the risk of higher inflation becoming entrenched has increased,” said Mr. Powell at a news conference after the December meeting.

“That’s part of the reason behind our move today, is to put ourselves in a position to be able to deal with that risk.”ii

Intermediate Treasuries increased 2 basis points over the quarter, as the 10-year Treasury yield was at 1.49% on September 30th, and 1.51% at the end of the fourth quarter. The 5-year Treasury increased 29 basis points over the quarter, moving from 0.97% on September 30th, to 1.26% at the end of the fourth quarter. Intermediate term yields more often reflect GDP and expectations for future economic growth and inflation rather than actions taken by the FOMC to adjust the Target Rate. The revised third quarter GDP print was 2.3% (quarter over quarter annualized rate). Looking forward, the current consensus view of economists suggests a GDP for 2022 around 3.9% with inflation expectations around 3.5%.iii

Being a more conservative asset manager, Cincinnati Asset Management Inc. does not buy CCC and lower rated securities. This policy generally served our clients well in 2020. However, the lowest rated segment of the market outperformed during 2021. Thus, our higher quality orientation was not optimal for the year. As a result and noted above, our High Yield Composite net of fees total return did underperform the Index YTD. Our Composite also underperformed over the fourth quarter measurement period. A sizeable contributor was the Index strong performance in the under one year and over ten year duration buckets. These are both areas that our strategy tends not to participate in any meaningful way. Further, with the market staying strong during the fourth quarter, our cash position remained a drag on overall performance. Outside of that, credit selection drove much of the story in Q4. The downside was driven by selections in the energy sector and retailer industry, while the top positive offsets were found within the homebuilders and wireline industries.

The Bloomberg Barclays US Corporate High Yield Index ended the fourth quarter with a yield of 4.21%. The market yield is an average that is barbelled by the CCC rated cohort yielding 6.82% and a BB rated slice yielding 3.30%. Equity volatility, as measured by the Chicago Board Options Exchange Volatility Index (“VIX”), had an average of 19 over the quarter with a spike to a high of 35 as the market was coming to grips with the omicron variant. For context, the average was 15 over the course of 2019 and 29 for 2020. The fourth quarter had one bond issuer default on their debt. The trailing twelve month default rate fell to 0.27%.iv The current default rate is relative to the 6.17%, 4.80%, 1.63%, 0.92% default rates from the previous four quarter end data points listed oldest to most recent. Pre-Covid, fundamentals of high yield companies had been mostly good and in the aggregate fundamentals are back to those pre-covid levels. From a technical view, fund flows were roughly flat in October, negative in November, and positive in December. The 2021 year-end outflow stands at $4.8 billion.v In spite of this outflow, a strong bid remains in the market for high yield paper, and the declining default rate is keeping a risk on attitude in place for market participants. We are of the belief that for clients that have an investment horizon over a complete market cycle, high yield deserves to be considered as part of the portfolio allocation.

Covid, then delta, now omicron….the hits just keep on coming. All things considered, the market did very well this year. This is no doubt in part due to Congress and the Fed supplying trillions of dollars of support in response to the pandemic. November was indeed a tough month as market participants dealt with news of an emerging new variant. Many naturally sensed a buying opportunity as December was quite strong posting the best monthly return for the year. Participants surely understood that we are no longer in March 2020 operating largely in the dark and full of uncertainty. Uncertainty will always be a factor in the equation, but today we are much better prepared to deal with the ongoing pandemic. The vaccine has been rolled out and according to the CDC, 86% of the US population ages 18+ has received at least one shot. We now have boosters and emergency use pills approved. As cases continue to climb, signs point to much less severe outcomes.vi Additionally, companies are generally in good financial shape. As a country, we are currently in a place where the economy is booming and inflation is escalated. That is the backdrop as we move into 2022. Clearly, it is important that we exercise discipline and selectivity in our credit choices moving forward. We are very much on the lookout for any pitfalls as well as opportunities for our clients. We will continue to carefully monitor the market to evaluate that the given compensation for the perceived level of risk remains appropriate on a security by security basis. As always, we will continue our search for value and adjust positions as we uncover compelling situations. Finally, we are very grateful for the trust placed in our team to manage your capital.

This information is intended solely to report on investment strategies identified by Cincinnati Asset Management. Opinions and estimates offered constitute our judgment and are subject to change without notice, as are statements of financial market trends, which are based on current market conditions. This material is not intended as an offer or solicitation to buy, hold or sell any financial instrument. Fixed income securities may be sensitive to prevailing interest rates. When rates rise the value generally declines. Past performance is not a guarantee of future results. Gross of advisory fee performance does not reflect the deduction of investment advisory fees. Our advisory fees are disclosed in Form ADV Part 2A. Accounts managed through brokerage firm programs usually will include additional fees. Returns are calculated monthly in U.S. dollars and include reinvestment of dividends and interest. The index is unmanaged and does not take into account fees, expenses, and transaction costs. It is shown for comparative purposes and is based on information generally available to the public from sources believed to be reliable. No representation is made to its accuracy or completeness.

i Bloomberg January 4, 2022: OPEC+ Agrees to Revive More Output
ii The Wall Street Journal December 15, 2021: Fed Officials Project Three Interest Rate Rises in 2022
iii Bloomberg January 4, 2022: Economic Forecasts (ECFC)
iv JP Morgan January 3,, 2022: “Default Monitor”
v Wells Fargo January 3, 2022: “Credit Flows”
vi Bloomberg January 4, 2022: Omicron Spares US ICUs So Far, Mirroring S. Africa Trajectory

10 Dec 2021

CAM Investment Grade Weekly Insights

Spreads will finish the week tighter, reclaiming some ground after having experienced headwinds in the week prior which saw the index close two days at 101 –its widest level of 2021.  The OAS on the Bloomberg US Corporate Bond Index closed at 96 on Thursday, December 9, after having closed the week prior at 100.  Treasury volatility has been a common theme in recent weeks and this week was no exception.  The 10yr Treasury is 1.47% on Friday morning after having closed last week at 1.34%.  Through Thursday, the Corporate Index had posted a year-to-date total return of -1.26% and an excess return over the same time period of +1.25%.  The Federal Reserve is currently within its blackout period as the market patiently awaits the next FOMC decision on Wednesday of next week.


The primary market was active this week with Merck leading all issuers with an outsize $8bln print.  In all, over $38bln in new debt was brought to market during the week.  This month can be seasonally slow but that has not been the case this year with a record breaking amount of new issuance during the month of December ($61.7bln) which is impressive to be sure given we are not yet half  way through the month. According to data compiled by Bloomberg, $1,411bln of new debt has been issued year-to-date.  2021 has firmly secured its place in history as the 2nd busiest year for issuance on record but it still trails 2020’s record breaking volume by almost 20%.  Issuance consensus estimates for next week are calling for only $5bln but we are skeptical and would not be surprised if Monday and Tuesday bring some activity.  Wednesday is likely to be very quiet with the FOMC on the tape.

Per data compiled by Wells Fargo, flows into investment grade credit for the week of December 2–8 were +$0.885bln which brings the year-to-date total to +$321bln.

10 Dec 2021

CAM High Yield Weekly Insights

Fund Flows & Issuance:  According to a Wells Fargo report, flows week to date were $0.2 billion and year to date flows stand at -$6.2 billion.  New issuance for the week was $5.2 billion and year to date issuance is at $459.9 billion.

 (Bloomberg)  High Yield Market Highlights

  •  The recent selloff in the U.S. junk-bond market looks like the distant past as the index is now poised to post gains for the second consecutive week, and potentially the biggest gains in more than three months.
  • The riskiest segment of the junk bond market, CCCs, are also on track to close the week with the highest returns since the end of August and are likely to be the best-performing asset class in the U.S. fixed-income market.
  • Returns on the broader junk-bond index week-to-date stood at 0.67% and CCC gains at 0.8%.
  • As investors rush back to the asset, U.S. high-yield funds saw an inflow for the week after outflows the two previous weeks.
  • “The late November weakness in risk assets has come and gone, with sentiment reversing completely in December,” Barclays strategist Brad Rogoff wrote on Friday.
  • In corporate cash markets, the high-yield to investment-grade spread has shrunk after the recent decompression, Barclays wrote in the note.
  • The primary market was steady pricing deals to take the week’s tally to more than $5b.
  • The broader junk bond yields rose 6bps to close at 4.46% but will end the week lower for the second time this month.
  • The Single B index may see the biggest weekly gains in 12 months, with week-to-date returns of 0.72%.
  • CCC yields closed at 7.06% and may end the week lower to see the biggest weekly drop in more than three months.


  (Wall Street Journal)  U.S. Jobless Claims Fall to Lowest Level in 52 Years

  • Worker filings for unemployment benefits hit the lowest level in more than half a century last week as a tight labor market keeps layoffs low.
  • Initial jobless claims, a proxy for layoffs, fell to 184,000 in the week ended Dec. 4, the lowest level since September 1969, the Labor Department said Thursday. That was close to a recent record total of 194,000 recorded in late November.
  • The prior week’s level was revised up to 227,000. The four-week moving average, which smooths out weekly volatility, fell to 218,750.
  • Unemployment claims have been steadily falling all year as the labor market has tightened. They have now fallen below where they were before the pandemic caused layoffs to surge in March 2020. Claims averaged 218,000 in 2019, the year before the pandemic hit the U.S.
  • Economists say seasonal volatility around the holiday season may have contributed to last week’s low number.
  • The decline in new claims is an indication that employers are reluctant to lay off workers as jobs are plentiful, consumer demand is high and the pool of prospective workers remains lower than before the pandemic.
  • “We expect claims will start to more consistently hover around pre-Covid averages of 220,000 or perhaps slightly lower given current tight labor market conditions,” said Nancy Vanden Houten, lead economist at Oxford Economics.
  • More unemployed workers should eventually get new jobs as they exhaust their benefits, she added.
  • The unemployment rate fell to 4.2% in November from 4.6% in October, the Labor Department reported Friday. The share of people ages 25 to 54 who are either working or looking for work rose to 82.1% from 81.9%, a sign that prime-age Americans are starting to get back into the labor force. But the labor-force participation rate for that age group remains below where it was in February 2020, when it stood at 83.1%.
  • “The overriding dynamic in the job market of late has been this shortage of workers,” said Mark Hamrick, senior economic analyst at Bankrate. “The issue of fresh job loss has not been key for many months now.”