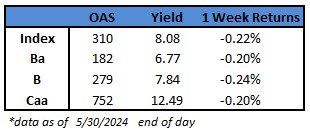
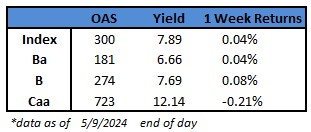
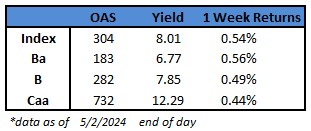
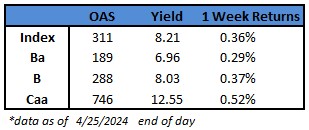
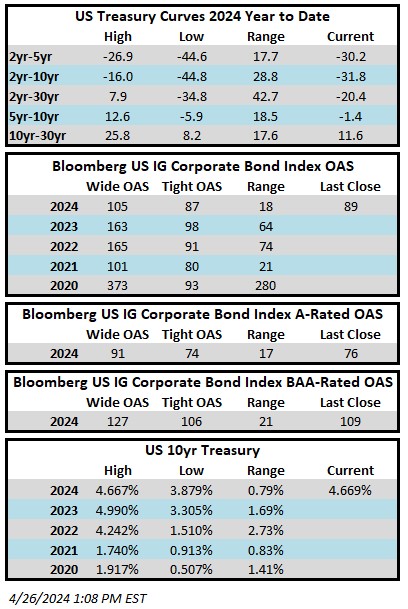
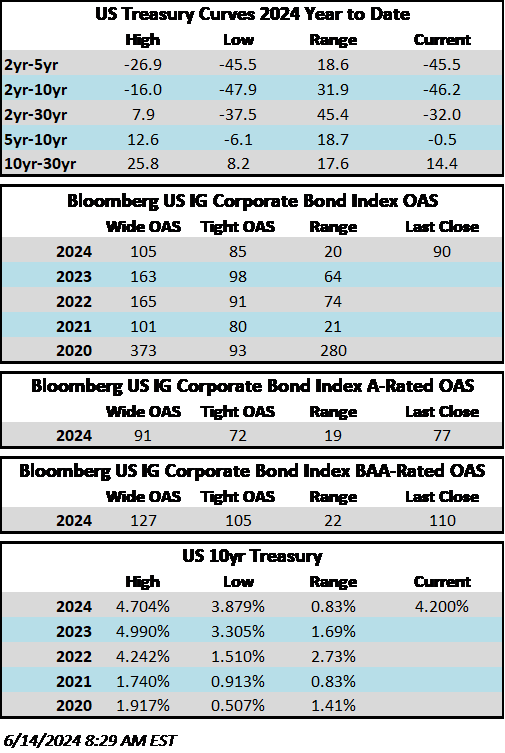
Category: Insight

12 Aug 2022

CAM High Yield Weekly Insights

Fund Flows & Issuance:  According to a Wells Fargo report, flows week to date were $0.9 billion and year to date flows stand at -$44.8 billion.  New issuance for the week was $3.5 billion and year to date issuance is at $74.7 billion.


(Bloomberg)  High Yield Market Highlights

  • U.S. junk bonds are headed toward the sixth straight week of gains after steadily climbing in three of the last four sessions as yields plunge to a new two-month low of 7.44%. The six-week gain would be the longest winning streak in more than 18 months.  Yields are also on track to drop for the sixth consecutive week, the longest declining stretch in two years.
  • The rally gained legs after strong jobs data last Friday and lower-than-expected consumer price index earlier this week eased fears of an imminent recession amid expectations that the Federal Reserve will slow down the rate-hike campaign from the aggressive 75bps hike in the last meeting.
  • The market appears to be discounting negative news and focusing on the positives, Brad Rogoff and Dominique Toublan at Barclays Capital wrote on Friday.
  • The gains extended across the high-yield market, with CCCs, the riskiest part of the junk bond market, poised to gain for the fourth successive week, the longest gaining streak in more than eight months. The week-to-date gains were at 1.59%, the best performing asset in the high-yield market.
  • The total returns for BBs week-to-date were 0.49% and single Bs were at 1.08%.
  • BB yields dropped below 6% to 5.99% and single B yields fell to a 10-week low of 7.64%.
  • The rally was also partly due to technical factor, with inflows into junk bond funds looking to put money to work and a lack of supply.


(Bloomberg)  US Inflation Runs Cooler Than Forecast, Easing Pressure on Fed

  • U.S. inflation decelerated in July by more than expected, reflecting lower energy prices, which may take some pressure off the Federal Reserve to continue aggressively hiking interest rates.
  • The consumer price index increased 8.5% from a year earlier, cooling from the 9.1% June advance that was the largest in four decades, Labor Department data showed Wednesday. Prices were unchanged from the prior month. A decline in gasoline offset increases in food and shelter costs.
  • So-called core CPI, which strips out the more volatile food and energy components, rose 0.3% from June and 5.9% from a year ago. The core and overall measures came in below forecast.
  • The data may give the Fed some breathing room, and the cooling in gas prices, as well as used cars, offers respite to consumers. But annual inflation remains high at more than 8% and food costs continue to rise, providing little relief for President Joe Biden and the Democrats ahead of midterm elections.
  • While a drop in gasoline prices is good news for Americans, their cost of living is still painfully high, forcing many to load up on credit cards and drain savings. After data last week showed still-robust labor demand and firmer wage growth, a further deceleration in inflation could take some of the urgency off the Fed to extend outsize interest-rate hikes.
  • Fed officials have said they want to see months of evidence that prices are cooling, especially in the core gauge. They’ll have another round of monthly CPI and jobs reports before their next policy meeting on Sept. 20-21.
  • Gasoline prices fell 7.7% in July, the most since April 2020, after rising 11.2% a month earlier. Utility prices fell 3.6% from June, the most since May 2009.
  • Food costs, however, climbed 10.9% from a year ago, the most since 1979. Used car prices decreased.

Shelter costs — which are the biggest services’ component and make up about a third of the overall CPI index — rose 0.5% from June and 5.7% from last year, the most since 1991. That reflected a 0.7% jump in rent of primary of residence.

05 Aug 2022

CAM High Yield Weekly Insights

Fund Flows & Issuance:  According to a Wells Fargo report, flows week to date were $3.3 billion and year to date flows stand at -$45.8 billion.  New issuance for the week was nil and year to date issuance is at $71.2 billion.

(Bloomberg)  High Yield Market Highlights

  • The U.S. junk bond market is headed for the fifth week of gains after steadily edging higher for seven consecutive sessions, extending the July rally after a report eased concerns of an economic slowdown. This would be the longest gaining streak since December.  The week-long US junk-bond rally spurred telecom company Charter Communications to sell new bonds to bring some life back into the dormant primary market.
  • Charter Communications rushed in to take advantage of the risk- on mood to sell bonds to fund a stock buyback, among other things. Investors, hungry for new bonds in an issuance-starved market, flooded it with orders for more than $4b for a $1b offering.
  • The bonds priced at 6.375%, the lower end of talk. Bankers, led by Morgan Stanley, increased the size of the bond sale by $500m to $1.5b.
  • The broader U.S. junk bond rally was due to a combination of factors.
  • One, easing concerns about fears of an imminent recession following economic data earlier this week. S&P Global Ratings’ US chief economist Beth Ann Bovino echoed this sentiment and wrote that while macro economic conditions deteriorated or slowed down, there were no signs of an imminent recession yet.
  • Two, investors have given their vote of confidence to the asset class as they flood US junk bonds with new cash. US high-yield funds saw an influx of over $3b for week.
  • Three, the rally comes amid expectations that after perhaps another 75bps increase in the benchmark interest rate, the Federal Reserve will slow down the aggressive campaign of hiking rates while still curbing inflation and not causing a deep recession.
  • U.S. junk bonds posted gains of 0.36% on Thursday and are on track to rally for the fifth straight week, with gains of 0.87% week-to- date.
  • Yields dropped to a new eight-week low of 7.55% and spreads at +441.
  • The gains spanned across all high-yield ratings, with CCCs posting gains of 0.65% on Thursday and is poised to be the best asset class for the week, with week-to-date returns of 1.72%.


(Bloomberg)  What Recession?

  • The U.S. junk bond market is forecasting that the economy may weaken, but won’t tip into a recession.
  • It comes as Federal Reserve officials vow to continue to fight inflation aggressively, even if higher rates increase the risk of recession. And some strategists and money managers think credit markets aren’t paying enough attention to how bad the potential upcoming downturn could be.
  • But for now, investors are voting with their dollars. High-yield bonds gained 5.9% in July, their biggest one-month rally in a decade, and also rose in the first three days of August, according to Bloomberg index data.
  • Risk premiums for the bonds stand at levels not usually associated with recessions. Stocks, junk bonds, and other risk markets rallied in the second half of July as investors grew more hopeful that signs of slowing growth would translate to the Fed easing up on its plans to tighten the money supply. A JPMorgan Chase model said this week that equity, credit and rates markets are together assigning a 40% probability to recession, down from 50% in June.
  • Signs of slowing growth are coming from multiple areas. Walmart last week said shoppers are avoiding big-ticket items and focusing instead on buying groceries. AT&T said some customers are delaying paying bills. Pending home sales fell in June by the most since April 2020, according to a report last week.
  • In markets, the 10-year Treasury yield was 38 basis points below the 2-year on Aug. 3, the most inverted since August 2000. Persistent inversions can signal a recession is coming. Commodities prices have broadly been falling this month, too.
  • Riskier parts of the credit spectrum are also showing some concern. CCC rated bonds, among the lowest-rated corporates, gained 4.95% in July, while BB securities, the top tier of high yield, rose 6.1% on a total return basis.
  • But it’s not clear if these signs of trouble will translate to a serious downturn.
  • “The high-yield market is definitely pricing in some level of stress, but it’s pricing in nowhere near recession-type levels,” Citigroup strategist Michael Anderson said in a phone interview.
  • Between December 1996 and December 2021, there were 28 months when the economy was in recession, according to an analysis by Martin Fridson, chief investment officer at Lehmann Livian Fridson Advisors. The median junk-bond spread during those months was about 835 basis points, or 8.35 percentage points, based on ICE BofA indexes. That spread is currently closer to 454 basis points on August 3, around the median level for non-recession months, according to his analysis.
05 Aug 2022

CAM Investment Grade Weekly Insights

Investment grade credit performance was mixed again this week.  It looked like spreads would finish the week better bid but then the monthly payroll report hit on Friday morning.  Things are volatile as we go to print so it is merely a guess but we could finish the week somewhere in the neighborhood of unchanged to modestly wider amid a risk off tone on the back of payrolls.  The Bloomberg US Corporate Bond Index closed at 141 on Thursday August 4 after having closed the week prior at 144.  The 10yr Treasury has been all over the map this week.  The 10yr closed last week at 2.65%, closed Monday of this week at 2.57% and is now up at 2.84% mid-Friday morning.  Fed speakers spent much of this week reinforcing their hawkish views and commitment to tame inflation and then a strong jobs report fueled a 14 basis point sell-off in 10s this morning.  Front-end rates are getting hit even harder with the 2-year Treasury up nearly 18 basis points as we go to print.  The short and intermediate portions of the Treasury curve are now more inverted than they have been at any point in this cycle. Through Thursday the Corporate Index had a negative YTD total return of -11.35% while the YTD S&P500 Index return was -12.11% and the Nasdaq Composite Index return was -18.88%.

Primary issuance was big this week with $56bln in new debt brought to market which exceeded even the highest of expectations.  There was issuance from high quality household names such as Apple and Intel and Meta Platforms (fka Facebook) printed its inaugural bond deal of $10bln.  Street estimates are looking for $20-25bln in issuance next week.  There has been $859bln of new issuance YTD which trails 2021’s pace by 5% according to data compiled by Bloomberg.

Investment grade credit saw its highest weekly inflow in almost a year.  Per data compiled by Wells Fargo, inflows for the week of July 28–August 3 were +$6.5bln which brings the year-to-date total to -$119.9bln.

29 Jul 2022

CAM High Yield Weekly Insights

Fund Flows & Issuance:  According to a Wells Fargo report, flows week to date were $4.4 billion and year to date flows stand at -$49.1 billion.  New issuance for the week was $0.7 billion and year to date issuance is at $71.2 billion.


(Bloomberg)  High Yield Market Highlights

  • U.S. junk bonds are headed toward the biggest monthly gains in more than a decade as the July rebound solidified after Chair Jerome Powell signaled that rate hikes would slow at some point and policy wasn’t pre-determined. The month-to-date return was 5.11%, the biggest since October 2011. Yields tumbled 98bps to close at a seven-week low of 7.91%, the first monthly drop in 2022.
  • The U.S. high yield market shrugged off the 75bps increase in the benchmark US interest rate for the second straight month, and the warning by the central bank that “another unusually large increase could be appropriate at our next meeting, that is a decision that will depend on the data”.
  • The riskiest segment of the junk bond market, CCCs, is poised for the biggest monthly advance since November 2020, with gains of 3.96% month-to- date.
  • CCC yields plunged 75bps month-to-date to fall below 13% and close at 12.88%, the biggest monthly drop since December 2020 and also the first monthly decline in 2022.
  • U.S. high yield investors flooded the asset class as the junk bonds reported a cash inflow of over $4 billion for the week. It was the biggest weekly intake since June 2020.
  • The market appeared to interpret Chair Powell’s press conference as “dovish,” with futures pricing in a lower terminal rate than even the Fed’s own projections, Barclays strategists Brad Rogoff and Dominique Toublan wrote on Friday.
  • Amid continuing macro uncertainty, the primary market has ground a near halt. The market priced a mere $1.8b, the slowest July since at least 2006.
  • Year-to-date supply stood at almost $70b, the lowest since 2008.


(Bloomberg)  Powell Signals More Hikes Coming, While Markets Detect Pivot

  • Chair Jerome Powell said the Federal Reserve will press on with the steepest tightening of monetary policy in a generation to curb surging inflation, while handing officials more flexibility on coming moves amid signs of a broadening economic slowdown.
  • Policy makers again raised the benchmark US interest rate 75 basis points on Wednesday to a range of 2.25% to 2.5% and said they anticipate “ongoing increases” will be appropriate.
  • Just how much depends on how the economy performs, the central bank chief said. He stepped away from the specific guidance on the size of upcoming hikes he previously gave, though he didn’t take another jumbo move off the table.
  • “While another unusually large increase could be appropriate at our next meeting, that is a decision that will depend on the data,” Powell said. “The labor market is extremely tight, and inflation is much too high.”
  • Despite the whatever-it-takes message, markets staged a powerful rally with the S&P 500 stock index rising 2.6%, keying off Powell’s remarks that the pace of rate increases would slow at some point and that policy won’t be pre-determined.
  • But Powell didn’t flag a pivot to lower rates or even a pause, according to Fed watchers, who argued there was a disconnect between what the central banker said and how markets responded.
  • “We heard plenty of hawkish signals, including refusal to even contemplate that we are in a recession with strong job market gains and many references that restoring price stability is being prioritized over sidestepping a recession,” said Jonathan Millar, an economist with Barclays Plc. “Powell does not seem to be ruling out 100 or 75 basis-point hikes in September — it’s data dependent.”
  • Central bankers are trying to tame the highest inflation in 40 years. Although the latest shift toward a more real-time approach to policy, Powell is trying to convey that the Fed will keep pushing borrowing costs higher as long as prices continue to jump too fast for comfort.
  • Interest-rate markets are pricing a more benign hiking cycle than the Fed’s own June forecasts, which Powell pointedly said was the best current guide to the where officials see policy heading.
  • Investors are betting that rates will peak around 3.3% this year before the Fed starts cutting modestly in 2023. Officials in June projected rates at 3.4% at year-end and 3.8% in December 2023.
  • “By referencing the June Summary of Economic Projections he is not validating market pricing,” said Bloomberg’s chief U.S. economist Anna Wong. “The Fed is nowhere close to declaring victory over inflation.”
  • In the post-meeting press conference, Powell was clear about the committee’s bias. “Restoring price stability is just something that we have to do,” he told reporters.
  • “We do see that there are two-sided risks,” he said. “There would be the risk of doing too much and imposing more of a downturn on the economy than was necessary, but the risk of doing too little and leaving the economy with this entrenched inflation — it only raises the cost.”
  • He said it wasn’t the committee’s intention to tip the economy into a recession, while noting that to achieve their 2% inflation goal slack would have to increase. That means unemployment would have to rise somewhat, while the economy would have to slow to below its full potential.
29 Jul 2022

CAM Investment Grade Weekly Insights

Investment grade credit performance was mixed this week and it looks as though spreads will finish a basis point or two wider.  The Bloomberg US Corporate Bond Index closed at 146 on Thursday July 28 after having closed the week prior at 144.  The market is better bid as we go to print this Friday morning.  The 10yr Treasury is yielding 2.69% after having closed the week prior at 2.75%.  Economic data was varied throughout the week and it flowed through to Treasury curves in the form of volatility.  The FOMC delivered a 75bps rate hike on Wednesday, in line with expectations.  On Thursday, we got an exceptionally weak GDP print relative to expectations.  The economy shrank for a second straight quarter but most economists were hesitant to call it a full blow recession and instead the preference at this point is to refer to it as a slowing of economic activity.  On Friday the data was more supportive of the economy but less supportive of the Fed and its quest to tame inflation.  The Labor Department’s employment cost index and the Commerce Department’s personal consumption price index both posted increases that were larger than forecasts.  Through Thursday the Corporate Index had a negative YTD total return of -11.80% while the YTD S&P500 Index return was -13.81% and the Nasdaq Composite Index return was -21.92%.

The primary market saw $18.6bln of issuance this week which was on the screws relative to the $15-20bln estimate.  The pace of issuance should see a slight acceleration next week so long as the market remains receptive.  Street estimates are looking for $25-30bln in issuance which would be considered a fairly brisk week for early August.  Expectations for supply during August are in the $70-$80bln range relative to 2021 which saw $86bln in issuance.  There has been $803bln of new issuance YTD which trails 2021’s pace by 7% according to data compiled by Bloomberg.

Investment grade credit saw an inflow this week, breaking a 21-week streak of outflows.  Per data compiled by Wells Fargo, outflows for the week of July 21–27 were +$0.7bln which brings the year-to-date total to -$126.4bln.

22 Jul 2022

CAM High Yield Weekly Insights

Fund Flows & Issuance:  According to a Wells Fargo report, flows week to date were -$0.4 billion and year to date flows stand at -$53.5 billion.  New issuance for the week was $0.7 billion and year to date issuance is at $70.4 billion.


(Bloomberg)  High Yield Market Highlights

  • US junk bonds are headed toward the biggest weekly gains in almost two months, with a 1.97% return, after a steady five-day rally on broad expectations that the Federal Reserve will ease its rate-hike campaign after a potential 75bps-100bps hike in the next meeting. This would be the third straight week of gains and the longest streak since December. The rally enabled CCCs, the lowest tier of the junk bond market, to reverse last week’s losses and post the biggest weekly returns since May 27. CCC yields fell 49bps this week to 13.12%, a three week low.
  • The comeback was across ratings. BBs and single Bs were all on track to end the week with the biggest gains in almost two months.
  • Junk bond yields have plunged 39bps week-to-date to 8.17%, the biggest such drop in eight weeks, after steadily declining for five consecutive sessions.
  • Whether this resurgence from the worst June performance will be sustained would be put to test after the next week’s FOMC meeting.
  • The primary remained quiet as borrowers were on a wait-and-watch mode ahead of the next Fed meeting.
  • July issuance volume was a mere $1.06b and year-to-date volume was a modest $70b.
  • While the junk-bond market has edged higher all week, investors still appear to be withdrawing money from high-yield funds.
  • US junk bonds have seen outflows in seven of the last 10 weeks.
  • The junk rally may pause on Friday, taking its cue from choppy equity markets. US equity futures fluctuated as European stocks swung between gains and losses as investors looked to second-quarter earnings season to gauge how companies are weathering the impact of surging prices.
22 Jul 2022

CAM Investment Grade Weekly Insights

Investment grade credit performed well this week and it got better with each passing day.  The Bloomberg US Corporate Bond Index closed at 144 on Thursday July 21 after having closed the week prior at 150.  Spreads have now retraced 10% from the YTD wide OAS of 160 which was the closing spread level for the index on July 5.  The market is strong as we go to print on Friday.  The 10yr Treasury is yielding 2.78% after having closed the week prior at 2.92%.  The 10yr Treasury rallied Friday morning as S&P Global’s July survey of purchasing managers showed business activity contracted for the first time in more than two years.  Through Thursday the Corporate Index had a negative YTD total return of -12.80% while the YTD S&P500 Index return was -15.38% and the Nasdaq Composite Index return was -22.92%.

The primary market roared to life this week as borrowers, led by money center banks, brought over $45bln in new bonds.  It was the busiest week of issuance since mid-April.  This pace will assuredly slow next week as earnings season ramps up and the FOMC takes center stage on Wednesday with a rate decision.  Street estimates are looking for $15-20bln in issuance primarily on Monday and Tuesday.  There has been $782bln of new issuance YTD which trails 2021’s pace by 8% according to data compiled by Bloomberg.

Investment grade credit saw another outflow on the week but with declining velocity.  Per data compiled by Wells Fargo, outflows for the week of July 14–20 were -$1.2bln which brings the year to-date total to -$127.1bln.

09 Jul 2022

Q2 High Yield Quarterly

In the second quarter of 2022, the Bloomberg Barclays US Corporate High Yield Index (“Index”) return was -9.83% bringing the year to date (“YTD”) return to -14.19%. The CAM High Yield Composite net of fees total return was -10.44% bringing the YTD net of fees total return to -15.91%. The S&P 500 stock index return was -16.11% (including dividends reinvested) for Q2, and the YTD return stands at -19.97%. The 10 year US Treasury rate (“10 year”) was generally marching higher as the rate finished at 3.01%, up 0.67% from the beginning of the quarter. Over the period, the Index option adjusted spread (“OAS”) widened 244 basis points moving from 325 basis points to 569 basis points. Each quality segment of the High Yield Market participated in the spread widening as BB rated securities widened 172 basis points, B rated securities widened 289 basis points, and CCC rated securities widened 418 basis points. The chart below from Bloomberg displays the spread moves in the Index over the past ten years with an average level of 433 basis points.

The Utilities, Energy, and Insurance sectors were the best performers during the quarter, posting returns of -6.98%, -8.02%, and -8.17%, respectively. On the other hand, Brokerage, Finance, and Consumer Non-Cyclical were the worst performing sectors, posting returns of -12.64%, -11.38%, and -11.33%, respectively. Clearly the market was weak as all sectors posted a negative return in the period. At the industry level, refining, food and beverage, and paper all posted the best returns. The refining industry posted the highest return -2.79%. The lowest performing industries during the quarter were pharma, retailers, and building materials. The pharma industry posted the lowest return -19.33%.

The energy sector continues to be a topic within the inflation discussion. Crude oil has continued higher reaching a high of $120 a barrel in early June. OPEC+ members recently bumped up production which was the last bit to restore all that was shuttered due to the pandemic.i President Biden has a scheduled trip to Saudi Arabia later this month. However, asking the Saudis to pump more oil is not on the agenda, as the President indicated that the Gulf Cooperation Council meeting is the more appropriate place for that request.

Given the rising spreads, rising yields, and volatility, the primary market remained very subdued during the second quarter. The weak market led to year-to-date issuance of $75.6 billion and $29.8 billion in the quarter. Energy took 24% of the market share followed by Discretionary at a 19% share. Wall Street strategists continue to lower their full year issuance forecasts. However, there isn’t much concern for lack of capital access due to issuers being so proactive with refinancing in the past few years. In fact, only about $70 billion in high yield bonds are due to mature from now through the end of 2023.

The Federal Reserve lifted the Target Rate by 0.50% at their May meeting and by an additional 0.75% at their June meeting. The chart to the left shows the updated Fed dot plot post the June meeting. Of note, the Fed median Target Rate for 2022 increased from 1.875 to 3.375. Such movement is a clear indication of the dynamic economic backdrop. After the June meeting, Fed Chair Jerome Powell acknowledged that the 0.75% hike was “an unusually large one.” It was the largest hike since 1994. As he later spoke in front of the Senate Banking Committee, he called the possibility of a soft landing “very challenging.”ii He went on to say, “The other risk, though, is that we would not manage to restore price stability and that we would allow this high inflation to get entrenched in the economy. We can’t fail on that task. We have to get back to 2% inflation.” Inflation is running higher than any point in the last 40 years and the Fed, having updated their Summary of Economic Projections, accepts that the continuing rate hikes are going to lower growth and push up unemployment.

Intermediate Treasuries increased 67 basis points over the quarter, as the 10-year Treasury yield was at 2.34% on March 31st, and 3.01% at the end of the second quarter. The 5-year Treasury increased 58 basis points over the quarter, moving from 2.46% on March 31st, to 3.04% at the end of the second quarter. Intermediate term yields more often reflect GDP and expectations for future economic growth and inflation rather than actions taken by the FOMC to adjust the Target Rate. The revised first quarter GDP print was -1.6% (quarter over quarter annualized rate). Looking forward, the current consensus view of economists suggests a GDP for 2022 around 2.5% with inflation expectations around 7.5%.iii The will we or won’t we recession camps are still divided. The former Vice Chair of the FOMC Bill Dudley said a recession is inevitable within the next 12 to 18 months. The Chief Economist at JP Morgan said “there’s no real reason to be worried about a recession.” Meanwhile, strategists at Citi wrote in a report that the market is pricing in a 50% probability.

Being a more conservative asset manager, Cincinnati Asset Management Inc. does not buy CCC and lower rated securities. This policy generally served our clients well in 2020. While this segment did outperform last year, after 15 months CCC’s are again underperforming as we expect in times of market stress. Our interest rate agnostic philosophy keeps us generally positioned in the five to ten year maturity timeframe. Due to the continued rate moves, this positioning was a detractor as the sub-three year maturity cohort provided the best performance in the quarter. As a result and noted above, our High Yield Composite net of fees total return did underperform the Index in Q2. Additionally, our credit selections within cable/satellite and leisure were a drag on performance. Benefiting our performance was our lack of exposure to pharma and our credit selections within consumer services, midstream, and retail.

The Bloomberg Barclays US Corporate High Yield Index ended the second quarter with a yield of 8.89%. The market yield is an average that is barbelled by the CCC rated cohort yielding 13.63% and a BB rated slice yielding 7.24%. Equity volatility, as measured by the Chicago Board Options Exchange Volatility Index (“VIX”), had an average of 27 over the quarter moving as high as 35 in the beginning of May. For context, the average was 15 over the course of 2019, 29 for 2020, and 19 for 2021. The second quarter had four bond issuers default on their debt. The trailing twelve month default rate stands at 0.86%.iv The current default rate is relative to the 1.63%, 0.92%, 0.27%, 0.23% default rates from the previous four quarter end data points listed oldest to most recent. The fundamentals of high yield companies still look good considering the economic backdrop. From a technical view, fund flows were negative in all three months of the quarter. The 2022 year-to-date outflow stands at $46.0 billion.v Without question there has been a fair amount of damage in bond markets so far this year. It is important to remember that bonds are a contractual agreement with a defined maturity date. Thus, despite any price volatility, without default, par will be paid at the stated maturity date. Currently, defaults are quite low and fundamentals are quite high. No doubt there are risks, but we are of the belief that for clients that have an investment horizon over a complete market cycle, high yield deserves to be considered as part of the portfolio allocation.

The backdrop as we move into the second half of 2022 is quite interesting. The University of Michigan Consumer Sentiment reading is the worst ever, the S&P 500 recorded the worst first half in over fifty years, inflation is at levels not seen in over forty years, the Fed hiked a rate at one meeting not seen in almost thirty years, and naturally the bond markets are under heavy pressure. Implied inflation, using breakeven inflation rates, is well off recent highs. Further, corn and wheat have fallen about 20% from recent highs. Given all of this, the high yield market is yielding almost 9% with a spread north of 550 basis points. Clearly, it is important that we exercise discipline and selectivity in our credit choices moving forward. We are very much on the lookout for any pitfalls as well as opportunities for our clients. We will continue to carefully monitor the market to evaluate that the given compensation for the perceived level of risk remains appropriate on a security by security basis. As always, we will continue our search for value and adjust positions as we uncover compelling situations. Finally, we are very grateful for the trust placed in our team to manage your capital.

This information is intended solely to report on investment strategies identified by Cincinnati Asset Management. Opinions and estimates offered constitute our judgment and are subject to change without notice, as are statements of financial market trends, which are based on current market conditions. This material is not intended as an offer or solicitation to buy, hold or sell any financial instrument. Fixed income securities may be sensitive to prevailing interest rates. When rates rise the value generally declines. Past performance is not a guarantee of future results. Gross of advisory fee performance does not reflect the deduction of investment advisory fees. Our advisory fees are disclosed in Form ADV Part 2A. Accounts managed through brokerage firm programs usually will include additional fees. Returns are calculated monthly in U.S. dollars and include reinvestment of dividends and interest. The index is unmanaged and does not take into account fees, expenses, and transaction costs. It is shown for comparative purposes and is based on information generally available to the public from sources believed to be reliable. No representation is made to its accuracy or completeness.
The information provided in this report should not be considered a recommendation to purchase or sell any particular security. There is no assurance that any securities discussed herein will remain in an account’s portfolio at the time you receive this report or that securities sold have not been repurchased. The securities discussed do not represent an account’s entire portfolio and in the aggregate may represent only a small percentage of an account’s portfolio holdings. It should not be assumed that any of the securities transactions or holdings discussed were or will prove to be profitable, or that the investment decisions we make in the future will be profitable or will equal the investment performance of the securities discussed herein.

i Bloomberg June 30, 2022: OPEC+ Ratifies August Supply Hike
ii Bloomberg June 22, 2022: Powell Says Soft Landing ‘Very Challenging’
iii Bloomberg July 1, 2022: Economic Forecasts (ECFC)
iv JP Morgan July 1,, 2022: “Default Monitor”
v Wells Fargo June 30, 2022: “Credit Flows”

09 Jul 2022

2022 Q2 Investment Grade Quarterly

The second quarter was another extraordinarily difficult period of performance for investment grade corporate credit. Treasury yields continued to march higher and credit spreads moved wider. The option adjusted spread (OAS) on the Bloomberg US Corporate Bond Index widened by 39 basis points to 155 after having opened the quarter at an OAS of 116. The 10yr Treasury opened the quarter at 2.34% and finished 67 basis points higher, at 3.01%. The 5yr Treasury opened the quarter at 2.46% and finished 58 basis points higher, at 3.04%. The 2yr Treasury opened the quarter at 2.33% and finished 62 basis points higher, at 2.95%. Some sections of the Treasury curve were inverted throughout the quarter which historically has been one of the leading indicators of a recession.

The Corporate Index posted a second quarter total return of –7.26%. CAM’s Investment Grade portfolio net of fees total return for the second quarter was –6.02%.

As much as it pains us and our investors to experience consecutive quarters of negative performance, not all hope is lost for investment grade returns in the future. The asset class has seen a meaningful drawdown and overwhelming negative sentiment has been priced into current valuations in our view. Higher Treasury yields and wider spreads have left investors with a much larger margin of safety in the asset class than there has been at any point in the past decade. We will discuss our views on where the market could go from here in the ensuing sections of this letter.

Is The Worst Over?

We have just endured a historically poor period of performance. The past two quarters were 2 of the 3 worst quarters in the history of the investment grade credit market and represent the worst 6 month performance period for the asset class. Looking at the bigger picture–we are talking about a brief time period of only six months. This asset class is not one that lends itself to tactical positioning and is more appropriate to view through the lens of a longer time horizon. That is why we tell our investors that a minimum time horizon of 3 to 5 years is needed to give our strategy the best chance of success. This is because the lynchpin of our strategy involves the intermediate Treasury and corporate credit curves. We typically purchase securities that mature in 8-10 years and look to sell those securities when they have 4-5 years left to maturity, redeploying those proceeds into attractive opportunities back further out the curve in the 8-10yr space. As bonds “roll down the curve” the bond math acts like water, finding its lowest level. All else being equal with rates and spreads, the price of a bond will move closer to par with each passing day of its existence. Bonds that have declined in value will start to recover with the passage of time as the time to maturity shortens.

As we mentioned in the opening section of this letter, the compensation afforded for credit spread and the underlying Treasury is much more than it has been in recent history. The index closed the second quarter at a spread of 155 relative to the 10yr average spread of 126. To provide some context on the rate of change over the course of the past year, on June 30 2021, the index closed at a spread of 80, which was its lowest level at any point in the past decade. As far as yield to maturity is concerned, the yield on the index was 4.71% at the end of the second quarter while the 10yr average was 3.09%. The index recently closed with its highest yield at any point in the past decade on June 14 2022, when it finished the day at 4.99%.

Now, we often caution against market timing and quite frankly we were wrong about valuations at the end of the first quarter because we thought they were relatively attractive at that point in time. Our valuation thesis crumbled throughout the second quarter while we watched rates continue to move higher and spreads traded wider due to macroeconomic concerns. This brings us to the question–can things get worse from here with higher rates and wider spreads? Absolutely, it could happen, and of course the opposite could come true as well and the market could see positive performance. What will happen over the short term is merely a guess. From a longer term point of view what we do know is that there is no denying that there is substantially more room for error for investors in investment grade corporate credit than there has been in a long time. We believe the Band-Aid has been ripped off at this point and that going forward we are much less likely to see a repeat of the eye watering negative returns that we saw in the first two quarters. Instead, we think the level of compensation afforded today sets up well for the potential to drive positive total returns for IG credit in the future over the medium and longer term.

Credit Conditions

Credit conditions for the investment grade universe remain strong, especially for the mostly highly rated companies, but conditions have declined so far this year and at this point it is clear that year-end-2021 was the peak for credit conditions in this cycle. Major factors that have led to the decline are higher borrowing costs due to rising interest rates and wider spreads. Inflationary pressures have also started to squeeze profit margins as companies are not able to pass the entirety of rising costs on to their customers. Inventory build and discounting have started to appear in some pockets of retail. Consumer confidence has slipped which historically has been a leading indicator of a slowdown in consumer spending.

Credit investors have begun to tread with caution as the majority of economists now expect a recession by the end of 2023.i The new issue market has slowed substantially in recent weeks amid volatility across risk assets. The market remains open for borrowers but investors are now demanding larger new issue concessions. This can present opportunities for bond investors as even very strongly capitalized highly rated companies will be forced to pay attractive new issue concessions in the current environment. This means higher coupons for investors. The key for a bond investor is to resist the temptation of the optically high yields offered by those companies that don’t have good balance sheets or those that trade at levels that do not offer adequate compensation for the risk. We are at a fairly interesting crossroads in the market where the prudently capitalized companies in the IG universe do not find themselves in a position where they “need” to borrow and we believe many of the companies that we follow would have likely issued new debt recently but simply decided not to because they don’t need the capital and more expensive borrowing costs have made raising new debt less attractive. On the other side of the coin are those companies that engaged in M&A or debt funded capital projects or shareholder rewards prior to the increase in borrowing costs. These CFOs and treasurers find themselves in the unenviable position of needing to borrow in a volatile market and trying to best gauge when to issue bonds. Some of these companies will be required to pay outsized new issue concessions in order to complete their bond offerings. Again, this could mean opportunity in select credits but some of the new deals simply won’t be cheap enough to offer adequate compensation for the risk. So what we find ourselves with today is a market that is highly bifurcated. For the vast majority of IG-rated companies, liquidity and cash on balance sheet remains near all-time highs and leverage is at very reasonable levels. For some other companies, they might have too much debt and the business and balance sheet are subsequently poorly positioned for an economic slowdown. In a recession scenario, many of the well capitalized companies will see margins contract and could see sales decline–but their balance sheets are in good shape and they are not over-levered so they will navigate a downturn just fine and easily make good on their commitment to pay bondholders while keeping their current credit ratings. For those companies that have too much debt and are also faced with declining revenues and profits –it could be a bumpy road during an economic slowdown and there will likely be some companies that see their bonds downgraded to junk. It is our job to manage the credit risk of the portfolio and avoid companies that are at risk of seeing their credit metrics decline precipitously. In a recession scenario, due to the strength of the highly rated, well capitalized portion of the investment grade universe, we believe investment grade credit will perform better than most other asset classes.

Portfolio Positioning

As an active manager we have been able to make what we felt were many opportunistic trades amid the market volatility of the past few weeks. To be clear, we will never make wholesale changes to our strategy but we will always tinker at the margins depending on the environment in our market at any given time. The Holy Grail for bond performance has three tenets –decrease maturity, increase yield and increase or maintain credit quality. If a manager can affect a trade that accomplishes all three, then it is likely to be successful over time. Currently, the biggest change to our management style is that the dislocation in the market has created opportunities for us to buy shorter maturities than we typically would. Intermediate Treasury curves were flat or inverted throughout most of the second quarter, depending on the day. The corporate credit curve still has a level of steepness but due to the nature of the way that the bond market trades–over the counter, price discovery and no exchange like equities, it can create attractive scenarios where a manager is able to buy shorter duration bonds of an issuer at levels that are more attractive than the longer bonds–a situation that should not exist in an efficient market–but the bond market is not always efficient. We have been able to populate investor portfolios with many more bonds that mature in 7 or 8 years (or even less in some cases) whereas in more normalized periods with steeper Treasury and corporate credit curves the math would favor 9-10 year bonds. All else being equal, a shorter maturity means less interest rate and credit risk for our investors. Note that we will always stick to our mandate of intermediate maturities.

In addition to being able to position more conservatively from a duration standpoint, we are also being cautious with credit risk. Credit health is still quite good for many issuers even if some companies have begun to experience a slight decline in margins and profitability. At the moment we are avoiding more cyclical credits in favor of stability. As investors have started to factor in the increasing probability of a recession, the spread gap between lower rated and higher rated credit has grown, and lower rated has performed relatively worse. We see select opportunities in BAA-rated credit but continue to limit our exposure to 30% of investor portfolios while the index was 49.53% BAA-rated at the end of the second quarter. We will not be increasing our weighting to riskier credit and our preference for lower rated credits at the moment is limited to those companies that have stable or improving credit metrics or those that are in the process of deleveraging. As far as A-rated companies are concerned, they will continue to make up approximately 70% of investor portfolios and we are favoring industries like utilities and highly rated energy companies. We also like non-discretionary healthcare and technology companies that will continue to grow earnings regardless of the economic environment. We believe that the risk of recession has increased substantially and are looking to populate portfolios with companies that can navigate an environment of negative growth with little impact to credit worthiness.

Hawks & Doves

During the second quarter the Federal Reserve made it abundantly clear that they were focused on conquering inflation as they delivered a 50bps hike in May followed by a 75bps hike in June. The next FOMC rate decision is July 27 and Chairman Powell has messaged that 50-75bps will be on the menu, depending on the economic data over the course of the next few weeks. Recent economic data has indicated an increasing possibility of a slowing economy and traders are now pricing in 50bps of rate cuts in 2023. Current projections foresee a peak for Fed Funds of ~3.3% in early 2023 up from 1.75% today with a prediction that the benchmark rate will be 2.7% at year-end 2023.ii What this means is that traders are predicting a recession by mid-2023 as that would be the catalyst for a rate cut in the second half of next year. Inflation is not a problem unique to the U.S. and a myriad of central banks have joined the Fed in the quest to quell rising prices. Australia, Canada, New Zealand and Switzerland have raised their policy rates in recent weeks and even the reticent ECB has signaled a series of rate hikes that will begin in July.iii As a result, the amount of global negative yielding debt has tumbled from nearly $17 trillion in August of 2021 to just over $2 trillion at the end of the second quarter. The Bank of Japan is the only major central bank that has resisted tightening financial conditions.

Our job is to manage credit risk, not to speculate on rates or try and predict the Fed’s next move. That doesn’t mean we don’t care, just that our time is better spent on studying individual companies and their creditworthiness and not trying to predict the next move of a central bank as it is very much a game of chance. What we do know is that the economic data that the Fed uses to guide its policy decisions is backward looking in nature, not forward looking. Regardless of how much the Fed raises its policy rate, it seems likely that it will do so until it overshoots, finding itself in a situation where it raises the policy rate during the early stages of a U.S. recession. In other words, the Fed will be hawkish until it isn’t, and it will continue to tighten financial conditions until inflation is no longer a problem. What does this mean for credit? If there is a recession it could mean wider credit spreads. We plan to position the portfolio accordingly and with the type of companies that can weather an economic downturn.

Making the Turn

We are more than halfway through 2022 and there are more risks for credit today than when we started the year. The good news is that much of this bad news has been priced into valuations. This has created opportunity in our view but we will continue to be diligent and screen each of our investments carefully. Now is not the time to reach for yield, but to invest in the bonds of those companies that are well positioned and allocate capital in a creditor-friendly manner. We will be doing our very best to pick those investments that have the best chance to generate positive returns for our investors. We thank you for your patience during this turbulent time. As always we encourage you to contact us with questions. Thank you for your interest and partnership.

This information is intended solely to report on investment strategies identified by Cincinnati Asset Management. Opinions and estimates offered constitute our judgment and are subject to change without notice, as are statements of financial market trends, which are based on current market conditions. This material is not intended as an offer or solicitation to buy, hold or sell any financial instrument. Fixed income securities may be sensitive to prevailing interest rates. When rates rise the value generally declines. Past performance is not a guarantee of future results. Gross of advisory fee performance does not reflect the deduction of investment advisory fees. Our advisory fees are disclosed in Form ADV Part 2A. Accounts managed through brokerage firm programs usually will include additional fees. Returns are calculated monthly in U.S. dollars and include reinvestment of dividends and interest. The index is unmanaged and does not take into account fees, expenses, and transaction costs. It is shown for comparative purposes and is based on information generally available to the public from sources believed to be reliable. No representation is made to its accuracy or completeness.
The information provided in this report should not be considered a recommendation to purchase or sell any particular security. There is no assurance that any securities discussed herein will remain in an account’s portfolio at the time you receive this report or that securities sold have not been repurchased. The securities discussed do not represent an account’s entire portfolio and in the aggregate may represent only a small percentage of an account’s portfolio holdings. It should not be assumed that any of the securities transactions or holdings discussed were or will prove to be profitable, or that the investment decisions we make in the future will be profitable or will equal the investment performance of the securities discussed herein.

i Fortune, June 13 2022, “Over two thirds of economists believe a recession is likely to hit in 2023”
ii Bloomberg, July 5 2022, “Traders looking to get ahead of Fed again foresee rate cuts”
iii Reuters, June 10 2022, “Central banks double down in fight against ‘galloping’ inflation”

24 Jun 2022

CAM Investment Grade Weekly Insights

Investment grade credit has had a week of mixed performance.  The Bloomberg US Corporate Bond Index closed at 149 on Thursday June 23 after having closed the week prior at 144.  The market tone has been good for risk assets on Friday and it looks likely that spreads will finish the week on a positive note.  The 10yr Treasury is yielding 3.12% as we go to print after having closed the week prior at 3.23%.  The 10yr is down substantially from just 10 days ago when it closed at 3.47% on June 14.  Through Thursday the Corporate Index had a negative YTD total return of -14.42% while the YTD S&P500 Index return was -19.77% and the Nasdaq Composite Index return was -27.93%.

New issue activity returned this week but was relatively low volume as IG issuers brought just over $10bln in new debt to market. The consensus expectation is that there will be be about $15bln in issuance next week but it would not surprise us to see less or more than that figure, depending on market conditions.  There has been $708bln of new issuance YTD which trails 2021’s pace by 9% according to data compiled by Bloomberg.  It looks as though June will fall short of the $90bln estimate for new debt, with just $61bln priced thus far during the month.

Investment grade credit saw another outflow on the week.  Per data compiled by Wells Fargo, outflows for the week of June 16–June 22 were -$9.0bln which brings the year-to-date total to -$107.2bln.