Category: Insight

13 Jan 2023

CAM Investment Grade Weekly Insights

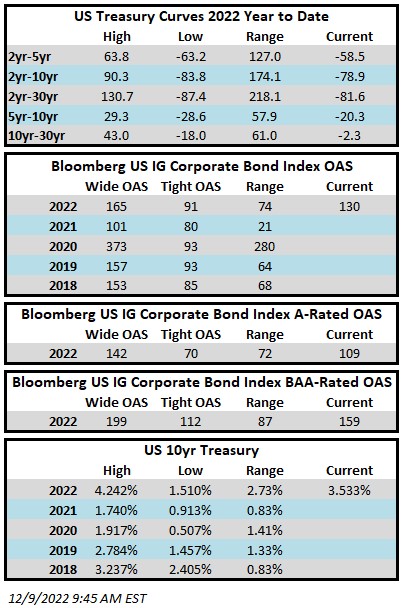
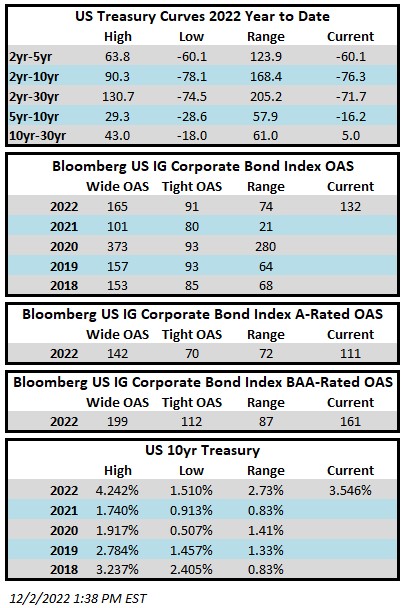
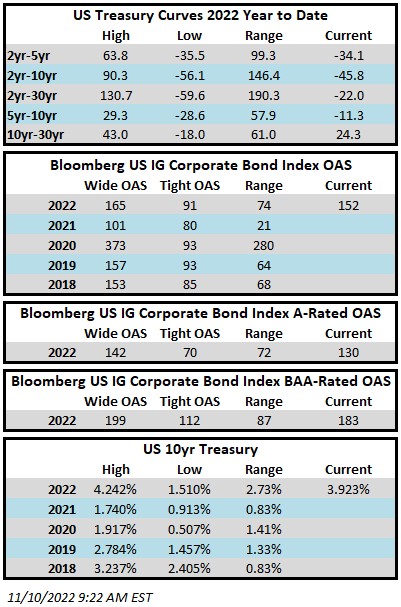
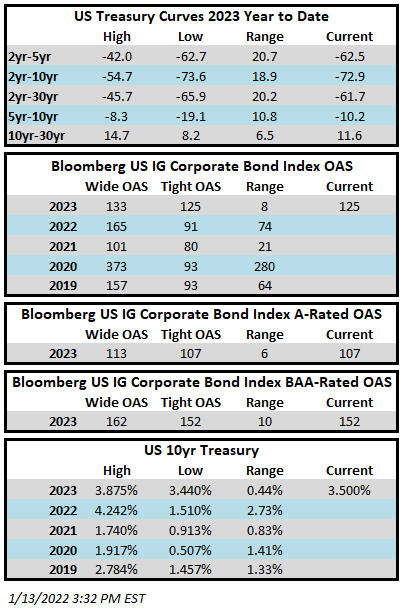
Investment grade credit spreads move tighter throughout the week.  The Bloomberg US Corporate Bond Index closed at 125 on Thursday January 12 after having closed the week prior at 132.  The 10yr Treasury closed the week prior at 3.56% and it is trading at 3.50% as we go to print on Friday afternoon.  Through this Thursday the Corporate Index had a YTD total return of +3.7% while the YTD S&P500 Index return was +3.8% and the Nasdaq Composite Index return was +5.1%.

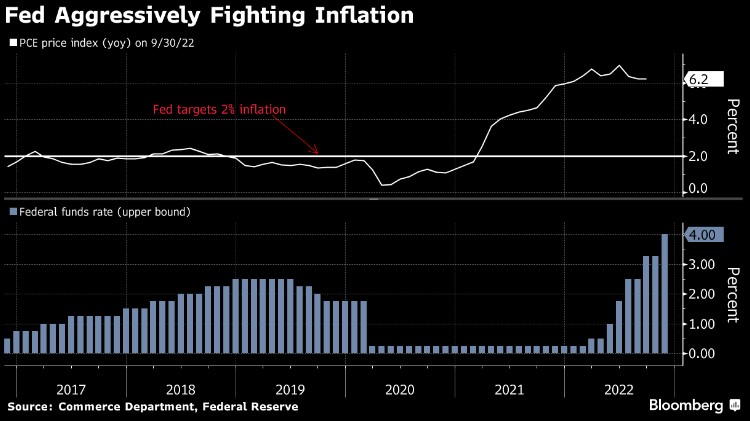
There was a treasure trove of economic data this week with the crown jewel being the CPI release on Thursday morning.  Consumer prices rose 6.5% in the past 12 months through the end of December.  The Fed’s preferred metric of core inflation was up 5.7% over the same period which was the smallest increase in over a year.  The majority of market prognosticators believe that the CPI release increases the probability that the Fed will choose to raise its policy rate by 25 basis points on February 1 but 50 basis points remains a possibility.  There was more positive news on the inflation front in the consumer sentiment numbers that were released on Friday morning.  That data showed that respondents expect prices to increase just 4% over the next year.  This was the lowest reading for price expectations since April 2021.  There will be plenty of data to parse in the week ahead and the highlights include retail sales, producer price data and the NAHB housing market index.

The primary market had another strong week with more than $36bln in new supply pushing the total for January to $94.1bln.  Next week is shaping up to strong too as money center banks are expected to tap the debt markets as they exit earnings blackout.  The bond market is closed on Monday in observance of Martin Luther King Day but estimates are still calling for as much as $30-$40bln in new supply during the holiday shortened week.

Investment grade credit reported its largest weekly inflow in over two years.  Per data compiled by Wells Fargo, inflows for the week of January 5–11 were +8.4bln which brings the year-to-date total to +$10.5bln.

This information is intended solely to report on investment strategies identified by Cincinnati Asset Management. Opinions and estimates offered constitute our judgment and are subject to change without notice, as are statements of financial market trends, which are based on current market conditions. This material is not intended as an offer or solicitation to buy, hold or sell any financial instrument. Fixed income securities may be sensitive to prevailing interest rates. When rates rise the value generally declines. Past performance is not a guarantee of future results. 

12 Jan 2023

2022 Q4 INVESTMENT GRADE QUARTERLY

It will be remembered as the year to forget for investment grade corporate credit as the asset class generated the largest negative yearly total return in its history driven by a combination of wider spreads and much higher interest rates.  For the full year 2022, the option adjusted spread (OAS) on the Bloomberg US Corporate Bond Index widened by 38 basis points to 130 after having opened the year at 92.  The 4th quarter was particularly volatile for credit spreads as the OAS on the index traded as wide as 165 in mid-October after which spreads marched steadily tighter into year-end.  Treasuries also experienced a massive amount of volatility in the 4th quarter with the 10yr Treasury trading as high as 4.24% at the end of October and then as low as 3.42% near the beginning of December before finishing the year at 3.88%.  The full year numbers really illustrate the pain-trade for interest rates as the 10yr Treasury posted its largest one-year gain in history of +237 basis points, more than doubling from its starting point of 1.51%.

For the full year 2022, the Corporate Index posted a total return of -15.76%.  CAM’s Investment Grade Program gross of fees total return for the full year 2022 was -13.31% (-13.52% net of fees).  As bad as the year was, the Corporate Index did manage to finish on a high note with a positive 4th quarter total return of +3.63%.  This compares to CAM’s gross 4th quarter return of +2.99% (2.93% net).  Looking at longer time periods, the Corporate Index ended 2022 with 5 and 10-year returns of +0.45% and 1.96%, respectively.  CAM’s investment grade program posted 5 and 10-year gross annualized returns of +0.70% (0.47% net) and 1.90% (1.66% net), respectively.

There was nowhere to hide in 2022, with all buckets of maturities and credit ratings posting negative returns.  Intermediate credit performed relatively better than longer dated credit due to its lower duration.  A-rated credit performed slightly better than the index as a whole and it outperformed both >Aa-rated credit and Baa-rated credit but the returns picture was ugly across the board.

When Will the Tide Turn for Corporate Bonds?

 The fact is that returns for IG credit have already started to improve.  Please note that we are not calling a bottom by any means, we are just observing the data and reasoning that it is entirely possible that the worst is over for this cycle.  When the market closed on November 7, the Corporate Index to that point in the year had posted a negative total return of -20.65%.  The index then rebounded, benefitting from tighter credit spreads and lower interest rates, and finished the year with a negative total return of -15.76%.  From November 7 until year end the index posted a +4.89% total return.  In our experience many investors tend to wait on the sidelines for the perfect entry point, missing much of the low hanging fruit when the tide has turned.

When it comes to bonds, negative returns have typically made for opportunity.  We do not know what the future will bring and past returns are not indicative of future results, but a glimpse of history paints a favorable picture for IG corporates.

2022 was by far the worst year of performance since the inception of the Corporate Bond Index in 1973, eclipsing the second worst year of performance by a whopping -9.90%.  In the past 50 years there have been 11 years where the index has posted negative returns.  Only twice has the index posted consecutive years of negative returns, 1979-1980 and 2021-2022.  The index has never posted 3 consecutive years of negative total returns.  The average return the year after the index has posted a negative return is +8.17%.  This is no guarantee of positive returns in 2023 but it does illustrate the resiliency of investment grade credit as an asset class over the course of history.

Wider credit spreads and much higher Treasuries have led to some of the largest yields that have been available in IG corporates in more than a decade.  The yield to maturity on the Corporate Index finished the year at 5.42% and it traded at just over 6% in the first week of November.  The average yield to maturity on the index going back to the beginning of 2010 was 3.33%.  When the all-in yield for intermediate corporate bonds is >5% it gives the investor a much larger margin of safety, increasing the probability that IG corporate bonds will generate positive total returns in the future even if spreads and/or interest rates go higher.  To put this into context, take the 38 basis point widening in credit spreads that the index experienced in 2022.  If an investor were to purchase the index today at a YTM of 5.42% and spreads moved wider by 38 basis points over the course of the next year but interest rates did not move at all then that investor will have earned an annual total return of >5% despite the move wider in spreads.  Even if interest rates also traded higher by +50bps in addition to the +38bp move wider in spreads then our hypothetical investor would have earned a total return of >4.5%.  We believe IG corporate yields that are meaningfully higher than they have been in the recent past offer an attractive opportunity for investors and the compensation is high enough to offset short term volatility.

U.S. Recession Looms Large

Much has been written about what may be the most widely anticipated recession in history.  According to sources compiled by Bloomberg, forecasters surveyed by the Federal Reserve Bank of Philadelphia put the probability of a downturn in 2023 at more than 40% and economists polled by Bloomberg see the chances of recession in 2023 at 65%.[i]  We hate to be on the same side of what appears to be a crowded trade but we agree that a recession is more likely than not over the course of the next 18 months, either in 2023 or the first half of 2024.  Our belief stems largely from restrictive Federal Reserve policy as well as the FOMC’s commitment to tame inflation.  A dramatic move higher in the Federal Funds Target Rate of +425bps in one calendar year has begun to have its intended effect with certain sectors of the economy, such as housing, experiencing a significant contraction.ii  But the Fed is not done yet, and additional rate hikes are in the queue. We believe that the Fed will maintain tight conditions until it sees significantly diminished demand within the labor market.  In our view, the Fed cannot afford to reverse course too quickly and if anything it is likely to hold the policy rate in restrictive territory for longer than expected.  This bias toward Fed “over-tightening” underpins our recession expectations.

How can investors prepare for a recession?  We are admittedly biased as a corporate bond manager but we think an appropriate allocation to IG credit could be very useful to most investors in order to sufficiently diversify and position their overall investment portfolios for an economic slowdown.  A recession is not guaranteed and we may find instead that the economy simply grows at a low rate for some period of time.  Historically, according to data compiled by Credit Suisse, in a scenario with quarterly GDP growth of 0-1% IG credit has performed well and generated positive spread returns.iii In a scenario where the economy experiences a brief shallow recession with modestly negative growth IG spreads have historically widened, but this does not necessarily mean negative total returns.  IG credit has typically outperformed other risk assets during periods of negative economic growth.iv  By and large, investment grade rated companies took full advantage of the low interest rate environment that was available to them in recent years and as a result most IG balance sheets are flush with liquidity and maturity walls have been pushed out making a modest downturn easily navigable for the vast majority of IG-rated companies.  Credit metrics for the index have deteriorated slightly from the peak which was at the end of the first quarter of 2022, but fundamentals are still very strong.  At the end of the third quarter 2022 net leverage for the index (ex-financials) was 2.9x while EBITDA margin was 28.2% and interest coverage was 15.1x.

Where things start to get a little trickier is if there is a more prolonged deeper recession.  In a “deep recession” scenario we would expect credit spreads to trade meaningfully wider.  An OAS of 200+ on the index versus 130 at the end of the year would be probable in a deep recession scenario.  However, in such a scenario we could also see Treasury yields trade lower which would serve to offset wider credit spreads.  The most important thing for investors is the aforementioned level of yield that is available today, which is much higher than in the recent past, offering a buffer against any short term volatility incurred as the result of a recession.

Inverted Treasury Curves & Our Response

We have touched on this topic in previous commentaries and we continue to get questions from our investors so we think that it would be helpful to revisit.  An inverted curve makes bond investing more challenging but the economics still work.  There are two curves to think about as a corporate bond investor.  The underlying curve is the Treasury curve or risk free rate –this is the base rate and any IG corporate bond that an investor purchases will be at an additional spread on top of the risk free rate.  The spreads investors are paid for owning various maturities of corporate bonds form their own curve which we refer to as the corporate credit curve.  So we have two curves, and in normalized times they are both upward sloping.  The corporate credit curve is always upward sloping other than idiosyncratic cases inspired by market volatility that are quickly arbitraged away.  The Treasury curve is almost always upward sloping but it can invert, especially in economic environments like the one we are in currently.  Think of it this way –the Fed Funds Rate is extremely meaningful to where the 2yr Treasury trades but not very meaningful at all for where the 10yr trades.  This is because the 2yr is a short maturity that has to adjust for Fed Funds but the 10yr trading level is predicated on investor expectations for longer term economic growth and inflation expectations.

As an example, if a company issued new bonds on December 30 an investor would always be compensated with more yield to purchase the 10yr bond of that company relative to the 5yr bond.  This is despite the fact that at the end of 2022 the 10yr Treasury had a yield of 3.87% while the 5yr Treasury had a yield of 4.00% –the 5/10 Treasury curve was inverted by 13 basis points.  In order to make up for the Treasury curve inversion, market participants demand sufficiently more spread compensation to own the 10yr corporate bond relative to the 5yr corporate bond –the corporate credit curve would be even steeper than usual to account for the inverted Treasury curve.

Curve inversion has impacted our strategy at CAM, but only at the margins. In a typical environment we buy bonds that mature in 9-10 years and then we sell around the 5yr mark.  Curve inversion along with other technical factors at play in the market have created an environment where there are many more attractive investment opportunities for us to purchase that mature in 7-9 years but it has also required us to hold our current investments somewhat longer, until the 3-4 year mark in order to affect a more economic sale.  We are still looking at a holding period that averages approximately 5 years for new portfolios, but we are getting to that 5-year holding period with slightly shorter maturities.  At the end of the day much of this is a positive for our investors because shorter maturities carry less interest rate risk.

Curve inversions are typically quite brief in nature with the longest period of inversion on record for 2/10s being 21 months from August 1978 until April 1980.vi  The current 2/10 curve inversion began on July 5 2022 and was at its most deeply inverted point of -84 bps on December 7 2022 relative to -56 bps at year end 2022.

A New Year Brings Opportunity but Same Old Risks Remain

It is time to move on from the bond market rout of 2022 and focus on the opportunities that the drawdown has created.  We have already gone over those points and will not rehash them here; we will only remind investors that change can come quickly.  We would also like to remind investors that bonds sold off for a reason and risks remain.  The Federal Reserve has not yet completed its tightening cycle and we would caution investors from even beginning to think about easing financial conditions.  A recession in the U.S. could be imminent and in the Euro Zone it feels as though the odds of dodging a recession are infinitesimal.  Geopolitical risk remains at the forefront of investor concern as China attempts to successfully navigate its economic reopening and the war in Ukraine rages on.  These risks are balanced against an opportunity set for longer term investors that is compelling due to the risk/reward afforded by IG credit.

2022 was a difficult year for all bond investors.  We appreciate the trust you have placed in us as a manger and we look forward to doing our best to provide you with better returns in 2023.  We welcome any comments or concerns and look forward to an ongoing productive dialogue in the year ahead.

This information is intended solely to report on investment strategies identified by Cincinnati Asset Management. Opinions and estimates offered constitute our judgment and are subject to change without notice, as are statements of financial market trends, which are based on current market conditions. This material is not intended as an offer or solicitation to buy, hold or sell any financial instrument.  Fixed income securities may be sensitive to prevailing interest rates.  When rates rise the value generally declines.  Past performance is not a guarantee of future results.  Gross of advisory fee performance does not reflect the deduction of investment advisory fees.  Our advisory fees are disclosed in Form ADV Part 2A.  Accounts managed through brokerage firm programs usually will include additional fees.  Returns are calculated monthly in U.S. dollars and include reinvestment of dividends and interest. The index is unmanaged and does not take into account fees, expenses, and transaction costs.  It is shown for comparative purposes and is based on information generally available to the public from sources believed to be reliable.  No representation is made to its accuracy or completeness.  Additional disclosures on the material risks and potential benefits of investing in corporate bonds are available on our website: https://www.cambonds.com/disclosure-statements/.


The information provided in this report should not be considered a recommendation to purchase or sell any particular security.  There is no assurance that any securities discussed herein will remain in an account’s portfolio at the time you receive this report or that securities sold have not been repurchased.  The securities discussed do not represent an account’s entire portfolio and in the aggregate may represent only a small percentage of an account’s portfolio holdings.  It should not be assumed that any of the securities transactions or holdings discussed were or will prove to be profitable, or that the investment decisions we make in the future will be profitable or will equal the investment performance of the securities discussed herein.

i Bloomberg, January 3 2023 “The Most-Anticipated Downturn Ever”
ii The Wall Street Journal, December 7 2022 “What’s Going On With the Housing Market?”
iii Credit Suisse, December 7 2022 “CS Credit Strategy Daily (2023 US Cash Outlook)”
iv Credit Suisse, December 7 2022 “CS Credit Strategy Daily (2023 US Cash Outlook)”
v Barclays, December 13 2022 “US Investment Grade Credit Metrics Q3 22 Update”
vi St. Louis Fed, 2022, “10-Year Treasury Constant Maturity Minus 2-Year Treasury Constant Maturity”

12 Jan 2023

2022 Q4 High Yield Quarterly

In the fourth quarter of 2022, the Bloomberg US Corporate High Yield Index (“Index”) return was 4.17% bringing the year to date (“YTD”) return to -11.19%.  The S&P 500 stock index return was 7.55% (including dividends reinvested) for Q4, and the YTD return stands at -18.13%.

The 10 year US Treasury rate (“10 year”) finished at 3.88%, up 0.05% from the beginning of the quarter but did show a bit of volatility with a high in October of 4.24% and a low in December of 3.42%.  Over the period, the Index option adjusted spread (“OAS”) tightened 83 basis points moving from 552 basis points to 469 basis points.  All quality segments of the High Yield Market participated in the spread tightening as BB rated securities tightened 59 basis points, and B rated securities tightened 130 basis points, and CCC rated securities tightened 96 basis points.  The chart below from Bloomberg displays the spread moves in the Index over the past ten years with an average level of 428 basis points.

The Basic Industry, Banking, and Finance Companies sectors were the best performers during the quarter, posting returns of 6.52%, 6.33%, and 6.10%, respectively.  On the other hand, Communications, Technology, and Other Financial were the worst performing sectors, posting returns of 1.82%, 3.04%, and 3.06%, respectively.  At the industry level, gaming, oil field services, and pharma all posted the best returns.  The gaming industry posted the highest return 9.04%.  The lowest performing industries during the quarter were media, healthcare REITs, and retailers.  The media industry posted the lowest return 0.04%.

Crude oil had a few spikes above $90 per barrel as   OPEC+ members agreed to cut oil production by two million barrels per day.  Those levels did not remain long as a concern for economic growth took hold and prices marched lower by roughly $20 per barrel.  As we go to print in early January, crude is at $73 per barrel.  “A panel formed of key nations in the OPEC+ alliance is due to hold a monitoring meeting on Feb. 1. In the meantime, Saudi Energy Minister Prince Abdulaziz bin Salman has said the group will remain “pre-emptive” to keep the crude market in equilibrium.”i

The primary market remained very subdued during the fourth quarter.  The weak market led to full year 2022 issuance of $115.9 billion and $20.7 billion in the quarter.  The chart to the left gives a sense of just how low issuance was in 2022 relative to the past handful of years.  Discretionary took 31% of the market share followed by Technology at a 17% share.  Currently, there isn’t much concern for lack of capital access due to issuers being so proactive with refinancing in the past few years

After the Federal Reserve lifted the Target Rate by 0.75% at their June meeting, Fed Chair Jerome Powell acknowledged that the hike was “an unusually large one.”  The Fed then proceeded to lift the Target Rate at a 0.75% clip at the next three consecutive meetings before downshifting to a 0.50% increase at the December meeting.  All told, the Fed completed 425 basis points of raises in 2022.  The dot plot chart shows how the Fed projections of the 2022 year-end Target Rate have evolved over the past year.  The Fed was clearly behind the curve in keeping rates too low for too long and needed to play catch-up.  It remains to be seen whether they miss on the other side by raising rates too high.  Michael Feroli, chief US economist at JPMorgan said, officials “realize that the risk of overtightening is just something that they have to swallow and stomach.”ii  Chair Jerome Powell acknowledged at the December post-meeting press conference that there is “more work to do,” and the minutes showed Fed officials are intent on lowering inflation back toward their 2% target at the risk of rising unemployment and slower growth.

Intermediate Treasuries increased 5 basis points over the quarter, as the 10-year Treasury yield was at 3.83% on September 30th, and 3.88% at the end of the third quarter.  The 5-year Treasury decreased 9 basis points over the quarter, moving from 4.09% on September 30th, to 4.00% at the end of the third quarter.  Intermediate term yields more often reflect GDP and expectations for future economic growth and inflation rather than actions taken by the FOMC to adjust the Target Rate.  The revised third quarter GDP print was 3.2% (quarter over quarter annualized rate).  Looking forward, the current consensus view of economists suggests a GDP for 2023 around 0.3% with inflation expectations around 4.0%.iii

Being a more conservative asset manager, Cincinnati Asset Management Inc. does not buy CCC and lower rated securities.  Additionally, our interest rate agnostic philosophy keeps us generally positioned in the five to ten year maturity timeframe.  After three quarters of negative performance, Q4 closed positive with quality leading the way.  That quality focus that CAM is known for was certainly on display this quarter.  Further, our underweight within communications and our credit selections within aerospace & defense and consumer cyclicals were a benefit to performance.  The cash position was a drag on performance as was our credit selections within food & beverage.  All totaled, the CAM High Yield Composite Q4 gross of fees total return of 4.78% (4.71% net of fees) outperformed the Index. The full year 2022 Composite gross of fees total return of -12.90% (-13.16% net of fees) underperformed the Index.  Additionally, the Composite 5-year annualized gross of fees total return was 1.87% (1.55% net of fees) versus 2.31% for the Index, and the Composite 10-year annualized gross of fees total return was 2.33% (1.99% net of fees) versus 4.03% for the Index.

The Bloomberg US Corporate High Yield Index ended the fourth quarter with a yield of 8.96%.  Equity volatility, as measured by the Chicago Board Options Exchange Volatility Index (“VIX”), had an average of 25 over the quarter moving from a high of 33 in mid-October to a low of 19 in early December.  For context, the average was 15 over the course of 2019, 29 for 2020, and 19 for 2021.  The fourth quarter had zero bond issuers default on their debt. The trailing twelve month default rate stands at 0.84%.iv  The current default rate is relative to the 0.27%, 0.23%, 0.86%, 0.83% default rates from the previous four quarter end data points listed oldest to most recent.  The fundamentals of high yield companies still look good considering the economic backdrop.  From a technical view, fund flows were positive in October and November but negative in December.  The 2022 year-to-date outflow stands at $56.6 billion.v  While this was the second worst high yield market on record, it is important to remember that bonds are a contractual agreement with a defined maturity date.  Thus, despite price volatility, without default, par will be paid at the stated maturity date.  Currently, defaults are quite low and fundamentals are still providing a cushion.  No doubt there are risks, but we are of the belief that for clients that have an investment horizon over a complete market cycle, high yield deserves to be considered as part of the portfolio allocation.

As we move into 2023, the Fed will continue to remain a large part of the story.  The message from the Fed is unequivocal.  Breaking the back of inflation is job number one.  While caution is warranted as uncertainty remains around the cycle’s terminal rate and depth of an economic slowdown, it seems like progress is being made as there has been five consecutive lower inflation reports.   Markets have been roughed up this year, but brighter days will eventually appear.  As this cycle plays out, current uncertainty and volatility can create opportunities that lead back to positive returns.  Our exercise of discipline and selectivity in credit selections is important as we continue to evaluate that the given compensation for the perceived level of risk remains appropriate.  As always, we will continue our search for value and adjust positions as we uncover compelling situations.  Finally, we are very grateful for the trust placed in our team to manage your capital.

This information is intended solely to report on investment strategies identified by Cincinnati Asset Management. Opinions and estimates offered constitute our judgment and are subject to change without notice, as are statements of financial market trends, which are based on current market conditions. This material is not intended as an offer or solicitation to buy, hold or sell any financial instrument.  Fixed income securities may be sensitive to prevailing interest rates.  When rates rise the value generally declines.  Past performance is not a guarantee of future results.  Gross of advisory fee performance does not reflect the deduction of investment advisory fees.  Our advisory fees are disclosed in Form ADV Part 2A.  Accounts managed through brokerage firm programs usually will include additional fees.  Returns are calculated monthly in U.S. dollars and include reinvestment of dividends and interest. The index is unmanaged and does not take into account fees, expenses, and transaction costs.  It is shown for comparative purposes and is based on information generally available to the public from sources believed to be reliable.  No representation is made to its accuracy or completeness.  Additional disclosures on the material risks and potential benefits of investing in corporate bonds are available on our website: https://www.cambonds.com/disclosure-statements/.

i Bloomberg January 4, 2023: Saudi Arabia Kept Oil Exports Steady in December
ii Bloomberg January 4, 2023: Fed Affirms Inflation Resolve
iii Bloomberg January 4, 2023: Economic Forecasts (ECFC)
iv JP Morgan January 3, 2023: “Default Monitor”
v Wells Fargo December 29, 2022: “Credit Flows”

16 Dec 2022

CAM High Yield Weekly Insights

Fund Flows & Issuance:  According to a Wells Fargo report, flows week to date were -$0.6 billion and year to date flows stand at -$48.5 billion.  New issuance for the week was $2.2 billion and year to date issuance is at $104.9 billion.


(Bloomberg)  High Yield Market Highlights

  • U.S. junk bonds snapped a six-day rally as yields surged 13bps to 8.45%, marking the biggest one-day loss in more than five weeks, after central banks signaled more rate hikes are needed to cool the rate of inflation.  Fed Chair Jerome Powell reiterated the central bank’s hawkish stance and said the bank is not close to ending its rate-hike campaign to tame inflation, a sentiment echoed by European Central Bank President Christine Lagarde.
  • The hawkish tilts from the FOMC and ECB reversed the more positive sentiment earlier in the week spurred by a slowdown in the consumer-price index, Barclays’s Bradley Rogoff wrote on Friday.
  • Bloomberg economists Anna Wong, David Wilcox and Eliza Winger wrote that the most striking part of the updated economic projections by the Federal Reserve “is how unified the committee is on the need to raise rates more aggressively – significantly higher than the 4.8% terminal rate markets had priced in ahead of the meeting.”
  • The losses spanned across all high yield ratings. BB yields rose 11bps to 6.77%, the biggest one- day jump in four weeks. The BB index posted the biggest one-day loss in more than five weeks and ended a six-day gaining streak.
  • CCC yields rose 13bps to 13.79%. The index posted a loss of 0.37% on Thursday, the most in more than two weeks, after gaining for five straight sessions.
  • The junk bond primary market has ground to a halt, with just a little over $2b in new bond sales month-to-date, the slowest since December 2018. The rest of the year is expected to be quiet on the new issue front as investors work on the year- end closings.


(Bloomberg)  Powell Says Fed Still Has a ‘Ways to Go’ After Half-Point Hike

  • Chair Jerome Powell said the Federal Reserve is not close to ending its anti-inflation campaign of interest-rate increases as officials signaled borrowing costs will head higher than investors expect next year.
  • “We still have some ways to go,” he told a press conference on Wednesday in Washington after the Federal Open Market Committee raised its benchmark rate by 50 basis points to a 4.25% to 4.5% target range.
  • Powell said that the size of the rate increase delivered on Feb. 1 at the Fed’s next meeting would depend on incoming data — leaving the door open to another half-percentage point move or a step down to a quarter point — and he pushed back against bets that the Fed would reverse course next year.
  • “I wouldn’t see us considering rate cuts until the committee is confident that inflation is moving down to 2% in a sustained way,” he said. “Restoring price stability will likely require maintaining a restrictive policy stance for some time,” he said.
  • “The committee anticipates that ongoing increases in the target range will be appropriate in order to attain a stance of monetary policy that is sufficiently restrictive to return inflation to 2% over time,” the FOMC said in its statement, repeating language it has used in previous communications.
  • “It is our judgment today that we are not at a sufficiently restrictive policy stance yet,” the Fed chief said. “We will stay the course until the job is done.”
  • Powell had previously signaled plans to moderate hikes, while emphasizing that the pace of tightening is less significant than the peak and the duration of rates at a high level.
  • The decision follows four consecutive 75 basis-point hikes that have boosted rates at the fastest pace since Paul Volcker led the central bank in the 1980s.


This information is intended solely to report on investment strategies identified by Cincinnati Asset Management. Opinions and estimates offered constitute our judgment and are subject to change without notice, as are statements of financial market trends, which are based on current market conditions. This material is not intended as an offer or solicitation to buy, hold or sell any financial instrument. Fixed income securities may be sensitive to prevailing interest rates. When rates rise the value generally declines. Past performance is not a guarantee of future results.

09 Dec 2022

CAM High Yield Weekly Insights

Fund Flows & Issuance:  According to a Wells Fargo report, flows week to date were -$0.3 billion and year to date flows stand at -$47.8 billion.  New issuance for the week was nil and year to date issuance is at $101.2 billion.

(Bloomberg)  High Yield Market Highlights

  • The recent rally in U.S. junk bonds has been steadily losing steam, edging lower for three consecutive sessions in the run up to a likely modest weekly loss, after warnings from bank chiefs of a slowing economy next year renewed recession fears. The losses extended across ratings as yields rose 17bps week-to-date to 8.55%.
  • Market tone has softened since mid-October, according to Barclays strategist Bradley Rogoff.
  • Focus will be on next week’s CPI data and Fed meeting for indications on future rate hikes and terminal rate expectations, wrote Rogoff on Friday.
  • The rally, though more muted this week, also opened a window for banks to offload a portion of their large hung LBO debt.
  • A group of banks found willing buyers for $750m of debt tied to the buyout of Citrix Systems.
  • Thursday end with spread levels of 446 for the high yield market. Spreads by rating:  283 for BB, 464 for B, and 983 for CCC.
  • Year-to-date the high yield index total return stands at -10.13%.


This information is intended solely to report on investment strategies identified by Cincinnati Asset Management. Opinions and estimates offered constitute our judgment and are subject to change without notice, as are statements of financial market trends, which are based on current market conditions. This material is not intended as an offer or solicitation to buy, hold or sell any financial instrument. Fixed income securities may be sensitive to prevailing interest rates. When rates rise the value generally declines. Past performance is not a guarantee of future results.

09 Dec 2022

CAM Investment Grade Weekly Insights

Investment grade credit spreads were mostly flat throughout the week without much change.  The Bloomberg US Corporate Bond Index closed at 130 on Thursday December 8 after having closed the week prior at 130.  Treasury volatility moderated this week as rates did not move materially for the first time in several weeks.  The 10yr Treasury closed the week prior at 3.49% and it is trading at 3.53% as we go to print.  Through this Thursday the Corporate Index had a YTD total return of -13.6% while the YTD S&P500 Index return was -15.6% and the Nasdaq Composite Index return was -28.8%.

The most meaningful economic data of the week was released this Friday morning.  U.S. producer prices rose more than forecast during the month of November.  This could lend credence to the case for additional Fed rate hikes but it was the smallest annual increase in PPI in 18 months so the Fed will be pleased to see that things are moving in the right direction. Also on Friday morning we learned that consumer sentiment improved and consumer concerns over inflation have eased over the course of the last month.  These data points were merely appetizers as a feast of economic data awaits us next week.  Things get started with the CPI release on Tuesday morning –if inflation comes in hotter than expected then it could make for a very volatile trading session.  On Wednesday afternoon we get an FOMC rate decision followed by rate decisions by the ECB and BOE on Thursday morning.  Each of these three central banks are expected to slow the pace of their rate hikes from 75bps to 50bps and if any of them deviate from this and surprise to the upside it could make for an interesting trading session.

The primary market had a slow week as it appears that most issuers have packed it in for the year.  Just $4.25bln in new debt was priced and if this pattern holds then it could be the lowest volume for a December in more than 15 years according to data compiled by Bloomberg.  The 2022 issuance tally stands at $1,180bln which trails 2021’s pace by ~14%.

Investment grade credit reported an inflow for the week.  Per data compiled by Wells Fargo, outflows for the week of December 1–7 were +1.0bln which brings the year-to-date total to -$160.2bln.

This information is intended solely to report on investment strategies identified by Cincinnati Asset Management. Opinions and estimates offered constitute our judgment and are subject to change without notice, as are statements of financial market trends, which are based on current market conditions. This material is not intended as an offer or solicitation to buy, hold or sell any financial instrument. Fixed income securities may be sensitive to prevailing interest rates. When rates rise the value generally declines. Past performance is not a guarantee of future results. 

02 Dec 2022

CAM Investment Grade Weekly Insights

Investment grade credit spread performance was mixed throughout the week with spreads set to finish the week slightly wider.  The Bloomberg US Corporate Bond Index closed at 132 on Thursday December 2 after having closed the week prior at 130.  Treasuries continued to exhibit the same type of volatility that we have become accustomed to in recent weeks.  The 10yr Treasury closed last week at 3.68% and it is trading at 3.55% as we go to print.  The 10yr closed above 4% as recently as November 9, so this has been a significant move lower in yield over the course of only 15 trading days.  Through this Thursday the Corporate Index had a YTD total return of -14.3% while the YTD S&P500 Index return was -13.2% and the Nasdaq Composite Index return was -26.0%.

There was plenty of economic data to parse this week.  Things really started to ramp on Wednesday with a GDP print that morning that gave market participants some hope that inflation may be turning the corner and headed lower as the numbers showed slowing personal consumption and a core PCE figure that declined in 3Q relative to 2Q.  Chairman Powell gave a speech later that day at the Brookings Institution that indicated that the Fed was set to moderate the pace of rate increases at its meeting on December 14.  This sent stocks higher and Treasury yields lower.  We were surprised by this price action as a 50 basis point hike in December should not have been seen by the market as new information.  We believe that markets for risk assets are simply too eager for the Fed pivot when in fact chair Powell has been crystal clear that the Fed will not look to ease financial conditions through rate cuts until it is obvious that inflation is headed lower, closer to its longer term target.  The Friday nonfarm payroll report was stronger than expected and showed that the labor market continued to be strong in November.  Job gains and robust wage growth are not what the Fed was hoping to see and that data gives further credence to our belief that the Fed will not be in a hurry to cut its policy rate.  An elevated policy rate for a longer time period is not problematic for bond investors as it affords an opportunity to generate more income for new money and incremental purchases but it does make this exercise more difficult when the market is so quick to see any bad news as good news, sending Treasury yields lower in the process.

The primary market had a busy week as issuers priced more than $22bln in new debt.  Amazon led the way as it printed $8.25bln across 4 tranches.  The 2022 issuance tally stands at $1,176bln which trails 2021’s pace by ~13%.

Investment grade credit reported an outflow for the week.  Per data compiled by Wells Fargo, outflows for the week of November 24–30 were -$3.9bln which brings the year-to-date total to -$161.1bln.


This information is intended solely to report on investment strategies identified by Cincinnati Asset Management. Opinions and estimates offered constitute our judgment and are subject to change without notice, as are statements of financial market trends, which are based on current market conditions. This material is not intended as an offer or solicitation to buy, hold or sell any financial instrument. Fixed income securities may be sensitive to prevailing interest rates. When rates rise the value generally declines. Past performance is not a guarantee of future results. 

02 Dec 2022

CAM High Yield Weekly Insights

Fund Flows & Issuance:  According to a Wells Fargo report, flows week to date were -$0.6 billion and year to date flows stand at -$47.5 billion.  New issuance for the week was nil and year to date issuance is at $101.2 billion.


(Bloomberg)  High Yield Market Highlights

  • U.S. junk bonds are poised to gain for the fourth straight week, the longest winning streak since mid-August, with yields tumbling to mid-September lows after Federal Reserve Chair Jerome Powell signaled on Wednesday that the central bank will likely slow the pace of interest-rate increases. The biggest gains came on Thursday, when the market saw its best advance in more than three weeks after the Fed’s favored inflation gauge posted a smaller-than-expected monthly advance and data showed a cooling in the manufacturing sector.
  • The inflation measure, the personal consumption expenditures index, rose 0.3% in October, less than the 0.4% forecast by economists.
  • The rally that followed the release Thursday drove the junk-bond market to a weekly gain of 0.88% and pushed yields down to 8.43%, a more than 11-week low.
  • The gains spanned across ratings. CCC yields fell significantly below 14% to close at 13.83%, a more than 11-week low.
  • CCCs are also headed for the fourth straight week of gains, with week-to-date returns of 0.73%. The 0.99% gains on Thursday were the biggest one-day rally in three weeks.
  • The recent rally in the junk bond market was also partly fueled by lack of supply. The primary market is expected to largely remain quiet as banks work out of the losses from this year’s leveraged buyout debt.
  • October was the slowest month for new bond sales since 2008, with a mere $3.7b. November ground to a halt after a promising start to end with a modest $9b, the slowest for that month since 2018.
  • Year-to-date supply at $95b has also been the lightest in 14 years.
  • Junk bonds are losing steam early Friday post stronger than expected employment data.


(Bloomberg)  Powell Signals Downshift Likely Next Month, More Hikes to Come

  • Chair Jerome Powell signaled the Federal Reserve will slow the pace of interest-rate increases next month, while stressing borrowing costs will need to keep rising and remain restrictive for some time to beat inflation.
  • His comments, in a speech Wednesday at the Brookings Institution in Washington, likely cement expectations for the Fed to raise interest rates by 50 basis points when they meet Dec. 13-14, following four straight 75 basis-point moves.
  • “The time for moderating the pace of rate increases may come as soon as the December meeting,” Powell said in the text of his speech. “Given our progress in tightening policy, the timing of that moderation is far less significant than the questions of how much further we will need to raise rates to control inflation, and the length of time it will be necessary to hold policy at a restrictive level.”
  • The Fed’s actions — the most aggressive since the 1980s — have lifted the target range of their benchmark rate to 3.75% to 4% from nearly zero in March. Powell said rates are likely to reach a “somewhat higher” level than officials estimated in September, when the median projection was for 4.6% next year. Those projections will be updated at the December meeting.
  • Investors see the Fed pausing hikes in the second quarter once rates reach about 5%, according to pricing in futures contracts.
  • Powell said the central bank is forecasting 12-month inflation based on its preferred gauge, the personal consumption expenditures price index, of 6% through October, and a 5% core rate.
  • There hasn’t been enough strong evidence to make a convincing case that inflation will soon decelerate, he said.
  • “It will take substantially more evidence to give comfort that inflation is actually declining,” he said. “The truth is that the path ahead for inflation remains highly uncertain.”
  • He added that “despite the tighter policy and slower growth over the past year, we have not seen clear progress on slowing inflation.”
  • Powell launched into a discussion of service costs, focusing on scarce supply in the labor market, with the gap in labor-force participation mostly explained by pandemic-era retirements in his view.
  • “These excess retirements might now account for more than 2 million of the 3 1/2 million shortfall in the labor force,” he said.
  • He said the labor market is only showing “tentative signs” of what he called “rebalancing,” while wages are “well above” levels consistent with 2% inflation over time.


This information is intended solely to report on investment strategies identified by Cincinnati Asset Management. Opinions and estimates offered constitute our judgment and are subject to change without notice, as are statements of financial market trends, which are based on current market conditions. This material is not intended as an offer or solicitation to buy, hold or sell any financial instrument. Fixed income securities may be sensitive to prevailing interest rates. When rates rise the value generally declines. Past performance is not a guarantee of future results.

10 Nov 2022

CAM Investment Grade Weekly Insights

Investment grade credit spreads were unchanged on the week until the CPI print sent spreads tighter on Thursday morning.  If this “risk-on” trade has legs, then spreads will finish the week in solidly positive territory.  The credit market is closed this Friday in observance of Veteran’s Day but equities will remain open.  The Bloomberg US Corporate Bond Index closed at 152 on Wednesday November 9 after having closed the week prior at 152.  Treasury yields are sharply lower on the week with the bulk of that move occurring after CPI at 8:30am this morning.  The 10yr Treasury closed last Friday evening at 4.16% and it is trading at 3.92% as we go to print.  Through Wednesday the Corporate Index had a YTD total return of -19.5% while the YTD S&P500 Index return was -20.3% and the Nasdaq Composite Index return was -33.4%.

It was a lighter week for economic data relative to the last few weeks due in part to the fact that there were only 4 trading days.  The big news of the week was CPI on Thursday, which was weak across the board.  Recall that the last couple of CPI prints came in hotter than expectations.  This is only one data point, so it cannot be called a trend, but it is a welcome relief to bond investors to see this number move in a favorable direction for a change.  The next CPI release is on December 13 and the next FOMC decision is on December 14.  There is also an employment report on December 2 as well as other economic data that will help guide the Fed.  It will be interesting to see if the data allows the Fed to take its foot off the gas and back off from 75bps to 50bps at its December meeting.

The primary market was extremely active this week as 28 companies issued over $45bln of new debt across just three trading days.  It is worth noting that the high yield primary market has thawed as well and it posted its busiest week since June.  There are no new investment grade deals pending as we go to print on Thursday morning.  The 2022 issuance tally stands at $1,125bln in volume which trails 2021’s pace by ~12%.

This information is intended solely to report on investment strategies identified by Cincinnati Asset Management. Opinions and estimates offered constitute our judgment and are subject to change without notice, as are statements of financial market trends, which are based on current market conditions. This material is not intended as an offer or solicitation to buy, hold or sell any financial instrument. Fixed income securities may be sensitive to prevailing interest rates. When rates rise the value generally declines. Past performance is not a guarantee of future results. 

04 Nov 2022

CAM High Yield Weekly Insights

Fund Flows & Issuance:  According to a Wells Fargo report, flows week to date were $4.7 billion and year to date flows stand at -$55.1 billion.  New issuance for the week was $1.5 billion and year to date issuance is at $93.5 billion.


(Bloomberg)  High Yield Market Highlights

  • U.S. junk bonds are set for the biggest weekly loss in six, snapping a two-week gaining streak as yields surge to 9.22% as recession fear spurred a selloff in equities and an extreme inversion in a key portion of the Treasury yield curve. The low-grade market erased most recent gains across ratings. CCCs, the riskiest of junk bonds, posted a loss of 1.04% Thursday, the biggest one-day fall in more than four months. That’s put the notes on track to end a two-week gaining stretch, with a week-to-date drop of 1.08%.
  • The October rally fueled and lured investors into junk bond market as US high-yield funds reported a cash intake of $4.7b for the week, the third biggest weekly inflow this year.
  • The cash haul came in at the time of acute shortage of new supply, bolstering secondary market prices as investors looked for new paper. The primary market was mostly quiet until this week.
  • The rally brought some relief to bankers who have long waited to clear all pending deals to fund leveraged buyout. Apollo’s Tenneco was the first to get out of the gate earlier this week. Nielsen Holdings, a US TV rating business firm, kicked off a bond sale Wednesday to fund its buyout by Elliott Investment Management and Brookfield Asset Management.
  • Satellite TV company Dish Network also jumped into the market Wednesday to start marketing 5-year notes to fund the build-out of wireless infrastructure, among other purposes.
  • The rally was sapped after the Federal Reserve signaled a higher terminal rate against a backdrop of slowing growth.
  • Despite continued near-term  pressures Morgan Stanley expects a “significant deceleration in the inflation path” to take hold by mid-2023, Morgan Stanley’s Srikanth Sankaran wrote last week.


(Bloomberg)  Powell Sees Higher Peak for Rates, Path to Slow Tempo of Hikes

  • Federal Reserve Chair Jerome Powell opened a new phase in his campaign to regain control of inflation, saying US interest rates will go higher than earlier projected, but the path may soon involve smaller hikes.
  • Addressing reporters Wednesday after the Fed raised rates by 75 basis points for the fourth time in a row, Powell said “incoming data since our last meeting suggests that ultimate level of interest rates will be higher than previously expected.”
  • Powell said it would be appropriate to slow the pace of increases “as soon as the next meeting or the one after that. No decision has been made,” he said, while stressing that “we still have some ways” before rates were tight enough.
  • “It is very premature to be thinking about pausing,” he said.
  • The Federal Open Market Committee said that “ongoing increases” will still likely be needed to bring rates to a level that are “sufficiently restrictive to return inflation to 2% over time,” in fresh language added to their statement after a two-day meeting in Washington.
  • The Fed’s unanimous decision lifted the target for the benchmark federal funds rate to a range of 3.75% to 4%, its highest level since 2008.
  • “Slower for longer,” declared JP Morgan Chase & Co, chief US economist Michael Feroli in a note to clients. “The Fed opened the door to dialing down the size of the next hike but did so without easing up financial conditions.”
  • Officials, as expected, said they will continue to reduce their holdings of Treasuries and mortgage-backed securities as planned.
  • The higher rates go, the harder the Fed’s job becomes. Having been criticized for missing the stubbornness of the inflation surge, officials know that monetary policy works with a lag and that the tighter it becomes the more it not only slows inflation, but economic growth and hiring too.
  • Still, Powell stressed that they would not blink in their efforts to get inflation back down to their 2% target.
  • “The historical record cautions strongly against prematurely loosening policy,” he said. “We will stay the course, until the job is done.”
  • Fed forecasts in September implied a 50 basis points move in December, according to the median projection. Those projections showed rates reaching 4.4% this year and 4.6% next year, before cuts in 2024. Powell’s remarks made clear that the peak signaled in that projection would be higher if it came at this meeting.
  • No fresh estimates were released at this meeting and they won’t be updated again until officials gather Dec. 13-14, when they will have two more months of data on employment and consumer inflation in hand.


This information is intended solely to report on investment strategies identified by Cincinnati Asset Management. Opinions and estimates offered constitute our judgment and are subject to change without notice, as are statements of financial market trends, which are based on current market conditions. This material is not intended as an offer or solicitation to buy, hold or sell any financial instrument. Fixed income securities may be sensitive to prevailing interest rates. When rates rise the value generally declines. Past performance is not a guarantee of future results.