(Bloomberg) High Yield Market Highlights
- A back-and-forth start to the year has continued this week for the US junk bond market, which rose last week after starting 2024 with a loss.
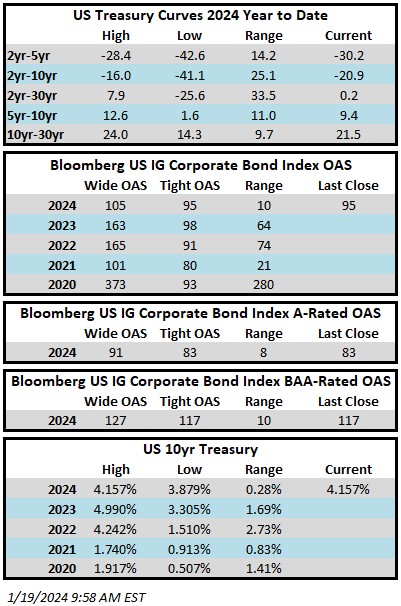
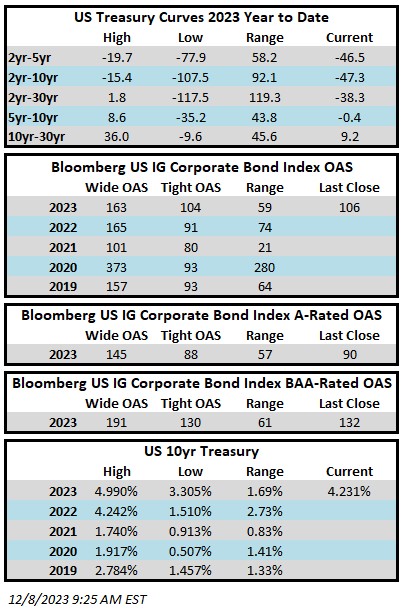
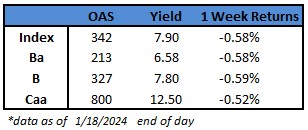
- Yields have climbed 19 basis points since last Friday to 7.90%, following a week of robust economic data on retail sales, housing sentiment, industrial production and unemployment claims. The readings renewed concerns that the Federal Reserve may delay easing interest-rate policy, with investors paring rate-cut bets and Treasury yields climbing.
- High-yield’s losses gained legs as Fed Governor Christopher Waller’s comments Tuesday signaled the central bank isn’t in a hurry to cut rates
- Atlanta Fed President Raphael Bostic joined the chorus Thursday, urging policymakers to proceed cautiously toward rate cuts
- At the same time, strong data supported the soft landing narration and bolstered views that a recession is unlikely
- US borrowers crowded the primary market during this holiday-shortened week as yields are still below 8% and spreads are under 350 basis points
- More than $5.5b of deals were priced, putting January’s total above $12b and at 60% of volume in the opening month of 2023
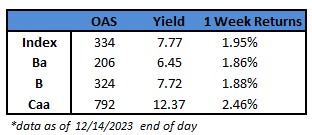
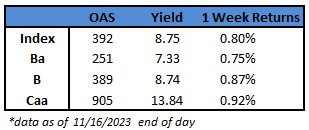
- Junk bond yields climbed across ratings. BB yields jumped 18 basis points week-to-date to 6.58%
(Bloomberg) Waller Urges Cutting Rates ‘Carefully’ If Inflation Cools
- Federal Reserve Governor Christopher Waller said the US central bank should take a cautious and systematic approach when it begins cutting interest rates, a process that can start this year absent a rebound in inflation.
- “As long as inflation doesn’t rebound and stay elevated, I believe the FOMC will be able to lower the target range for the federal funds rate this year,” Waller said at a virtual event hosted by the Brookings Institution on Tuesday.
- “When the time is right to begin lowering rates, I believe it can and should be lowered methodically and carefully,” he added.
- The Fed governor offered some of the most detailed remarks to date around the Fed’s intentions to ease policy this year. While Waller showed an openness to cutting rates, his comments also appeared to push back against market expectations for as many as six rate cuts this year.
- “With economic activity and labor markets in good shape and inflation coming down gradually to 2%, I see no reason to move as quickly or cut as rapidly as in the past,” he said, pointing to previous economic shocks that have precipitated rapid rate cuts.
- Treasury yields jumped in the wake of Waller’s comments. Traders pared back the probability of a rate cut as soon as March as well as the degree of total policy rate declines seen for the full year.
- He said the timing of cuts and the actual number “will depend on the incoming data.”
- Waller’s remarks highlighted his intention to balance risks to both sides of the Fed’s mandate and avoid staying restrictive for too long, while also not beginning to reduce rates before their 2% inflation goal was secure. He noted that he needs to see a moderation in consumption and hiring as well as continued low readings on monthly inflation data to bolster the case for a cut.
- While Waller said he’s becoming more confident that policymakers are “within striking distance” of reaching their 2% inflation target, “I will need more information in the coming months confirming or (conceivably) challenging the notion that inflation is moving down sustainably toward our inflation goal.”
- If policymakers see a continuation in the trends seen in the real data and inflation data, “we can slowly calibrate the real rate cut down,” he said. “If we think we need to move it faster, we can move it faster depending on what the data says. But the key is we have the flexibility that we can be methodical and careful.”
- He added that once the Fed is relatively convinced that inflation is sustainably near the central bank’s 2% target, policymakers can “start thinking how fast we want to cut, or how long, what the pace is, or how big.”
- As for the central bank’s balance sheet, Waller said it would be reasonable to start thinking about slowing the pace of asset runoff “some time this year.”
- While Waller’s language suggested he favors starting rate cuts sooner rather than later, his comments also weren’t “a ringing endorsement” for a March cut, Bank of America’s Michael Gapen wrote. Instead, he said, the key takeaway of Waller’s speech related to the pace of easing.
- Economists at Goldman Sachs also noted that Waller’s remarks “raise the risk that the first cut could come slightly later than our forecast of March and that the pace of cuts could be quarterly from the outset.”
This information is intended solely to report on investment strategies identified by Cincinnati Asset Management. Opinions and estimates offered constitute our judgment and are subject to change without notice, as are statements of financial market trends, which are based on current market conditions. This material is not intended as an offer or solicitation to buy, hold or sell any financial instrument. Fixed income securities may be sensitive to prevailing interest rates. When rates rise the value generally declines. Past performance is not a guarantee of future results.