Category: Insight

03 Nov 2023

CAM Investment Grade Weekly Insights

Credit spreads moved tighter for the second consecutive week.  The Bloomberg US Corporate Bond Index closed at 125 on Thursday November 2 after having closed the week prior at 128.  The 10yr is trading a 4.55% as we go to print Friday morning, 28 basis points lower on the week and 38 basis points lower since Tuesday evening.  Through Thursday, the Corporate Index YTD total return was -0.03%.


Economics

What a difference a few days make.  Markets for risk assets were relatively weak and listless as we closed things out on Tuesday Halloween eve but as we sit here Friday morning we are in the midst of the “Goldilocks” trade where both equities and bonds are simultaneously enjoying gains.  It was an action packed week with data from the Bank of Japan, U.S. Treasury Refunding, the Fed and then, last but not least, a U.S. employment report on Friday morning.   Here is a brief summary of the impact on markets:

BoJ – The Japanese central bank elected to keep its loose monetary policy intact.  The JGB 10yr continues to trade near its highest level in a decade in anticipation of a hiking cycle and the Yen fell to a 33yr low.  If the BoJ does eventually elect to tighten policy it could well result in higher yields across the globe, but markets are enjoying the reprieve for now.

UST Refunding – The Treasury announced that its upcoming auctions would be smaller than originally anticipated for longer dated maturities.  Investors took this as a positive and yields started to come in on intermediate and long duration Treasuries.

FOMC – The Fed kept rates stable, which is what the market expected.  The FOMC acknowledged tightening financial conditions.  Both the statement and the press conference were less hawkish than they have been recently.  Risk assets generally liked the result.

U.S. NFP – Lower than expected job numbers along with a revision lower for the prior month.  The unemployment rate climbed to 3.9% which is near its highest level in 2-years.

Taking it all together, investors now see a ~25% chance of another hike by January and have fully priced in a cut by June.[i]  We believe investment grade credit continues to offer an attractive value proposition.

Issuance

It was a busy week of issuance with weekly volume topping $30bln with one IG-rated deal pending on Friday morning.  Most of the volume this week came on Monday as 12 borrowers priced $22.5bln.  With Treasury yields moving lower throughout the latter half of this week we would expect next week to be a strong one for issuance and desks on the street agree with forecasts calling for as much as $40bln.

Flows

According to Refinitiv Lipper, for the week ended November 1, investment-grade bond funds reported a net outflow of -$2.760bln.  Flows for the full year are net positive +$13.667bln.

[i] Bloomberg, November 3rd 2020, “Wall Street Revives ‘Goldilocks’ Trade After Data: Markets Wrap”


This information is intended solely to report on investment strategies identified by Cincinnati Asset Management. Opinions and estimates offered constitute our judgment and are subject to change without notice, as are statements of financial market trends, which are based on current market conditions. This material is not intended as an offer or solicitation to buy, hold or sell any financial instrument. Fixed income securities may be sensitive to prevailing interest rates. When rates rise the value generally declines. Past performance is not a guarantee of future results.
03 Nov 2023

CAM High Yield Weekly Insights

(Bloomberg)  High Yield Market Highlights

  • US junk bonds scored the biggest one-day gains in nine months, driving yields lower across ratings a day after Federal Reserve Chair Jerome Powell hinted the central bank may now be finished with the most aggressive tightening cycle in four decades. The Fed implied that the recent run-up in long-term Treasury yields reduced the impetus to raise rates again. 10-year Treasury yields dropped by another eight basis points to 4.66%.
  • The gains in the US junk bond market spanned across ratings after US labor productivity advanced by the most in three years, softening the inflationary impact of rising wages. CCCs, the riskiest tier of the high yield market, notched the biggest one-day gains since early February. Spreads ended the six-day widening streak and narrowed 50 basis points to 925, the biggest drop in three weeks.
  • Bloomberg economists led by Anna Wong reiterated that the FOMC policy statement was dovish overall in the post meeting review on Thursday. Fed officials have not interpreted the strong third-quarter growth numbers as a blowout suggesting that the Federal Reserve was inclined to go on an “ extended rate pause”.
  • The Fed held interest-rates steady at 5.25%-5.5% range in the face of tightening financial and credit conditions. However, Powell’s dovish pivot based on market tightening may effectively loosen financial conditions, Barclays strategists Bradley Rogoff and Dominique Toublan wrote in a Friday note.
  • Average speculative-grade yields fell 31 basis points to 9.06%, the biggest one-day drop in more than four months.
  • Riskiest junk bonds yields tumbled by 49 basis points to 14.21%.
  • BBs rallied to record the biggest one-day returns in almost 12 months, with gains of 1.11% on Thursday. BB yields closed at 7.54%, a five-week low.


(Bloomberg)  US Jobs Data Show Broad Cooling After Run of Surprise Strength

  • US job growth slowed by more than expected and the unemployment rate rose to an almost two-year high of 3.9%, indicating that employers’ strong demand for workers is beginning to cool.
  • Nonfarm payrolls increased 150,000 in October following downward revisions to the prior two months, a Bureau of Labor Statistics report showed Friday. Monthly wage growth slowed.
  • The latest figures suggest some cracks are beginning to form in a jobs market that has been gradually normalizing, thanks to an improvement in labor supply over the past year and a tempering in the pace of hiring.
  • The rise in the unemployment rate points to a pickup in layoffs — a development employers had so far broadly avoided. The survey of households showed a more than 200,000 increase in those who lost their job or completed a temporary one.
  • As investors judged it more likely the Federal Reserve is finished with its run of interest-rate hikes, traders marked down chances of a rate increase in coming months and boosted bets on an earlier cut next year.
  • Health care and social assistance, as well as government, drove the payrolls gain. Other categories, however, showed tepid growth or outright declines. Manufacturing payrolls fell by 35,000 in October, largely a reflection of the United Auto Workers union strike. The hit will prove temporary though, given union members have since struck tentative deals with the nation’s largest automakers.
  • Easing demand for workers is putting downward pressure on wage growth. Average hourly earnings rose 0.2% last month and were up 4.1% from a year earlier, the smallest annual advance since mid-2021. Earnings for nonsupervisory employees, who make up the majority of workers, increased 0.3% for a second month.
  • The jobs report is composed of two surveys: one of households and one of businesses. While both showed signs of weakening, the households poll was particularly concerning, due to rising unemployment, declining participation and a drop in the number of employed workers.
  • The smaller gain in payrolls, combined with slower wage growth and a drop in hours worked, led a broad measure of labor market health to stagnate. Moreover, a gauge of take-home pay declined by the most since the start of 2022.


This information is intended solely to report on investment strategies identified by Cincinnati Asset Management. Opinions and estimates offered constitute our judgment and are subject to change without notice, as are statements of financial market trends, which are based on current market conditions. This material is not intended as an offer or solicitation to buy, hold or sell any financial instrument. Fixed income securities may be sensitive to prevailing interest rates. When rates rise the value generally declines. Past performance is not a guarantee of future results.
27 Oct 2023

CAM Investment Grade Weekly Insights

Credit spreads moved tighter this week on the back of mostly positive earnings reports and muted primary supply.  The Bloomberg US Corporate Bond Index closed at 127 on Thursday October 26 after having closed the week prior at 130.  The 10yr is trading a 4.85% as we go to print Friday morning, higher by 6 basis points on the week.  Through Thursday, the Corporate Index YTD total return was -1.46%.

Economics

The data this week was largely positive and it painted a broad picture of a U.S. economy that remains resilient in the face of tightening financial conditions.  Some of the positive highlights this week included a +12.3% advance in new home sales (the largest increase in over a year), a Q3 U.S. GDP print that came in at a +4.9% annualized pace (at one point last year some economists had this as a negative print!) and then finally on Friday, we got a real personal spending number for September that came in at +0.4%.  It isn’t all peaches and cream though, for a few reasons.  As it relates to housing, mortgage rates remain stubbornly high and that is unlikely to change in a “higher for longer” environment.  This will continue to take its toll on existing home sales as fewer and fewer people will move residences, which casts a ripple effect through the economy. As far as consumer spending was concerned, we also got income numbers, and after adjusting for inflation, real income dipped for the fourth consecutive month in September.  There may be some excess savings still sloshing around in some pockets of the consumer economy but spending is unlikely to continue to increase if this trend of declining real income continues. Last but not least, we still have the potential for increased conflict in the middle east which can have wide ranging effects on commodity markets and risk assets.

Putting it altogether, the market concensus is that the FOMC keeps the benchmark rate steady at its meeting next Wednesday.  Interest rate futures are currently pricing in almost no chance of a hike/cut next week but pricing imples a +20.4% chance of a hike at the December meeting.

Issuance

It was a quiet week for issuance with just $5.8bln priced through Thursday with one deal pending on Friday morning which could to push the total closer to $7bln relative to expectations of about $20bln.  Even though it was a sizeable miss relative to estimates it is not too surprising given that we are in the heart of earnings season –1 or 2 large potential issuers that are lurking on the sidelines could have easily pushed the total north of $20bln.  Syndicate desks are calling for $15-$20bln of new supply next week. Year-to-date issuance is just north of $1 trillion, coming in at $1,035bln through Thursday.

Flows

According to Refinitiv Lipper, for the week ended October 25, investment-grade bond funds reported a net outflow of -$1.790bln.  October has been a tough month for bond funds with $5.9bln in outflows so far.  Flows for the full year are net positive +$16.426bln.


This information is intended solely to report on investment strategies identified by Cincinnati Asset Management. Opinions and estimates offered constitute our judgment and are subject to change without notice, as are statements of financial market trends, which are based on current market conditions. This material is not intended as an offer or solicitation to buy, hold or sell any financial instrument. Fixed income securities may be sensitive to prevailing interest rates. When rates rise the value generally declines. Past performance is not a guarantee of future results.
27 Oct 2023

CAM High Yield Weekly Insights

(Bloomberg)  High Yield Market Highlights

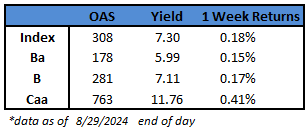
  • US junk bond yields rose for the second day in a row and spreads widened 11 basis points to an almost four-month high of 431, driving modest losses for the second consecutive session. Losses were tempered as 10-year Treasury yields slid from near 5% last week to 4.85% on Thursday, driving modest gains for week ended Friday.
  • Sliding Treasury yields in the aftermath of stronger-than-expected growth led to modest gains for the week across the high-yield market. Yields have dropped eight basis points week-to-date, while returns sit at 0.38% for the same period.
  • CCC yields, the riskiest part of the junk bond market, climbed 12 basis points on Thursday to close near 14%, a seven-month high.
  • Steadily climbing yields and strong growth renewed concerns about rates staying higher for longer pushing nervous investors to pull cash out of US high yield funds.
  • US high-yield funds reported outflows of $942m for week ended Oct. 25, the seventh straight week of cash exits.
  • Rising yields and Treasury volatility this month kept borrowers on the sidelines.
  • The month-to-date volume is a little more than $8b. The week-to-date volume is a modest $2.24b.


This information is intended solely to report on investment strategies identified by Cincinnati Asset Management. Opinions and estimates offered constitute our judgment and are subject to change without notice, as are statements of financial market trends, which are based on current market conditions. This material is not intended as an offer or solicitation to buy, hold or sell any financial instrument. Fixed income securities may be sensitive to prevailing interest rates. When rates rise the value generally declines. Past performance is not a guarantee of future results.
23 Oct 2023

2023 Q3 Investment Grade Quarterly

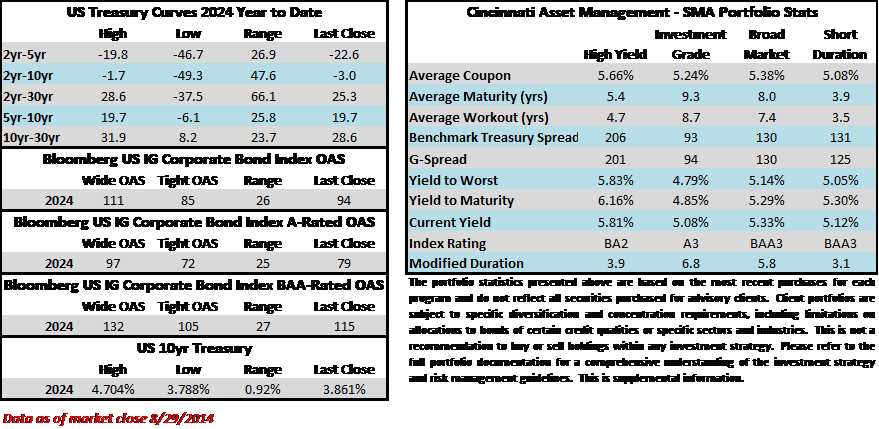
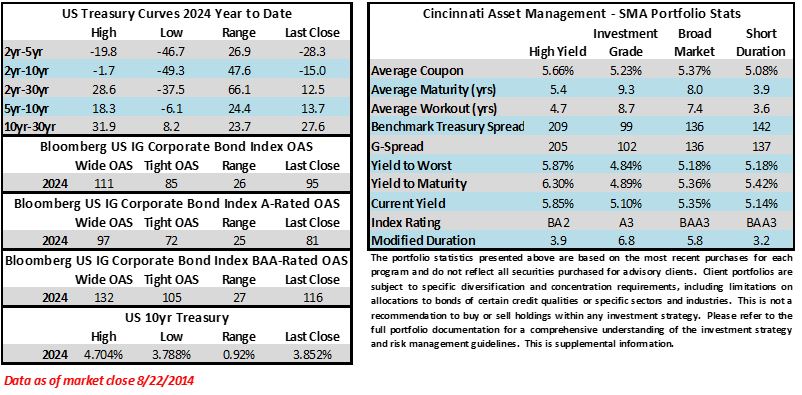
Click here to read the Spanish version / Haga clic aquí para leer la versión en español. Investment grade credit spreads were tighter during the third quarter, but Treasury yields moved higher, which acted as a meaningful headwind for returns.  During the quarter, the Option Adjusted Spread (OAS) on the Bloomberg US Corporate Bond Index tightened by 2 basis points to 121 after opening the period at 123.  Intermediate Treasury curves steepened during the period, with relatively little change in the 2yr Treasury, while the 5yr and 10yr Treasury yields moved significantly higher.   Higher rates are bad news for short term returns, but for the long run, curve steepening is something that we like to see as it creates a friendlier environment for bond investors.  Positive sloping curves maximize the efficiency and return potential of a bond rolling down the yield curve as it approaches maturity.

The Corporate Index posted a quarterly total return of -3.09%.  CAM’s Investment Grade Program net of fees total return for the quarter was -2.36%.  Year-to-date total returns remained positive for both the index and CAM through quarter end.

Market Update

The yield to maturity (YTM) for the Bloomberg U.S. Corporate Index ended the quarter at 6.04%.  Here are some statistics to provide context:

  • The 5yr average YTM was 3.48%. The index closed >6% fewer than 0.7% of trading days.
  • The 10yr average YTM was 3.38%. The index closed >6% fewer than 0.4% of trading days.
  • The 15yr average YTM was 3.69%. The index closed >6% fewer than 5.2% of trading days.
  • The 20yr average YTM was 4.12%. The index closed >6% fewer than 7.6% of trading days.

With yields near cycle highs and company fundamentals in solid shape, we think that IG credit offers an attractive value proposition.  We also believe that downside for the asset class is limited at these elevated yields.  Treasury yields could go higher from here or there could be a hard landing that might send credit spreads wider, but the impact of those moves on returns is diminished when the starting point is a >6% yield, which provides meaningful cushion for bond investors.

We believe credit spreads were fairly valued at quarter end.  The OAS on the index finished the quarter at 121 relative to its 5 and 10 year averages of 123 and 124, respectively.  Investors are cautious about the direction of the U.S. economy which is why we believe that further spread tightening from current levels could be difficult.  However, there are a couple of scenarios that could drive spreads tighter: 1.) The yield curve continues to steepen to the point that it is no longer inverted and/or 2.) Inflation continues to decline coincident with a soft landing for the U.S. economy.  There is a third scenario as well, which contemplates a lack of new bond supply into year-end which could create a supply/demand mismatch: if new issuance is insufficient to satisfy investor demand, then secondary spreads could grind tighter in the absence of negative economic data.  Conversely, spreads could go wider if tight monetary policy tips the economy into a recession.  We believe the most likely outcome is that spreads will trade within a relatively tight range until there is more certainty among investors regarding the direction of the economy and inflation expectations.  Bottom line, with elevated Treasury yields and fair compensation for credit risk, we believe investment grade credit remains attractive.

Asset Allocation – Stocks vs. Bonds

Throughout 2023, Treasuries have climbed higher, while equities have continued to chug along, posting impressive returns.  This price action has brought the concept of the equity risk premium (ERP) into to the spotlight.  The ERP is the extra return that an investor earns from stocks compared to bonds for taking additional risk in the equity market.  To put it in mathematical terms, the ERP is the difference between the S&P 500’s earnings yield and the yield on the 10yr Treasury.  The following ERP chart is expressed in terms of basis points.

Currently, the ERP is at its lowest level at any point in the past 20 years.  Does this strengthen the case for investment grade bonds, which earn a spread in excess of the risk free rate?  We think so, but it is worth noting that the ERP can go negative – it was deeply negative for an extended period during the dot-com bubble period of 1998 into early 2001.

Cash Remains Attractive, But Less So

The most frequent question we have continued to field from individual investors over the course of the past year goes something like this.

“Yields at 6% look great to me, but why would I allocate to intermediate corporate bonds when I can buy a 2-year Treasury at 5% or an 18 month CD at 5.25%?”

To be clear, we think that investors should absolutely be taking advantage of dislocation at the front end of the yield curve, but they should not do so at the expense of their longer term goals.  These high short rates are a phenomenon of the Fed hiking cycle and the inverted curve could dissipate quickly when the Fed reverses course.  An investor that over-allocates to the front end of the curve puts themselves at risk of missing out on larger returns slightly further out the curve.  The goal for most investors should be to allocate their portfolio in a manner that benefits from elevated short term rates while maintaining an exposure to the intermediate part of the yield curve so that the portfolio can reap the rewards of a curve that eventually re-steepens from its current inverted state. An investor that waits for the first Fed rate cut or waits for this trade to be obvious could miss out on a lot of low hanging fruit as far as returns are concerned.

The subject of reinvestment risk remains highly topical in our conversations with investors. Please reach out to one of our client consultants if you would like to discuss this further or you can view some of our past content here.

Corporate Credit Curve – A Waiting Game

The corporate credit curve is integral to our strategy at CAM.  The following graph shows the change from the beginning of the year through the end of the third quarter for both the Treasury curve and the corporate yield curve.  Our focus at CAM is on intermediate maturities that range from 5 to 10 years.

Both corporate and Treasury curves have moved much higher so far in 2023.  It is important to note that while the Treasury curve has remained inverted, the corporate curve has maintained its steepness.  For example, even though the 5/10 Treasury curve was inverted by -4bps at quarter end, an investor could expect to earn +21bps in additional yield (on average) by extending from a 5yr corporate bond to a 10yr corporate bond.  This equates to a 5/10 corporate credit curve of +25bps.   For our existing investors, we are currently holding some maturities longer than we would typically – as we are patiently waiting for the corporate credit curve to steepen.  A steeper curve allows us to extract more value for our investors from extension trades.  As the Fed tightening cycle reaches its logical conclusion, we expect steepening in both the underlying Treasury curve and the corporate credit curve.  As these curves steepen, investors that have been with us for some time will start to see us resume our extension trades.  The following graph from the St. Louis Fed provides a good illustration of how much steeper the corporate credit curve has been for most of the past decade relative to where it is today.

The Fed – Are We There Yet?

The Federal Reserve delivered a +0.25% hike at its July meeting, but held rates steady at its September meeting.  The Fed meets two more times this year, the first day of November and again in mid-December.  The FOMC’s dot plot shows an expectation of one more +25bp hike this year and -50bps worth of cuts next year.  At quarter-end, investors were assigning a 39.1% probability of an additional rate hike by year-end according to Fed Funds Futures.

The Fed message has been consistent lately, hammering home the “higher for longer” mantra.  We don’t believe that it is particularly meaningful if the Fed hikes once more or even twice.  Instead, we think bond investors should rejoice at the likelihood that the Fed may finally be near the end of its hiking cycle.

Keep Grinding

It was a quarter to forget for IG credit returns but the longer term value proposition remains.  Even despite massive movement in Treasuries the asset class has remained in positive territory year-to-date.  We will continue to manage your capital to the best of our ability, searching for superior risk adjusted returns amid an increasingly volatile landscape.  Thank you for your continued interest and confidence.

This information is intended solely to report on investment strategies identified by Cincinnati Asset Management. Opinions and estimates offered constitute our judgment and are subject to change without notice, as are statements of financial market trends, which are based on current market conditions. This material is not intended as an offer or solicitation to buy, hold or sell any financial instrument.  Fixed income securities may be sensitive to prevailing interest rates.  When rates rise the value generally declines.  Past performance is not a guarantee of future results.  Gross of advisory fee performance does not reflect the deduction of investment advisory fees.  Our advisory fees are disclosed in Form ADV Part 2A.  Accounts managed through brokerage firm programs usually will include additional fees.  Returns are calculated monthly in U.S. dollars and include reinvestment of dividends and interest. The index is unmanaged and does not take into account fees, expenses, and transaction costs.  It is shown for comparative purposes and is based on information generally available to the public from sources believed to be reliable.  No representation is made to its accuracy or completeness. 
 

The information provided in this report should not be considered a recommendation to purchase or sell any particular security.  There is no assurance that any securities discussed herein will remain in an account’s portfolio at the time you receive this report or that securities sold have not been repurchased.  The securities discussed do not represent an account’s entire portfolio and in the aggregate may represent only a small percentage of an account’s portfolio holdings.  It should not be assumed that any of the securities transactions or holdings discussed were or will prove to be profitable, or that the investment decisions we make in the future will be profitable or will equal the investment performance of the securities discussed herein.


Additional disclosures on the material risks and potential benefits of investing in corporate bonds are available on our website:
https://www.cambonds.com/disclosure-statements/.

22 Oct 2023

COMENTARIO DEL TERCER TRIMESTRE

Los diferenciales de crédito con grado de inversión fueron más ajustados durante el tercer trimestre, pero los rendimientos de los bonos del Tesoro subieron, lo que actuó como un importante obstáculo para la rentabilidad.  Durante el trimestre, el diferencial ajustado por opciones (Option Adjusted Spread, OAS) en el índice de bonos corporativos de EE. UU. de Bloomberg se redujo en 2 puntos básicos y llegó a 121 después de haber abierto el año con un OAS de 123.  Las curvas de los bonos del Tesoro intermedio se inclinaron durante el período, con relativamente pocas variaciones en los bonos del Tesoro a 2 años, mientras que los rendimientos de los bonos del Tesoro a 5 y 10 años subieron significativamente.   Las tasas más altas son malas noticias para los rendimientos a corto plazo, pero a largo plazo, la inclinación de la curva es algo que nos gusta ver, ya que crea un entorno más amigable para los inversores en bonos.  Las curvas con pendiente positiva maximizan la eficiencia y el potencial de rendimiento de un bono que avanza hacia abajo en la curva de rendimiento a medida que se acerca al vencimiento.

El índice corporativo registró un rendimiento total de todo el trimestre de -3.09 %.  La rentabilidad total neta de comisiones del programa de grado de inversión de Cincinnati Asset Management, Inc. (CAM) fue del -2.36 %.  Los rendimientos totales el último año se mantuvieron positivos tanto para el índice como para el CAM hasta el final del trimestre.

Actualización de mercado

El rendimiento al vencimiento (yield to maturity, YTM) del índice Bloomberg U.S. Corporate cerró el trimestre en 6.04 %.  Aquí hay algunas estadísticas para proporcionar contexto:


  • El YTM promedio a 5 años fue del 3.48 %.  El índice cerró >6 % menos del 0.7 % de los días hábiles.
  • El YTM promedio a 10 años fue del 3.38 %.  El índice cerró >6 % menos del 0.4 % de los días hábiles.
  • El YTM promedio a 15 años fue del 3.69 %.  El índice cerró >6 % menos que el 5.2 % de los días hábiles.
  • El YTM promedio a 20 años fue del 4.12 %.  El índice cerró >6 % menos que el 7.6 % de los días hábiles.


Con los rendimientos cerca de los máximos del ciclo y las situaciones fundamentales de las empresas en buena forma, creemos que el crédito IG ofrece una propuesta de valor atractiva.  También creemos que la desventaja para la clase de activos es limitada debido a estos elevados rendimientos.  Los rendimientos del Tesoro podrían subir a partir de aquí o podría haber un aterrizaje forzoso que podría ampliar los diferenciales de crédito, pero el impacto de esos movimientos en los rendimientos disminuye cuando el punto de partida es un rendimiento >6 %, lo que proporciona un colchón significativo para los inversores en bonos.

Creemos que los diferenciales de crédito estaban valorados de forma justa al final del trimestre.  La OAS en el índice terminó el trimestre en 121 en relación con sus promedios de 5 y 10 años de 123 y 124, respectivamente.  Los inversores son cautelosos respecto de la dirección de la economía estadounidense, por lo que creemos que podría resultar difícil un mayor ajuste de los diferenciales desde los niveles actuales.  Sin embargo, existen un par de escenarios que podrían hacer que los diferenciales se ajusten más: 1.) La curva de rendimiento continúa aumentando hasta el punto de que ya no está invertida y/o 2.) La inflación continúa cayendo, coincidiendo con un aterrizaje suave para la economía de EE. UU.  Existe también un tercer escenario, que contempla una falta de oferta de nuevos bonos hasta finales de año, lo que podría crear un desajuste entre la oferta y la demanda: si las nuevas emisiones son insuficientes para satisfacer la demanda de los inversores, entonces los diferenciales secundarios podrían reducirse en ausencia de datos económicos negativos.  Por el contrario, los diferenciales podrían ampliarse si una política monetaria restrictiva lleva a la economía a una recesión.  Creemos que el resultado más probable es que los diferenciales se negocien dentro de un rango relativamente estrecho hasta que haya más certeza entre los inversores sobre la dirección de la economía y las expectativas de inflación.  En resumen, con rendimientos elevados del Tesoro y una compensación justa por el riesgo crediticio, creemos que el crédito con grado de inversión sigue siendo atractivo.

Asignación de activos: acciones frente a bonos

A lo largo de 2023, los bonos del Tesoro han subido más, mientras que las acciones han seguido avanzando, registrando rendimientos impresionantes.  Esta acción del precio ha puesto de relieve el concepto de prima de riesgo de acciones (equity risk premium, ERP).  La ERP es el rendimiento adicional que un inversor obtiene de las acciones en comparación con los bonos por asumir un riesgo adicional en el mercado de valores.  Para decirlo en términos matemáticos, la ERP es la diferencia entre el rendimiento de las ganancias del S&P 500 y el rendimiento del Tesoro a 10 años.  El siguiente gráfico de la ERP está expresado en términos de puntos básicos.

Actualmente, la ERP se encuentra en su nivel más bajo en cualquier momento de los últimos 20 años.  ¿Fortalece esto el argumento a favor de los bonos con grado de inversión, que obtienen un diferencial superior a la tasa libre de riesgo?  Creemos que sí, pero vale la pena señalar que la ERP puede volverse negativo; fue profundamente negativo durante un período prolongado durante el período de la burbuja de las puntocom de 1998 hasta principios de 2001.

El efectivo sigue siendo atractivo, pero no tanto

La pregunta más frecuente que hemos seguido recibiendo de inversores individuales durante el año pasado es algo como esto.  

“Los rendimientos al 6 % me parecen fantásticos, pero ¿por qué debería asignarlos a bonos corporativos intermedios cuando puedo comprar un Tesoro a dos años al 5 % o un CD a 18 meses al 5.25 %?” 

Para ser claros, creemos que los inversores deberían aprovechar la dislocación en el extremo inicial de la curva de rendimiento, pero no deberían hacerlo a expensas de sus objetivos a más largo plazo.  Estas tasas altas a corto plazo son un fenómeno del ciclo de subidas de tipos de la Reserva Federal y la curva invertida podría disiparse rápidamente cuando la Reserva Federal cambie de rumbo.  Un inversor que asigna en exceso al extremo inicial de la curva corre el riesgo de perder rendimientos mayores un poco más allá de la curva.  El objetivo para la mayoría de los inversores debe ser asignar su cartera de manera que se beneficie de tasas altas a corto plazo y al mismo tiempo mantener una exposición a la parte intermedia de la curva de rendimiento para que la cartera pueda cosechar los beneficios de una curva que eventualmente se vuelve a empinar de su estado invertido actual.  Un inversor que espere el primer recorte de tipos de la Reserva Federal o espere a que esta operación sea obvia podría perderse muchos frutos maduros en lo que a rentabilidad se refiere.

El tema del riesgo de reinversión sigue siendo de gran actualidad en nuestras conversaciones con los inversores. Comuníquese con uno de nuestros asesores de clientes si desea discutir esto más a fondo o si puede ver parte de nuestro contenido anterior aquí.

Curva de crédito corporativo: un juego de espera

La curva de crédito corporativo es parte integral de nuestra estrategia en CAM.  El siguiente gráfico muestra la variación desde principios de año hasta finales del tercer trimestre tanto para la curva del Tesoro como para la curva de rendimiento corporativo.  Nuestro enfoque en CAM está en vencimientos intermedios que van de 5 a 10 años.

Tanto las curvas corporativas como las del Tesoro han subido mucho en lo que va de 2023.  Es importante señalar que, si bien la curva del Tesoro se ha mantenido invertida, la curva corporativa ha mantenido su pendiente.  Por ejemplo, aunque la curva del Tesoro 5/10 se invirtió -4pb al final del trimestre, un inversor podría esperar ganar +21pb en rendimiento adicional (en promedio) al extender desde un bono corporativo a 5 años a un bono corporativo a 10 años.  Esto equivale a una curva de crédito corporativo 5/10 de +25pb.   Para nuestros inversores actuales, actualmente mantenemos algunos vencimientos más largos de lo habitual, ya que estamos esperando pacientemente a que la curva de crédito corporativo se intensifique.  Una curva más pronunciada nos permite extraer más valor para nuestros inversores de las operaciones de extensión.  A medida que el ciclo de ajuste de la Reserva Federal llegue a su conclusión lógica, esperamos un aumento tanto en la curva del Tesoro subyacente como en la curva de crédito corporativo.  A medida que estas curvas se profundicen, los inversores que han estado con nosotros durante algún tiempo empezarán a vernos reanudar nuestras operaciones de extensión.  El siguiente gráfico de la Reserva Federal de St. Louis ofrece un buen ejemplo de cuánto más pronunciada ha sido la curva de crédito corporativo durante la mayor parte de la última década en relación con su situación actual.

La Reserva Federal: ¿ya llegamos a ese punto?

La Reserva Federal aumentó los tipos un +0.25 % en su reunión de julio, pero mantuvo los tipos estables en su reunión de septiembre.  La Reserva Federal se reúne dos veces más este año, el primer día de noviembre y nuevamente a mediados de diciembre.  El gráfico de puntos del FOMC muestra una expectativa de un aumento más de +25pb este año y recortes de -50pb el próximo año.  Al final del trimestre, los inversores asignaban una probabilidad del 39.1 % a una subida adicional de tipos para finales de año, según Fed Funds Futures. 

El mensaje de la Reserva Federal ha sido coherente últimamente, recalcando el mantra de “más alto por más tiempo”.  No creemos que sea especialmente significativo que la Reserva Federal suba las tasas una vez más, o incluso dos veces.  En cambio, creemos que los inversores en bonos deben alegrarse ante la probabilidad de que la Reserva Federal finalmente esté cerca del final de su ciclo de subidas de tipos.

Seguir trabajando duro

Fue un trimestre para olvidar para los rendimientos del crédito IG, pero la propuesta de valor a largo plazo permanece.  Incluso a pesar del movimiento masivo de los bonos del Tesoro, la clase de activos se ha mantenido en territorio positivo en el último año.  Continuaremos administrando su capital lo mejor que podamos, buscando rendimientos superiores ajustados al riesgo en medio de un panorama cada vez más volátil.  Gracias por su continuo interés y confianza.

Esta información solo tiene el propósito de dar a conocer las estrategias de inversión identificadas por Cincinnati Asset Management. Las opiniones y estimaciones ofrecidas están basadas en nuestro criterio y están sujetas a cambios sin previo aviso, al igual que las declaraciones sobre las tendencias del mercado financiero, que dependen de las condiciones actuales del mercado. Este material no tiene como objetivo ser una oferta ni una solicitud para comprar, mantener ni vender instrumentos financieros.  Los valores de renta fija pueden ser vulnerables a las tasas de interés vigentes.  Cuando las tasas aumentan, el valor suele disminuir.  El rendimiento pasado no es garantía de resultados futuros.  El rendimiento bruto de la tarifa de asesoramiento no refleja la deducción de las tarifas de asesoramiento de inversión.  Nuestras tarifas de asesoramiento se comunican en el Formulario ADV Parte 2A.  En general, las cuentas administradas mediante programas de firmas de corretaje incluyen tarifas adicionales.  Los rendimientos se calculan mensualmente en dólares estadounidenses e incluyen la reinversión de dividendos e intereses. El índice no está administrado y no considera las tarifas de la cuenta, los gastos y los costos de transacción.  Se muestra con fines comparativos y se basa en información generalmente disponible al público tomada de fuentes que se consideran confiables.  No se hace ninguna afirmación sobre su precisión o integridad.  


La información proporcionada en este informe no debe considerarse una recomendación para comprar o vender ningún valor en particular.  No hay garantía de que los valores que se tratan en este documento permanecerán en la cartera de una cuenta en el momento en que reciba este informe o que los valores vendidos no hayan sido vueltos a comprar.  Los valores de los que se habla no representan la cartera completa de una cuenta y, en conjunto, pueden representar solo un pequeño porcentaje de las tenencias de cartera de una cuenta.  No debe suponerse que las transacciones de valores o tenencias analizadas fueron o demostrarán ser rentables, o que las decisiones de inversión que tomemos en el futuro serán rentables o igualarán el rendimiento de la inversión de los valores discutidos en este documento.


En nuestro sitio web se encuentran disponibles las divulgaciones adicionales sobre los riesgos materiales y los posibles beneficios de invertir en bonos corporativos: https://www.cambonds.com/disclosure-statements/.

20 Oct 2023

CAM Investment Grade Weekly Insights

Barring a stunning reversal, investment grade credit spreads will finish the week solidly wider.  The Bloomberg US Corporate Bond Index closed at 129 on Thursday October 19 after having closed the week prior at 124.  The 10yr is trading a 4.93% as we go to print Friday morning, higher by 32 basis points from the previous Friday close.  Through Thursday, the Corporate Index YTD total return was -2.53%.

Economics

It was a mixed bag for economic data this week.   The biggest surprise came on Tuesday which brought a Retail Sales print that defied expecations to the upside and painted a picture of a strong consumer that continued to spend in September.  On the other hand, housing related data remained sluggish.  Wednesday showed that US mortgage applications hit a 28-year low.  This was not a surprise, as mortgage rates flirted with 8% during the week while Thursday saw the 10yr Treasury close at 4.99%, its highest level since July of 2007.  Housing starts did show some signs of life, increasing by 7% during the month of September but overall homebuilder sentiment hit a 9-month low.  It is clear that, although housing prices have remained resilient, higher mortgage rates are having an impact on the housing market as whole.  Last but not least, WTI crude traded above $90 a barrel on Friday morning as traders fear war escalation in the middle east.

Issuance

It was a solid week for issuance, with banks leading the way, as the market digested $26bln in new supply.  New issue concessions were near 12bps on average this week, which are higher than they have been for some time –we like to see this as investors.  Next week, forecasts are calling for $15-$20bln of new debt, a more muted figure as companies continue to work through earnings.

Flows

According to Refinitiv Lipper, for the week ended October 18, investment-grade bond funds reported a net outflow of -$2.31bln.  October has been a tough month for bond funds with $5.9bln in outflows so far.  Flows for the full year are net positive +$18.2bln.


This information is intended solely to report on investment strategies identified by Cincinnati Asset Management. Opinions and estimates offered constitute our judgment and are subject to change without notice, as are statements of financial market trends, which are based on current market conditions. This material is not intended as an offer or solicitation to buy, hold or sell any financial instrument. Fixed income securities may be sensitive to prevailing interest rates. When rates rise the value generally declines. Past performance is not a guarantee of future results.
20 Oct 2023

CAM High Yield Weekly Insights

(Bloomberg)  High Yield Market Highlights


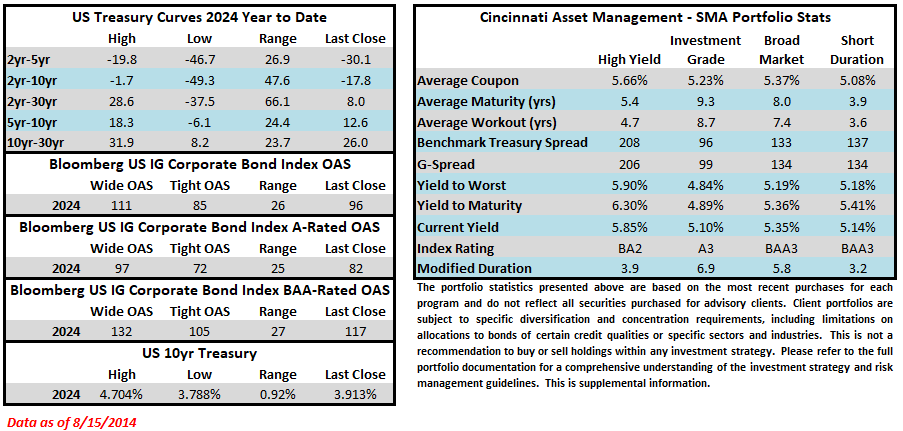
  • US junk bond yields rose for the third day in a row to an almost 12-month high of 42%, driving losses for the fourth straight session on concerns over the Middle East conflict and the potential impact of “restrictive rates” on corporate balance sheets.
  • Yields rose and losses extended across the US high yield market. Junk bonds are headed toward ending the week with a loss of more than 1%. The week-to-date loss stands at 1.07%. Losses were reinforced after Federal Reserve Bank of New York President John Williams said on Wednesday that interest rates will have to stay at restrictive levels “for some time,” a day after stronger-than-expected economic reports.
  • BB yields soared for the fourth day in a row to a more than three-year high of 8.13%, driving week-to-date losses to 1.11%, the most since the week ended Feb 10, after steadily falling for four sessions this week.
  • Single B yields jumped to a new four-month high of 9.65%.
  • CCC yields surged to near 14% — closing at 13.81% driving Thursday’s loss to 0.42%, the sixth consecutive session of losses. The week-to-date losses are at 1.15%.
  • Fed Chair Powell said while the US central bank was inclined to hold interest rates steady, “decisions about additional policy firming and how long to stay restrictive will be based on totality of incoming data, evolving outlook, and the balance of risks,” signaling that the Fed was open to raising rates at least one more time should the data show strong resilience.
  • Economic data this week has been pretty robust. Thursday’s jobless claims data dropped to the lowest since January.
  • Economic growth projections have been revised upwards and recession odds reduced materially.
  • The economy probably expanded at an annualized 3.5% rate in the third quarter, the fastest in nearly two years as economists in the latest Bloomberg monthly survey marked up their estimates for gross domestic product.
  • Besides raising interest rates, the Federal Reserve is also shrinking its balance sheet, sending long term rates to their highest level. This will continue for another a couple of years, pushing rates higher, wrote Bill Dudley earlier this week.
  • Rising yields, renewed concerns about “restrictive rates” after robust macro data, and the eruption of tensions in the Middle East kept US borrowers away from the market. The primary market has priced a modest $6.7b month-to-date.
  • Central banks have broadly been emphasizing that rates will stay higher for longer, triggering investor worries that “something will eventually break” in credit markets, Goldman Sachs strategists including Lotfi Karoui and Ben Shumway wrote in a note.
  • Higher-for-longer rates would translate to a more persistent drag on growth from tighter financial conditions. The ability of corporate borrowers to adjust to this shift without a significant uptick in financial distress remains a key concern, the strategists wrote.
  • Goldman analysts revised their recommendation yesterday. They suggest investors should be underweight CCCs and overweight single Bs.


This information is intended solely to report on investment strategies identified by Cincinnati Asset Management. Opinions and estimates offered constitute our judgment and are subject to change without notice, as are statements of financial market trends, which are based on current market conditions. This material is not intended as an offer or solicitation to buy, hold or sell any financial instrument. Fixed income securities may be sensitive to prevailing interest rates. When rates rise the value generally declines. Past performance is not a guarantee of future results.
13 Oct 2023

CAM High Yield Weekly Insights

(Bloomberg)  High Yield Market Highlights

  • US junk bonds snapped a five-day winning streak to post the biggest one-day loss in more than a week on Thursday. Yields soared for the second straight session to 9.10% after US consumer prices climbed for a second month, bolstering speculation that the Federal Reserve may keep the doors open for another interest-rate hike this year. After a run-up in US Treasury yields since the last Fed meeting in September, the path for monetary policy seems less clear, causing junk bond yields to spike.
  • Losses extended across the high-yield market. CCC- bond yields, the riskiest of junk bonds, rose 15 basis points on Thursday to 13.39%, driving a loss of 0.3%, snapping the four-day gaining streak.
  • Climbing yields and steady losses turned cautious investors away from the asset class. US high yield investors pulled $2.45b out of US junk bond funds for week ended Oct. 11, the third consecutive week of outflows.
  • Investors withdrew almost $7.5b in just three weeks – week ended Sept. 27, Oct. 4 and Oct. 11.
  • The recent rally began after the Fed officials reiterated earlier this week that the US central bank does not need to raise interest rates as the recent surge in yields did the job. Junk bonds may rebound from these losses as the market digests the recent assurance by Fed officials.
  • Federal Reserve Bank of Atlanta President Raphael Bostic reiterated earlier this week that the US central bank doesn’t need to keep raising interest rates unless inflation picks up again, or remains around its current pace.
  • Federal Reserve Bank of Boston President Susan Collins said the Federal Reserve was taking a more patient approach as rates are at or near their peak.  She is the fourth Fed official to ease concerns about a further hike in interest-rates.
  • The minutes of the Fed meeting in September also noted that the risks for central bank are two sided, with overtightening and inflation both presenting potential problems.
  • The recent macro positive data and Federal Reserve signaling patience may keep spreads from widening further, Barclays wrote in a Friday note.
  • A 9% yield in the high yield market is an attractive level, and this may prevent spreads from widening materially, Barclays added.
  • The broader rebound earlier in the week lured US borrowers back to the market to take advantage of risk-on sentiment.
  • The primary market priced about $2b this week, driving the year-to-date supply to $136.4b.


(Bloomberg)  Bonds Fall as CPI Boosts Fed-Hike Wagers

  • The so-called core consumer price index, which excludes food and energy costs, increased 0.3% last month. From a year ago, it rose 4.1%, the lowest since 2021. Economists favor the core gauge as a better indicator of underlying inflation than the overall CPI. That measure climbed 0.4%, boosted by energy costs. Forecasters had called for a 0.3% monthly advance in both the overall and core measures.
  • While swap contracts continue to anticipate a Fed pivot to rate cuts next year, that outcome was assigned somewhat lower odds.
  • “Bottom line: the Fed can likely pause in November, though it’s a close call, and it remains too soon to consider cuts,” said Don Rissmiller at Strategas.
  • Yet some analysts and traders don’t think the report was surprising enough to move the needle, especially after a raft of Fed officials speaking this week said the rout in bond markets may suspend the need to tighten further for now.
  • Fed Governor Christopher Waller noted Wednesday the US central bank can watch and see what happens before taking further action with interest rates as financial markets tighten. Vice Chair Philip Jefferson on Monday said he would “remain cognizant of the tightening in financial conditions through higher bond yields.” And Dallas Fed President Lorie Logan indicated that if risk premiums in the bond market are on the rise, that “could do some of the work of cooling the economy for us, leaving less need for additional monetary policy tightening.”


This information is intended solely to report on investment strategies identified by Cincinnati Asset Management. Opinions and estimates offered constitute our judgment and are subject to change without notice, as are statements of financial market trends, which are based on current market conditions. This material is not intended as an offer or solicitation to buy, hold or sell any financial instrument. Fixed income securities may be sensitive to prevailing interest rates. When rates rise the value generally declines. Past performance is not a guarantee of future results.
08 Oct 2023

2023 Q3 High Yield Quarterly

In the third quarter of 2023, the Bloomberg US Corporate High Yield Index (“Index”) return was 0.46% bringing the year to date (“YTD”) return to 5.86%.  The S&P 500 index return was -3.27% (including dividends reinvested) bringing the YTD return to 13.06%.  Over the period, while the 10 year Treasury yield increased 73 basis points, the Index option adjusted spread (“OAS”) widened 4 basis points moving from 390 basis points to 394 basis points.

All ratings segments of the High Yield Market participated in the spread widening as BB rated securities widened 12 basis points, B rated securities widened 1 basis point, and CCC rated securities widened 10 basis points.  The chart below from Bloomberg displays the spread moves in the Index over the past five years.  For reference, the average level over that time period was 414 basis points.

The sector and industry returns in this paragraph are all Index return numbers.  The Index is mapped in a manner where the “sector” is broader with the more specific “industry” beneath it.  For example, Energy is a “sector” and the “industries” within the Energy sector include independent energy, integrated energy, midstream, oil field services, and refining.  The Banking, Brokerage, and Other Financial sectors were the best performers during the quarter, posting returns of 3.18%, 2.56%, and 1.96%, respectively.  On the other hand, Electric Utilities, Transportation, and REITs were the worst performing sectors, posting returns of -0.97%,  -0.69%, and -0.46%, respectively.  At the industry level, oil field services, cable, and independent energy all posted the best returns.  The oil field services industry posted the highest return of 3.40%.  The lowest performing industries during the quarter were office REITs, healthcare REITs, and health insurance.  The office REITs industry posted the lowest return of -5.32%.

While there was a dearth of issuance during 2022 as interest rates rapidly increased and capital structures were previously refinanced, the primary market perked up a bit during each quarter this year.  Issuance has remained low by historical standards as so much was pushed out by the large issuance during 2020 and 2021.  Of the issuance that did take place during Q3, Energy took 21% of the market share followed by Discretionary at 17% share and Healthcare at a 12% share.

The Federal Reserve did lift the Target Rate by 0.25% at the July meeting but took a pause at the September meeting.  There was no meeting held in August.  This was the second rate pause, the first being June of this year, during the current 525 basis points hiking cycle that began in March of 2022.  A few of the main takeaways from the September meeting and press conference:  inflation is still too high, the job market is still too tight, the Fed is just about done with the rate hikes, the Fed remains data dependent but expects rates to stay higher for longer.  “We’re fairly close, we think, to where we need to get,” Chair Powell said.  “We are committed to achieving and sustaining a stance of monetary policy that is sufficiently restrictive to bring inflation down to our 2% goal over time,” Powell said at a press conference following the decision.i  Inflation gauges are certainly off their peaks and moving in the proper direction.  The most recent report for Core CPI showed a year over year growth rate of 4.3% down from a peak of 6.6% one year ago.  Further, the most recent Core PCE growth rate measured 3.9% off the peak of 5.6% from February of 2022.

Intermediate Treasuries increased 73 basis points over the quarter, as the 10-year Treasury yield was at 3.84% on June 30th, and 4.57% at the end of the third quarter.  The 5-year Treasury increased 45 basis points over the quarter, moving from 4.16% on June 30th, to 4.61% at the end of the third quarter.  Intermediate term yields more often reflect GDP and expectations for future economic growth and inflation rather than actions taken by the FOMC to adjust the target rate.  The revised second quarter GDP print was 2.1% (quarter over quarter annualized rate).  Looking forward, the current consensus view of economists suggests a GDP for 2023 around 2.1% with inflation expectations around 4.1%.ii

Being a more conservative asset manager, Cincinnati Asset Management does not buy CCC and lower rated securities.  Additionally, our interest rate agnostic philosophy keeps us generally positioned in the five to ten year maturity timeframe.  During Q3, Index performance was once again tilted toward the lowest rated end of the market.  Further, Index performance was heavily tilted toward short duration as all duration buckets over a three year duration underperformed.  Our credit selections within the consumer sectors and aerospace/defense were also a drag to performance.  Benefiting our performance this quarter were our overweights in banking and energy, and our credit selections in airlines and independent energy.

The Bloomberg US Corporate High Yield Index ended the third quarter with a yield of 8.88%.  Treasury volatility, as measured by the Merrill Lynch Option Volatility Estimate (“MOVE” Index), has picked up quite a bit the past couple of years.  The MOVE has averaged 121 during 2023 relative to a 62 average over 2021.  However, the current rate of 113 is well below the spike near 200 back in March during the banking scare. Data available through August shows 33 defaults during 2023 which is up from 16 defaults during all of 2022.  The trailing twelve month dollar-weighted default rate is 1.86%.iii The current default rate is relative to the 1.10%, 1.14%, 1.30%, 1.74% default rates from the previous four quarter end data points listed oldest to most recent.  While defaults are ticking up, the fundamentals of high yield companies still look good.  From a technical view, fund flows were negative in the quarter at -$1.8 billion and total -$27.9 billion YTD.iv No doubt there are risks, but we are of the belief that for clients that have an investment horizon over a complete market cycle, high yield deserves to be considered as part of the portfolio allocation.

The data dependent Fed will continue to remain a large part of the story as 2023 works its way toward year end.  The data will in fact continue to flow as Congress averted a government shutdown with a last minute agreement.  Had the shutdown taken place, some of the data the Fed looks to would not have been available.  In reality, Congress just kicked the can down the road to buy less than two months of additional time to work on a more substantial funding package.  Adding to the current wall of worry are 10 year rates that are at 15 year highs, oil has ripped higher by $20 per barrel over the past three months, and cracks are seemingly starting to show for the US Consumer.  Credit card delinquencies are at the highest level in more than a decade, and a recent report from Moody’s stated, “consumer debt quality is declining.”  Our exercise of discipline and credit selectivity is important as we continue to evaluate that the given compensation for the perceived level of risk remains appropriate.  As always, we will continue our search for value and adjust positions as we uncover compelling situations.  Finally, we are very grateful for the trust placed in our team to manage your capital.

This information is intended solely to report on investment strategies identified by Cincinnati Asset Management. Opinions and estimates offered constitute our judgment and are subject to change without notice, as are statements of financial market trends, which are based on current market conditions. This material is not intended as an offer or solicitation to buy, hold or sell any financial instrument.  Fixed income securities may be sensitive to prevailing interest rates.  When rates rise the value generally declines.  Past performance is not a guarantee of future results.  Gross of advisory fee performance does not reflect the deduction of investment advisory fees.  Our advisory fees are disclosed in Form ADV Part 2A.  Accounts managed through brokerage firm programs usually will include additional fees.  Returns are calculated monthly in U.S. dollars and include reinvestment of dividends and interest. The index is unmanaged and does not take into account fees, expenses, and transaction costs.  It is shown for comparative purposes and is based on information generally available to the public from sources believed to be reliable.  No representation is made to its accuracy or completeness.  Additional disclosures on the material risks and potential benefits of investing in corporate bonds are available on our website: https://www.cambonds.com/disclosure-statements/.

i Bloomberg September 20, 2023:  Fed Leaves Rates Unchanged

ii Bloomberg October 2, 2023: Economic Forecasts (ECFC)

iii Moody’s September 15, 2023:  August 2023 Default Report and data file

iv CreditSights September 28, 2023:  “Credit Flows”