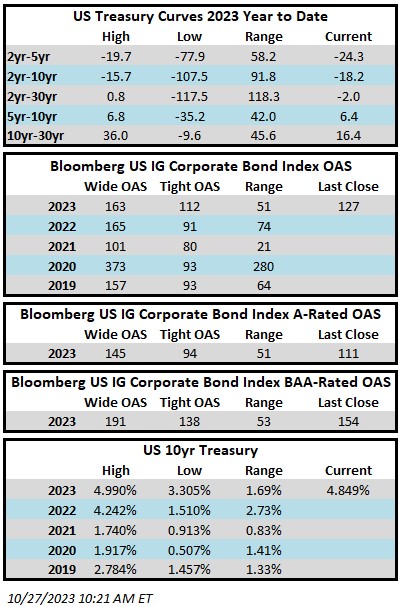
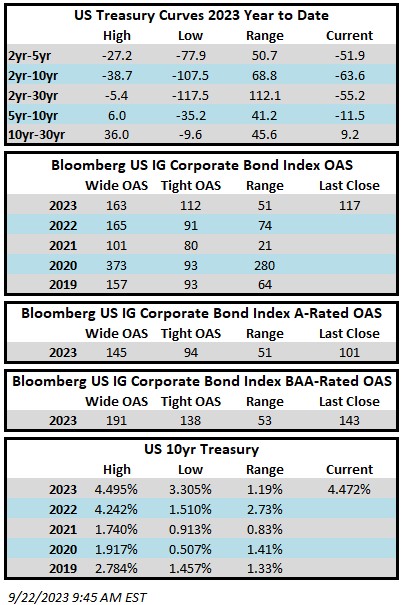
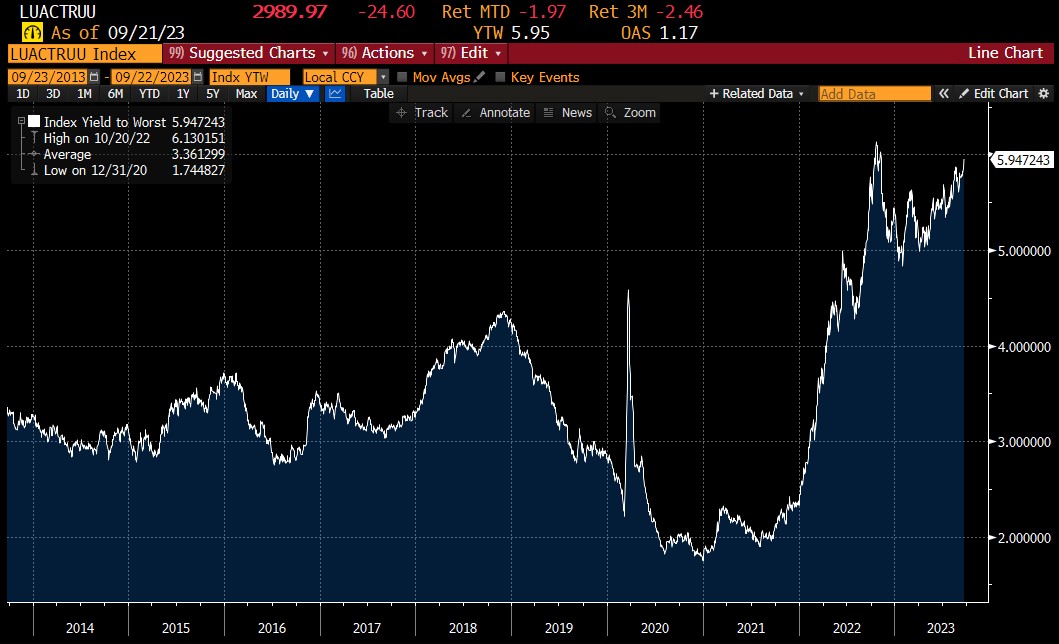
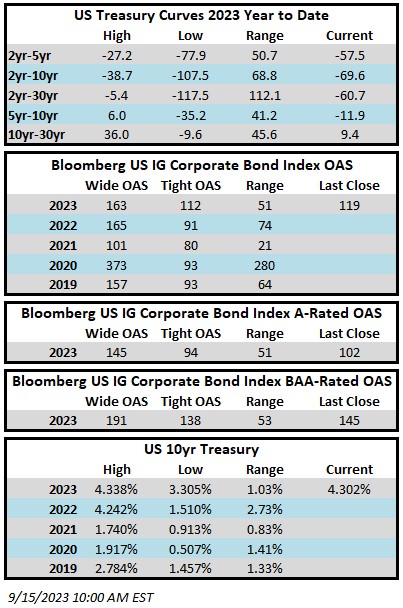
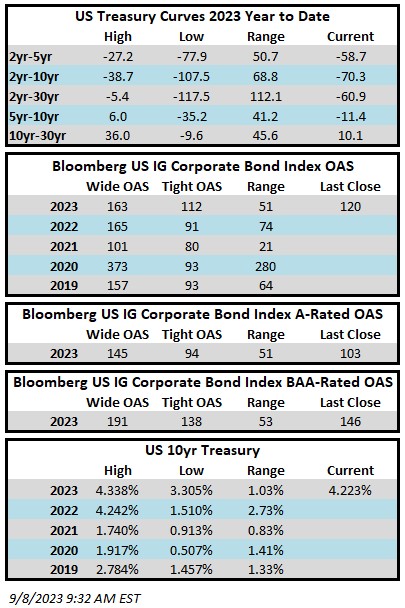
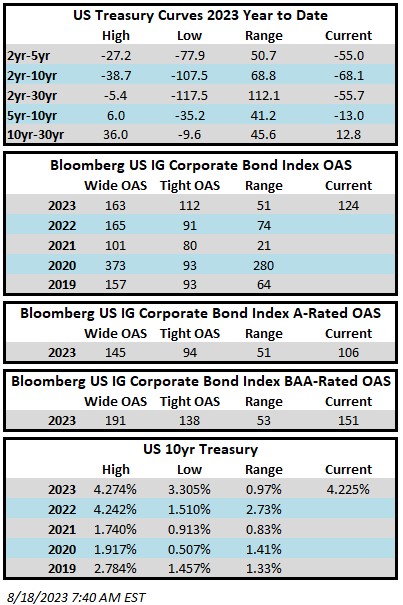
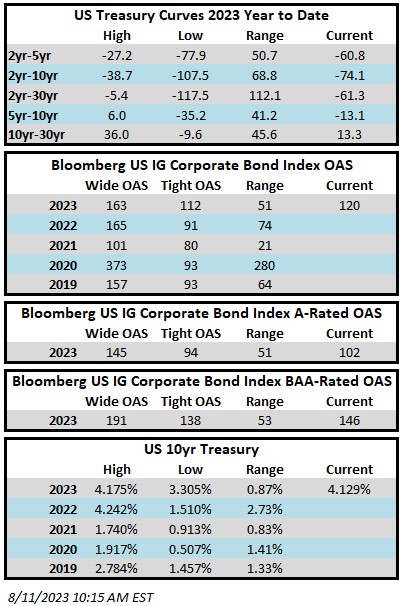
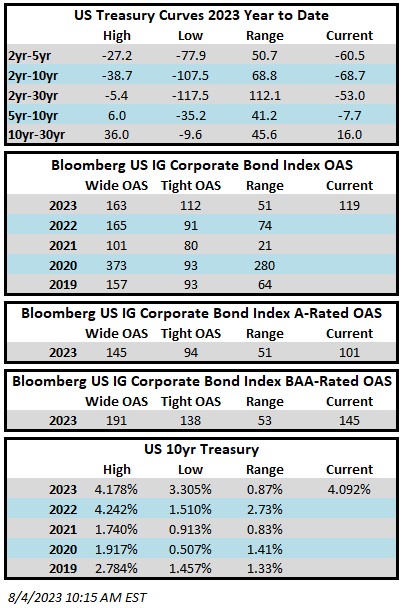
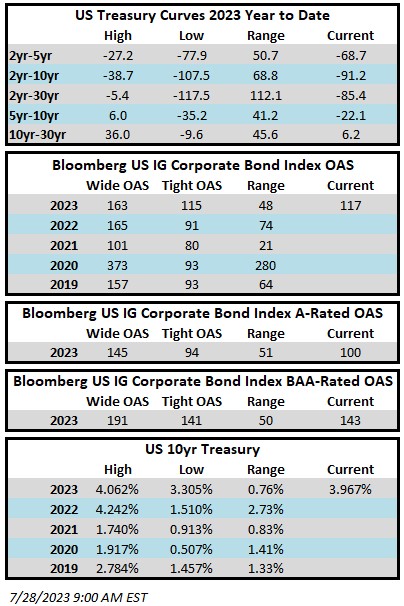
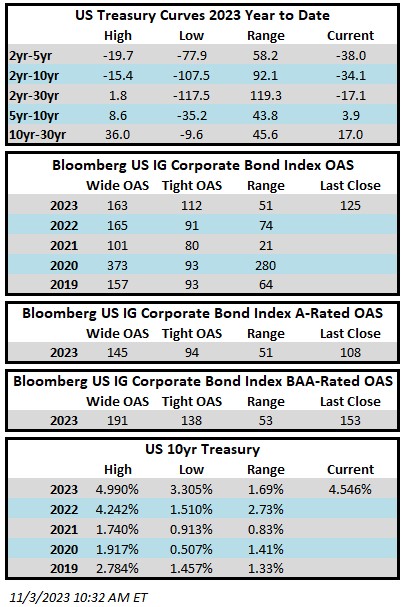
Credit spreads moved tighter for the second consecutive week. The Bloomberg US Corporate Bond Index closed at 125 on Thursday November 2 after having closed the week prior at 128. The 10yr is trading a 4.55% as we go to print Friday morning, 28 basis points lower on the week and 38 basis points lower since Tuesday evening. Through Thursday, the Corporate Index YTD total return was -0.03%.
Economics
What a difference a few days make. Markets for risk assets were relatively weak and listless as we closed things out on Tuesday Halloween eve but as we sit here Friday morning we are in the midst of the “Goldilocks” trade where both equities and bonds are simultaneously enjoying gains. It was an action packed week with data from the Bank of Japan, U.S. Treasury Refunding, the Fed and then, last but not least, a U.S. employment report on Friday morning. Here is a brief summary of the impact on markets:
BoJ – The Japanese central bank elected to keep its loose monetary policy intact. The JGB 10yr continues to trade near its highest level in a decade in anticipation of a hiking cycle and the Yen fell to a 33yr low. If the BoJ does eventually elect to tighten policy it could well result in higher yields across the globe, but markets are enjoying the reprieve for now.
UST Refunding – The Treasury announced that its upcoming auctions would be smaller than originally anticipated for longer dated maturities. Investors took this as a positive and yields started to come in on intermediate and long duration Treasuries.
FOMC – The Fed kept rates stable, which is what the market expected. The FOMC acknowledged tightening financial conditions. Both the statement and the press conference were less hawkish than they have been recently. Risk assets generally liked the result.
U.S. NFP – Lower than expected job numbers along with a revision lower for the prior month. The unemployment rate climbed to 3.9% which is near its highest level in 2-years.
Taking it all together, investors now see a ~25% chance of another hike by January and have fully priced in a cut by June.[i] We believe investment grade credit continues to offer an attractive value proposition.
Issuance
It was a busy week of issuance with weekly volume topping $30bln with one IG-rated deal pending on Friday morning. Most of the volume this week came on Monday as 12 borrowers priced $22.5bln. With Treasury yields moving lower throughout the latter half of this week we would expect next week to be a strong one for issuance and desks on the street agree with forecasts calling for as much as $40bln.
Flows
According to Refinitiv Lipper, for the week ended November 1, investment-grade bond funds reported a net outflow of -$2.760bln. Flows for the full year are net positive +$13.667bln.
[i] Bloomberg, November 3rd 2020, “Wall Street Revives ‘Goldilocks’ Trade After Data: Markets Wrap”
This information is intended solely to report on investment strategies identified by Cincinnati Asset Management. Opinions and estimates offered constitute our judgment and are subject to change without notice, as are statements of financial market trends, which are based on current market conditions. This material is not intended as an offer or solicitation to buy, hold or sell any financial instrument. Fixed income securities may be sensitive to prevailing interest rates. When rates rise the value generally declines. Past performance is not a guarantee of future results.
