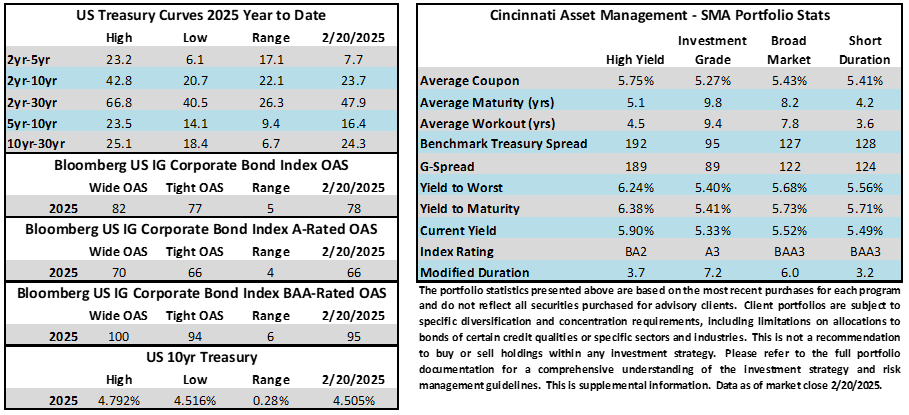
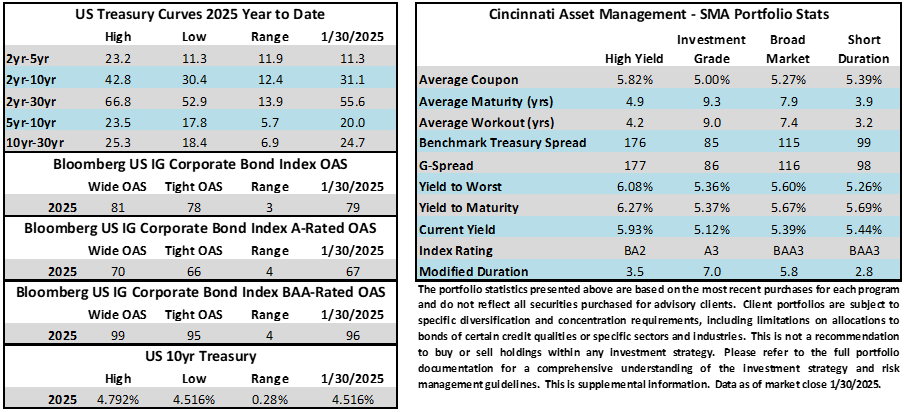
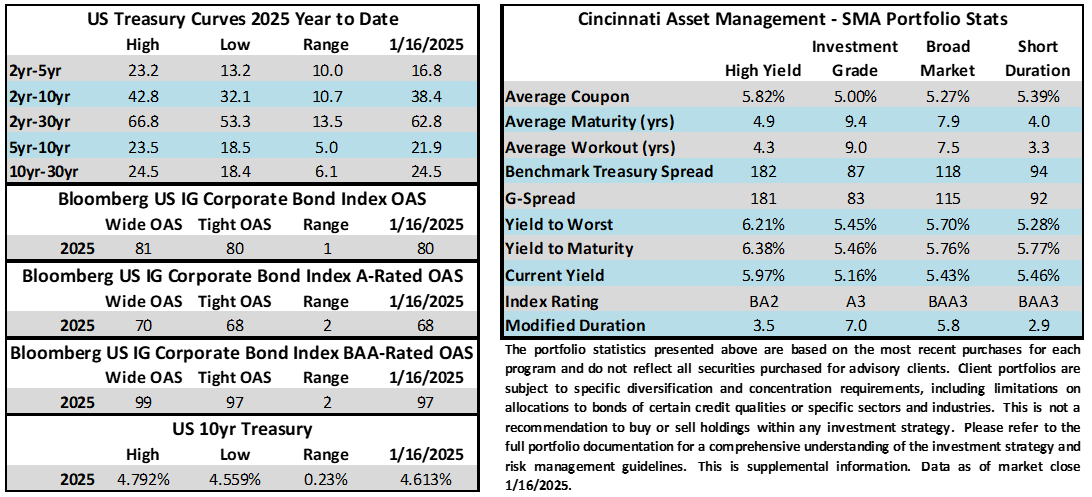
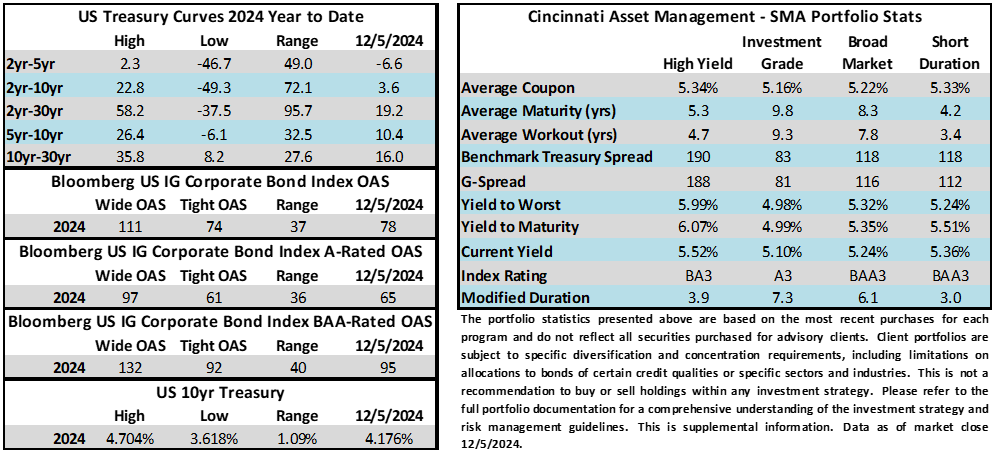
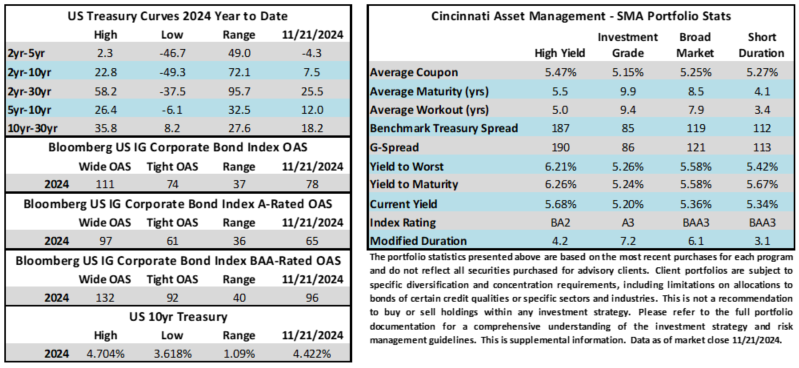
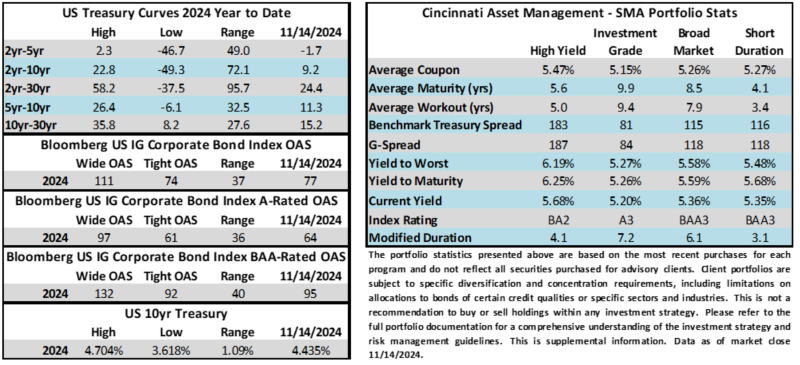
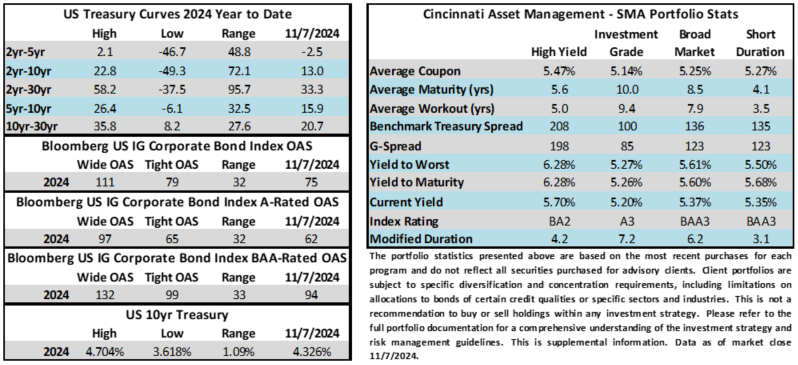
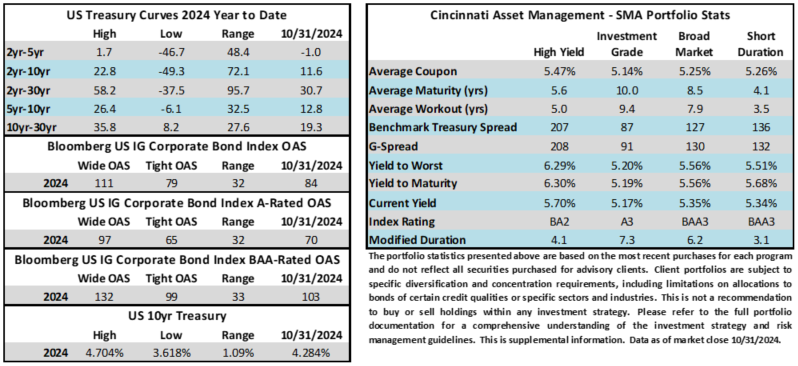
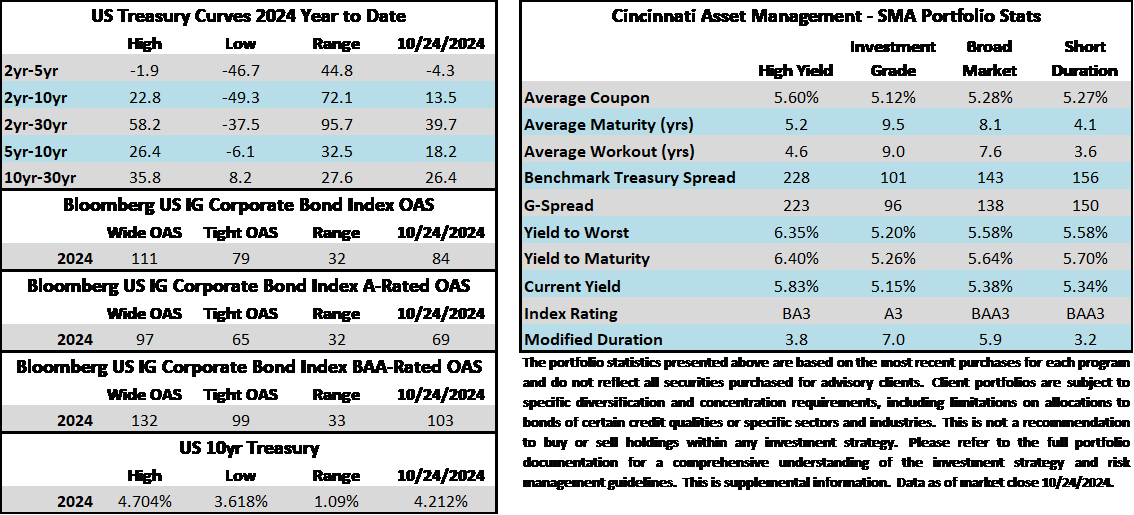
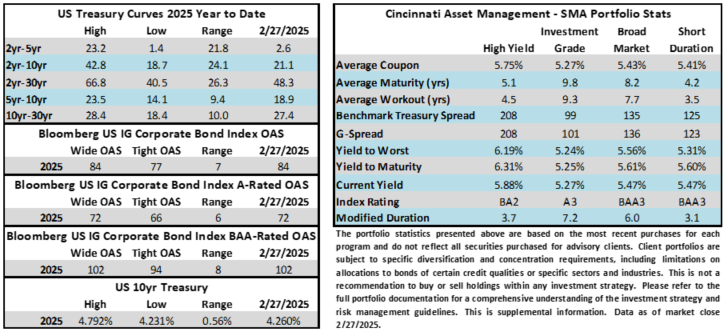
Credit spreads finally experienced their first bout of widening in 2025. Now, to be clear, we are not talking about much of a move in the grand scheme of things. Although the index closed Thursday at its widest level of 2025 it sits only 7 basis points off the tights. The OAS on the Corporate Index moved 4 basis points wider week over week through Thursday February 27. The 10yr Treasury yield rallied hard and moved 17 basis points lower over the same time period. Through Thursday, the Corporate Bond Index year-to-date total return was +2.29% while the yield to maturity for the Index closed the day at 5.12%.
Economics
Tuesday saw a pessimistic consumer confidence print as the measure posted its biggest drop since 2021 and is now sitting at an eight-month low. This prompted Treasury yields to move lower. On Wednesday we got data that showed that elevated mortgage rates and bad weather continued to weigh on new home sales, as they declined 10.5% during January. On Thursday the durable goods release was solid but some areas were weak and it may be that the pop in the indicator was an attempt by buyers to get ahead of tariffs. Friday the data was mixed as inflation came in line with expectations while income surprised to the upside but spending underwhelmed.
Next week the highlights include ISM manufacturing/services, auto sales and the unemployment report for the month of February.
Issuance
It was another solid week of issuance as wider spreads did nothing to stop issuer enthusiasm. More than $51bln of new debt was priced during the last week of February, pushing the monthly total to nearly $161bln. Note that this is 8% shy of what dealers were expecting for the month ($175bln) but was still the second busiest February on record, eclipsed only by last year’s total of $197bln. Year-to-date issuance has now eclipsed $347bln.
With the move lower in Treasury yields more than offsetting the move wider in spreads the funding environment is as attractive as it has been at any point this year. Next week could get things off to a hot start for the month of March with more than $50bln of issuance.
Flows
According to LSEG Lipper, for the week ended February 26, investment-grade bond funds reported a net inflow of +$2bln. Total year-to-date flows into investment grade funds were +$16.2bln.
This information is intended solely to report on investment strategies identified by Cincinnati Asset Management. Opinions and estimates offered constitute our judgment and are subject to change without notice, as are statements of financial market trends, which are based on current market conditions. This material is not intended as an offer or solicitation to buy, hold or sell any financial instrument. Fixed income securities may be sensitive to prevailing interest rates. When rates rise the value generally declines. Past performance is not a guarantee of future results.
