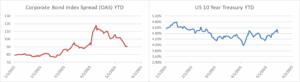
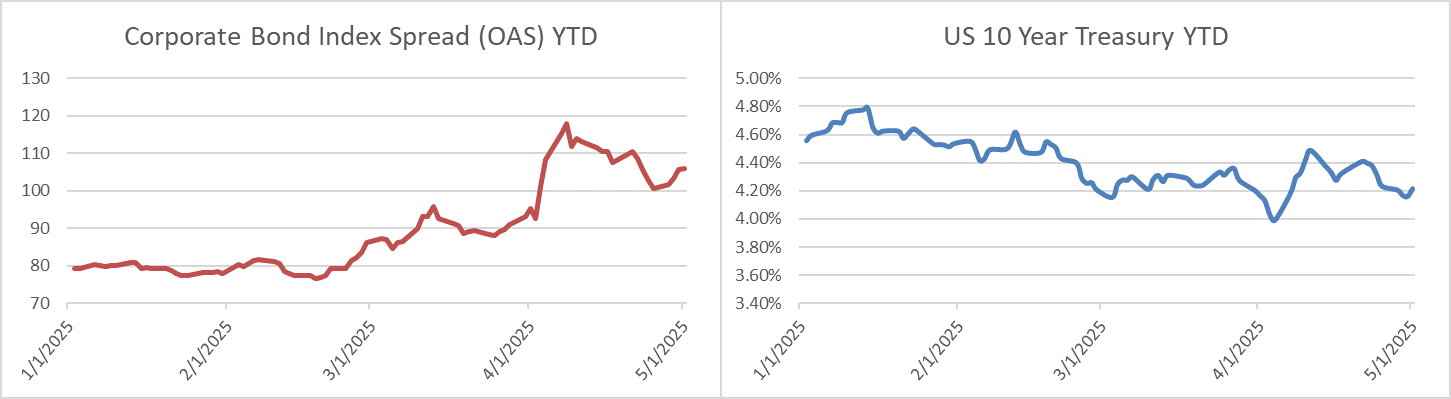
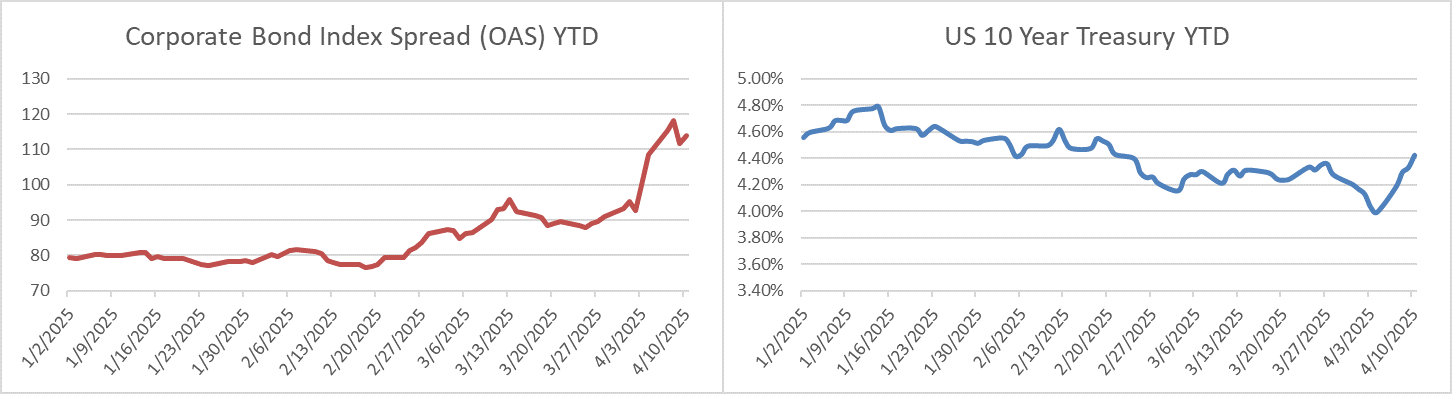
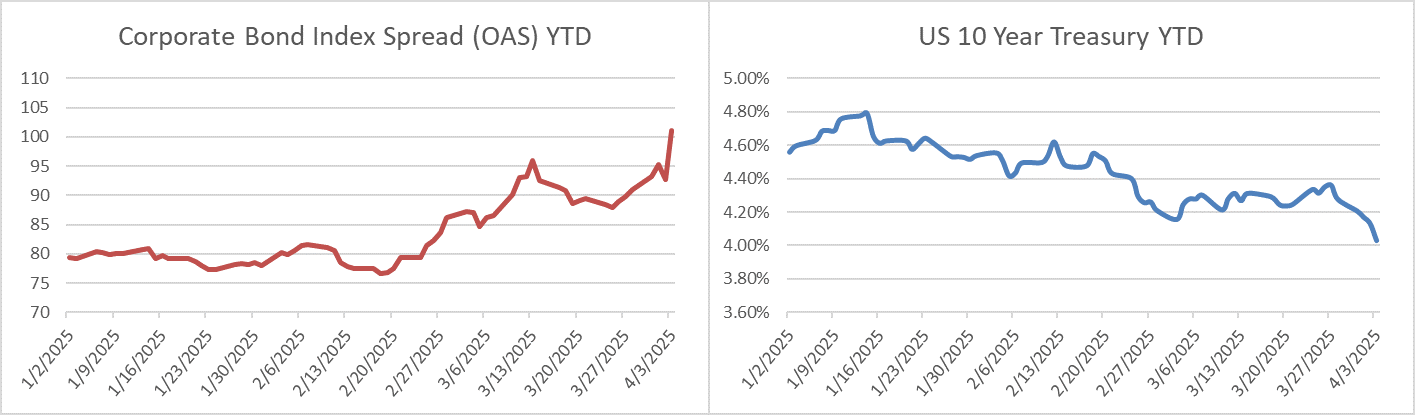
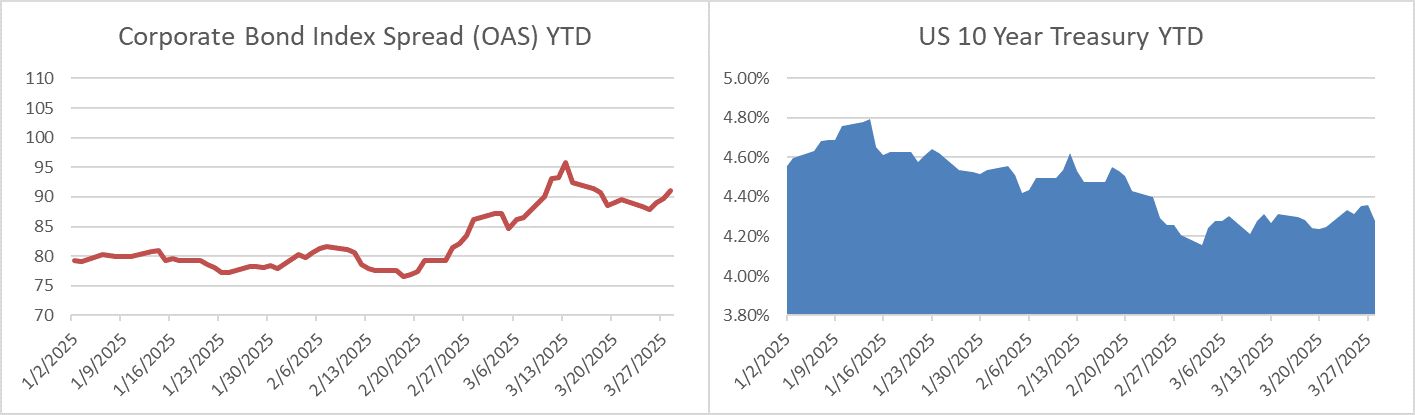
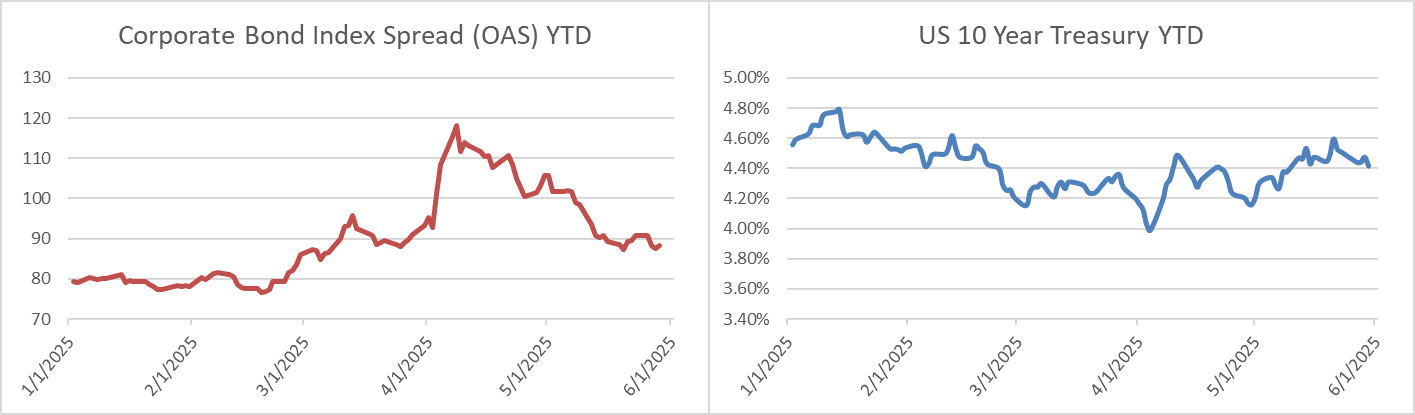
Credit spreads moved tighter this week. The US Corporate Bond Index closed last week at 91 and had tightened to 89 as the market closed on Thursday. The 10yr Treasury yield is lower thus far on the week to the tune of 9bps as we go to print. The benchmark rate closed last Friday at 4.51% and it was 4.42% by Thursday’s close. Through Thursday, the Corporate Bond Index year-to-date total return was +2.08% while the yield to maturity for the Index closed the day at 5.25%.
 Economics
It was a busy economic calendar this week. Durable goods orders came in weak after previous releases were stronger than expected as firms piled on orders to get ahead of tariffs. Consumer confidence showed a rebound in May after five straight months of declines but it still remains at depressed levels. The latest GDP update for Q1 came in at -0.2% which, although negative, actually exceeded the estimate of -0.3%. Finally, the most anticipated releases came on Friday morning with personal spending data and core PCE. Headline PCE rose just 0.1% in April and the year over year measure moved to 2.1% in April from 2.3% in March. Consumer spending fared okay in April all things considered posting a +0.2% increase led by services. It feels a bit like a broken record to keep stating that it is simply too early to know what impact tariffs will have on inflation and consumer health but that is the reality.
Next week is another busy one that culminates in an employment report on Friday, June 6th. Looking further ahead, the next FOMC meeting is on June 18th. Interest rate futures on Friday morning are pricing just a 2.1% chance of a cut at that meeting. For contrast, exactly one month ago, amid a bleaker outlook for global trade, those same futures were pricing a 59% chance of cut at the June meeting. The mood of market participants has certainly changed, but we now wonder if risk assets have retraced too far?
Primary Market
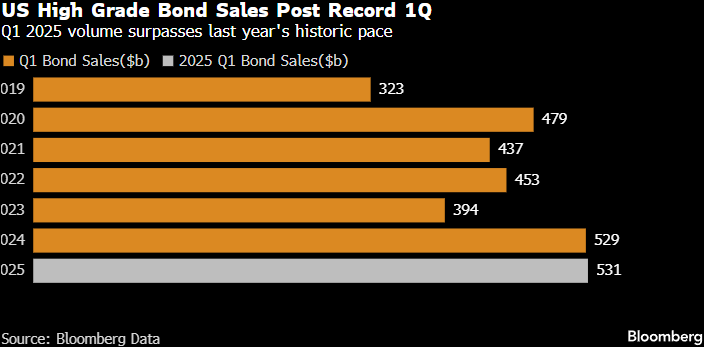
It was a solid if uneventful holiday-shortened week of issuance as companies priced $21.6bln of new debt which was in line with estimates. Volume for the month of May pushed past $152bln, making it the busiest month of May since 2020 when $242bln was borrowed as companies shored up liquidity during the early days of the pandemic. Investor demand was strong this week and concessions were meager. Next week dealers are looking for ~$30bln in new debt.
Flows
According to LSEG Lipper, for the week ended May 28, investment-grade bond funds reported an inflow of +$1.73bln. Total year-to-date flows into investment grade were +$9.91bln.
This information is intended solely to report on investment strategies identified by Cincinnati Asset Management. Opinions and estimates offered constitute our judgment and are subject to change without notice, as are statements of financial market trends, which are based on current market conditions. This material is not intended as an offer or solicitation to buy, hold or sell any financial instrument. Fixed income securities may be sensitive to prevailing interest rates. When rates rise the value generally declines. Past performance is not a guarantee of future results.