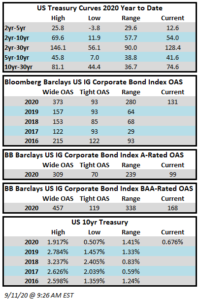
Category: Investment Grade Weekly

01 Nov 2019

CAM Investment Grade Weekly Insights

Credit spreads were turbulent during the week.  The first half of the week saw tighter spreads, and the OAS on the Corporate Index closed at 106 on Tuesday, the tightest level of 2019.  Spreads traded wider from there on the back of Fed commentary on Wednesday which was followed by a surprisingly weak Chicago PMI reading on Thursday morning leading to a close of 110 for the index on Hallows eve.  The economic news continued to roll in on Friday morning, but this time it was received in positive fashion as employment numbers beat market expectations.  As we go to print amid lighter volumes in corporates most bonds are trading 2-4 tighter which should see the index close right around 108.  If we do close at 108 then spreads will have finished the week unchanged.  Rates too were volatile during the week with the 10yr closing at 1.84% on Monday but it is now trading at 1.73% on Friday afternoon.  This is lower on the week, as the 10yr finished the week prior at 1.79%.

The primary market was somewhat more active this week but finished the month well shy of expectations.  October volume closed at $68.6bln versus dealer projections of $85bln according to data compiled by Bloomberg.  2019 issuance stands at $992bln which trails 2018 to the tune of -6%.

Demand for corporate credit continues to remain robust.  According to Wells Fargo, IG fund flows during the week of October 24-30 were +$4.2bln.  This brings YTD IG fund flows to +$246bln.  2019 flows are up over 9% relative to 2018.


(Bloomberg) Credit Risk Gauge Drops to Six-Week Low on Bullish Jobs Report

  • Investors pushed the cost to protect a basket of investment-grade company debt against default to the lowest level since Sept. 19 following the unexpectedly strong U.S. jobs report on Friday.
    • The Market CDX Investment Grade index spread fell as much as 2 bps to touch 52.96 bps Friday morning in New York before paring some of the gains to trade at 53.67 bps at 12:30 p.m, according to ICE Data Services. The index narrowed by the most in almost three weeks, data compiled by Bloomberg show.
    • Excess demand for higher-quality bonds and low supply have propelled gains in corporate investment-grade markets. October new IG issues ended at $68.6 billion, falling short of the $85 billion dealer projections by nearly 20%, while cash continues to flow intohigh-grade bond funds.


(Bloomberg) Riskiest Junk Debt Still Isn’t Cheap Enough to Lure Buyers

  • Notes rated in the CCC tier, essentially the lowest level in the junk bond market, have grown cheaper since May even as most of the market has grown stronger. Risk premiums, or spreads, on the debt are close to their widest level relative to the tier just above them since mid-2016, according to data compiled by Bloomberg.
  • The weaker performance of the lowest-rated debt underscores how even as investors are reaching for higher returns as the Federal Reserve eases interest rates, they’re still wary of a potential economic downturn and fear that defaults could start to tick higher. The highest tier of junk bonds have gained 13.5% this year, and overall high-yield corporate bonds are up 11.9%, while those rated CCC have gained just 5.7%.
  • CCC debt doesn’t usually perform like this. Because the companies that sell the notes are already so close to defaulting, CCC bonds are typically hit harder than the broad market during a market downdraft. When the market recovers, the securities often perform much better. The debt plunged in early 2016 when energy prices dropped, but went on to notch huge returns for the year — 31.5% to the broader market’s 17.1% — as oil prices started recovering.

This year, CCC bonds are performing worse than the market even as the overall supply of the lowest-rated notes has been shrinking. There are about $156 billion of those bonds outstanding today, down from $167 billion in February. So far this year, CCC rated companies have sold around $24 billion of debt, less than the same period for each of the previous two years, according to data compiled by Bloomberg.


Bloomberg) Top Fed Officials Hammer Home Message That Rates Are on Hold

  • Federal Reserve Vice Chairman Richard Clarida reinforced the central bank’s new message this week that interest rates are on hold, saying that both monetary policy and the U.S. economy are “in a good place,” though some risks remain.
  • “We have a favorable outlook for the economy,” Clarida said Friday in an interview with Jonathan Ferro and Tom Keene on Bloomberg Television. “We think the economy is in a good place, we think monetary policy is in a good place.”
  • He repeated that message in a lunchtime speech at the Japan Society in New York, with Fed Vice Chairman for Supervision Randal Quarles delivering a similar signal at an event at the same time at Yale University in New Haven, Connecticut.
  • The vice chairs’ overlapping remarks hewed closely to what Chairman Jerome Powell said earlier this week after the Fed cut rates for a third time this year, signifying a strong consensus at least among the Board of Governors. The Fed has acted to protect a record U.S. economic expansion amid headwinds from trade uncertainty and global weakness, while the domestic economy has been holding up.
25 Oct 2019

CAM Investment Grade Weekly Insights

Spreads are tighter to the tune of several basis points on the week while Treasury rates crept higher. The OAS on the Bloomberg Barclays Corporate Index was 110 on Friday morning after having closed at 112 the week prior. Spreads have continued to grind tighter throughout the day as we go to print on Friday afternoon and the close on the index OAS is likely to come close to touching the year-to-date tight of 108. Treasury rates are set to finish the week higher with the 10-year up 5 basis points on the week.

The primary market continued its October trend with another week of lackluster supply. Weekly new issue volume was just shy of $14bln pushing the monthly total to $39.5bln according to data compiled by Bloomberg. 2019 issuance stands at $963bln trailing 2018 by nearly 8% on a relative basis.

According to Wells Fargo, IG fund flows during the week of October 17-23 were +$4.4bln. This brings YTD IG fund flows to +$242bln. 2019 flows are up 9% relative to 2018.


Bloomberg) Bond Funds Learn to Exploit Ratings System to Buy Riskier Debt

  • In today’s low interest-rate world, investment-grade bond funds face an all-too-familiar trade-off: buy risky debt to improve returns or play it safe and underperform.
  • In particular, funds are loading up on bonds where ratings firms are split on whether they’re investment grade or junk. While reasonable people can disagree about which one is right, for a growing number of firms, the answer is always the same: the higher one.
  • The practice has obvious advantages. With high-grade corporate bonds yielding less than 3% on average, managers can pick up an extra half-percentage point on split-rated debt. And funds can say they’re invested in safe assets while running a portfolio that actually looks a lot like a junk bond fund.
  • Granted, managers have always had the discretion and the flexibility to choose which ratings standards to follow. The methodology is there for all to read in the fund’s prospectus, though it’s often tucked into the fine print. Then, there’s the question of how much stock to put into ratings anyway. Many managers lean on their own analysis to determine a bond’s credit risk.
  • That extra yield comes with a price. Historical data from S&P shows that lower initial ratings correspond with higher rates of default. The gap is notably stark in the divide between investment grade and junk. Ten-year default rates on bonds with BB ratings are double those with BBB grades.


(Bloomberg) Corporate Bond Syndicates Yawn Amid Sleepiest October in Years

  • S. investment-grade debt sales are expected to miss estimates for October — by a lot.
  • Just $39.5 billion of new debt has been sold as of Thursday, compared to initial forecasts calling for $85 billion. This projection, put together by compiling dealer estimates, was revised lower mid-month to around $65 billion and now even that may be a stretch.
  • Volume is the lowest since October 2013, when $41.9 billion of blue-chip company bonds was sold. There are still five trading days left, but that narrows to two when you consider Fridays are often blank, Wednesday is a Fed decision day and Thursday is Halloween.
    • The following factors likely play a role.
    • Big banks have been absent. Of the top 10 U.S. banks, just Bank of America Corp. and Wells Fargo & Co. have issued new debt, together totaling $10. 5 billion. Typically there is more, especially when financial institutions report better-than-expected earnings as Goldman Sachs Group Inc., Morgan Stanley and JPMorgan Chase & Co. have.
    • Earnings season. Issuers and investors want to see how well companies have been doing. Buyers want to know about the recent quarter and fourth quarter outlook, considering the geopolitical risks such as the U.S.-China trade war and Brexit
    • Muted merger and acquisition activity. It’s widely understood that M&A issuance is down, but overall the calendar just seems lighter. Every once in a while there is a whisper about T-Mobile USA Inc., but at the moment that is looking more like a 2020 story.
  • Restart
    • Issuance will begin to pick up next week, albeit from a pretty low bar set in the last few weeks. Desks are expected to front-run the Fed and complete the bulk of next week’s debt issuance on Monday and Tuesday.
    • There are a plethora of companies expected to report next week. The week after next, earnings will subside and with the bulk of the reports released, more candidates will consider selling debt. The first week of November is when the real ramp up should occur.
    • The fact that October is running about 54% behind estimates doesn’t come as a surprise since actual supply has been missing weekly estimates for five weeks in a row. That trend is going to break as Wells Fargo’s $6.5 billion deal catapulted this week to $13.7 billion, in line with estimates of $15 billion area.


18 Oct 2019

CAM Investment Grade Weekly Insights

Spreads are tighter on the week amidst positive vibes in risk markets and the lack of meaningful new corporate supply.  The OAS on the Bloomberg Barclays Corporate Index is 113 on Friday morning after having closed at 115 the week prior.  Treasury rates have risen substantially since the beginning of October and the 10yr spent much of the week wrapped around 1.75%.

The primary market was subdued during the shortened week as the bond market was closed Monday for a federal holiday.  Weekly new issue volume was $10bln pushing the monthly total to $25.8bln according to data compiled by Bloomberg.  2019 issuance stands at $949bln.

According to Wells Fargo, IG fund flows during the week of October 10-16 were +$4.3bln.  This brings YTD IG fund flows to +$238bln.  2019 flows are up 9% relative to 2018.


(Bloomberg) Chief of Exelon Utility Business Retires Amid Federal Probe

  • The head of Exelon Corp.’s utility unit has abruptly retired amid a federal probe involving its lobbying in Illinois.
  • Anne Pramaggiore, senior executive vice president and chief executive officer of Exelon Utilities, is leaving “effective immediately,” the company said in a statement Tuesday. Calvin Butler Jr., chief of Exelon’s Baltimore Gas and Electric utility, was named as her interim replacement.
  • Pramaggiore’s departure comes less than a week after Exelon disclosed in a regulatory filing that it received a subpoena from federal prosecutors asking for information related to communications with Illinois State Senator Martin Sandoval. In July, Exelon disclosed it received a subpoena related to its lobbying activities in Illinois.
  • The Chicago Tribune reported earlier this month that federal agents had raided Sandoval’s office and were searching for information related to concrete and construction businesses and lobbyists and public officials. Officials were also looking for “items related to any official action taken in exchange for a benefit,” the Tribune reported, citing documents released by the Illinois Senate.
  • Exelon’s statement on Pramaggiore’s retirement Tuesday didn’t reference the subpoenas. Nor did it give a reason for her departure.
  • “We thank Anne for her valuable service,” Exelon CEO Chris Crane said in the statement. “We are confident this will be a smooth transition.”


(Bloomberg) High-Grade Corporate Bonds Trade Tighter as New Debt Sales Slump

  • Spreads on new high-grade corporate bonds tightened in secondary trading as debt issuance missed estimates for the fourth straight week.
    • Further outperformance in a market that has already enjoyed a 13% return this year should continue given the dearth of new supply and consistent fund inflows
      • Investors added $2.9 billion for the week ended Oct. 16, Refinitiv’s Lipper US Fund Flows data show, adding to $1.8 billion the prior period
    • All eight of the fixed-rate tranches sold this week are trading tighter, according to Trace data reviewed around 10 a.m. on Friday
    • Primary market sales disappointed again this week, with just $10 billion priced against estimates calling for $15 billion to $20 billion
      • 40% of this week’s volume was from one borrower — Bank of America’s $4 billion priced in two parts
      • Seven of eight bonds sold this week were from financial companies
    • Next week’s preliminary forecast calls for a total in the $15 billion area, with the possibility for an upside surprise should more banks come to the market
      • With 27% of the S&P 500 index companies reporting earnings next week, more corporate issuance is expected
      • Financial companies have dominated recent weeks
27 Sep 2019

CAM Investment Grade Weekly Insights

Spreads and Treasuries were range bound during the week and look likely to finish the week relatively unchanged.  It was a quiet week for credit which is unsurprising given that we are headed into quarter end.

The primary market kicked off September with its busiest week ever but the torrid pace of issuance has cooled considerably heading into month end.  Weekly new issue volume was $14.5bln pushing the monthly total to $154.9bln according to data compiled by Bloomberg, the fifth busiest month of all time.  2019 issuance trails 2018 by 3.9% on a year over year basis.

According to Wells Fargo, IG fund flows during the week of September 19-25 were +$2.9bln.  This brings YTD IG fund flows to +$216bln.  2019 flows are up 8.2% relative to 2018.


(Bloomberg) Sizzling Bond Market Draws Record Number of Blue-Chip Companies

  • This month has seen a record number of bond sales by blue-chip companies, incentivized by low interest rates and supercharged investor demand to refinance debt.
  • The market priced 127 deals, surpassing September 2017’s 110 offerings as the busiest month, based on Bloomberg records began going back 20 years. Total volume of $154.9 billion is still short of the $177 billion record set in May 2016. But with two days remaining in September, sales are poised to be the third-highest ever.
  • The surge in supply came as a growing pile of bonds offer negative yields overseas, driving investors desperate for higher returns into the U.S. corporate credit market. It marks a rare spike in borrowing that’s fueled by a broad-based rush to extend maturities, not driven by large M&A financing.


  • The first week of the month saw the highest weekly sales volume ever. Almost $75 billion was priced, led by bond sales for Walt Disney Co. and Apple Inc.
  • September is by far the most popular month for issuers, accounting for the top three months by deal count over the past 20 years. This month’s 127 total high-grade sales compares with 110 in 2017 and 100 in 2016, the second and third busiest months over the past 20 years.
  • The average deal count for September over the last 10 years is 88.


20 Sep 2019

CAM Investment Grade Weekly Insights

Spreads are tighter on the week and Treasuries are lower.  The OAS on the corporate index opened the week at 116 and is 114 as we go to print on Friday morning while the 10yr Treasury is at 1.767%,  12 basis lower from the previous Friday close.  In other news, as expected, the Fed cut the target rate on Wednesday by a quarter-point to 2%.  The direction of future cuts is much less clear with plenty of debate as to whether or not the Fed will cut again this year.  We tend to think it comes down to economic data and the Fed has been quite clear about this in our view.  The Repo market made headlines throughout the week due to a spike in repo-rates amid a supply-demand mismatch.  The Fed has since intervened and gotten the rates under control.  It remains to be seen as to whether this is much ado about nothing but so long as the Fed liquidity injections can manage to keep rates within the targeted range then we believe that this topic will go by the wayside.

In what seems to be a recurring theme, the primary market had yet another strong week.  Monthly volume has topped $140bln for September making it the 8th busiest month in history with more than a full week to go.  Year-to-date supply is now $905bln which is down a smidge less than 4% relative to 2018 supply at this juncture.  While it was a busy week in the primary market it was not quite as robust as the previous two –if $37bln manages to price by the end of the month then September 2019 would become the busiest month on record but with just 6 trading days left and quarter end looming we are probably not likely to see enough supply to topple the all-time high.

According to Wells Fargo, IG fund flows during the week of September 12-18 were +$2.5bln.  This brings YTD IG fund flows to +$213bln.  2019 flows are up 8 % relative to 2018.

(Bloomberg) The Repo Market’s a Mess. (What’s the Repo Market?): QuickTake

  • When plumbing works well, you don’t need to think about it. That’s usually the case with a vital but obscure part of the financial system known as the repo market, where vast amounts of cash and collateral are swapped every day. But when it springs a leak, as it did this week, it rivets the attention of the U.S. Federal Reserve, the nation’s largest banks, money-market funds, corporations and other big investors. The Fed calmed things down by pumping in billions of dollars, but it may have a lot more work to do on the pipes.
    • What’s the repo market?
      • It’s where piles of cash and pools of securities meet. Repo is short for repurchase agreements, transactions that amount to collateralized short-term loans, often made overnight. Repo deals let big investors — such as mutual funds — make money by briefly lending cash that might otherwise sit idle, and enable banks and broker dealers to get needed financing by loaning out securities they hold in return. A healthy repo market is more than the world’s biggest pawn shop: It helps a wide range of other transactions go more smoothly — including trading in the over $16 trillion U.S. Treasury market.
    • How is the Fed involved in it?
      • In a number of ways. For years, central banks around the globe have used their own repo markets to extend credit in tight markets, stabilize financing costs and guide interest rates. But the relationship changed when the U.S. repo market melted down in September 2008, a crucial part of that year’s financial panic. Since then, the Fed has worked with other regulators to put in new rules to prevent a recurrence. And since 2013, the Fed has entered the repo market on a large scale, using transactions there to put a floor under rates.
    • What happened this week?
      • A lot of cash flowed out of the repo pipes just as more securities were flowing in — meaning that suddenly there wasn’t enough cash for those who needed it. That mismatch drove overnight repo rates from about 2% last week to over 10% on Tuesday. Perhaps more alarming for the Fed was the way volatility in the repo market pushed the effective federal funds rate to 2.30%, above the 2.25% upper limit of the Fed’s target range — just as the Fed was preparing to drop that ceiling to 2%.
    • Why did that all happen?
      • In one view, different events that acted as catalysts just happened to land at the same time and push in the same direction. A big swath of new Treasury debt settled into the marketplace, landing on dealers’ balance sheets just as cash was being sucked out by quarterly tax payments companies needed to send to the government.
    • What did the Fed do?
      • In its first direct injection of cash to the banking sector since the financial crisis, it laid out about $200 billion in temporary cash over several days to quell the funding crunch and push the effective fed funds rate down. In what are known as overnight system repos, the Fed lent cash to primary dealers against Treasury securities or other collateral.
    • Was that enough?
      • It did calm the markets, eventually bringing the rates down around 2% on Thursday. And the action may be sufficient for a temporary patch, if the liquidity squeeze really just reflected the corporate tax payments and Treasury settlements falling on the same date. But most strategists and economists believe the turmoil is a sign of a longer-term problem. To some, one factor is that the rules regulators imposed to make the market safer led dealers to pull back on their involvement, reducing overall liquidity. And many think these distortions will continue as long as government spending and Treasury’s debt issuance continues to rise. More broadly, some observers say that the repo troubles show that there aren’t enough reserves — excess money that banks park at the Fed — in the banking system to give markets the buffers they need at times of stress.
    • What does that mean?
      • To some market observers, it might mean that bank reserves, which currently top $1 trillion, still don’t amount to having enough money in the system. They think the Fed may have to start buying bonds again as a way of boosting reserves. This time the purchases would not be like the quantitative easing of the past, meant to support the broader economy, but just to clear up the mechanics of its balance sheet. As with any corporation, the Fed’s assets and liabilities must balance. The Fed’s liabilities mainly come in the form of currency in circulation and bank reserves. As the nation’s economy expands, as it has since 2009, the amount of currency in use has been growing, too. Without action by the Fed to add to its assets, the growth of currency would reduce the liability represented by reserves.
    • What can the Fed do about the repo squeeze?
      • It did one thing at its September meeting, and two other steps are being discussed. It lowered the interest rate it pays on so-called excess reserves — the cash banks park at the Fed beyond what’s needed to meet regulatory requirements — to 1.8% from 2.1%. Lowering the IOER rate — interest on excess reserves — gives banks an incentive to lend out more of their money, which would keep repo and the effective federal funds rate more within the Fed’s target range. The Fed has also considered introducing a new tool, called a standing overnight repo facility, which would amount to a standing offer to lend a certain amount of cash to repo borrowers every day. The most drastic step would be for the Fed to create more bank reserves by expanding its balance sheet and thereby buoying bank reserves. Fed Chairman Jerome Powell said Wednesday that the central bank is monitoring when it’s appropriate to start expanding the balance sheet.
16 Sep 2019

CAM Investment Grade Weekly Insights

Spreads are set to finish the week modestly tighter while Treasuries are at the forefront with the 10yr now 30 basis points higher from last Friday’s close of 1.560%. The OAS on the corporate index closed at 117 on Thursday after closing the prior week at a spread of 119. Equity indices are trading near or above all-time highs as risk markets cling to any glimmer of hope or positive headline that might indicate U.S.-China trade progress. At CAM we remain skeptical of a near term trade resolution and are cautious in our positioning as a result.


The primary market had another strong week after posting its busiest week ever in the previous weekly session. Nearly $42bln of new corporate debt was brought to the market making it the 3rd busiest week of the year according to data compiled by Bloomberg. Monthly volume has topped $116bln while year-to-date corporate supply stands at $882bln. After having trailed 2018 issuance by as much as 13% in June, 2019 year-to-date issuance is now down just 2% from the prior year. It will be interesting to see how the violent move higher in rates may affect the primary market going forward as higher rates may serve to delay some issuance as borrowers weigh funding costs relative to long term capital allocation plans.

According to Wells Fargo, IG fund flows during the week of September 5-11 were +$7.2bln, the second largest inflow on record. This brings YTD IG fund flows to +$209bln. 2019 flows to this juncture are up 8 % relative to 2018.

(Bloomberg) Investment Grade New Issues Trade Tighter Despite Supply Surfeit

  • Demand for U.S. investment-grade credit is robust, with this month’s avalanche of high-grade bond sales trading mostly stronger, data compiled by Bloomberg show. Spreads on the vast majority of deals priced last week and sized at $1 billion or more are tighter.
    • 20 out of 21 bonds sampled were tighter as of Friday morning
      • Average change in spread was 8 basis points


(Bloomberg) Fed Seen Cutting Rates Twice More in 2019 Before Holding Steady

  • U.S. central bankers will trim interest rates by a quarter percentage point next week, and again in December, before leaving the target range for their benchmark rate at 1.5%-1.75% for an extended period, according to economists surveyed by Bloomberg.
  • In the Sept. 9-11 poll of 35 economists, respondents lowered their projections for the path of U.S. rates compared to a similar survey in July. However, they firmly rejected the idea the Federal Reserve had begun a series of moves that will prove more prolonged than the “mid-cycle adjustment” that Chairman Jerome Powell predicted in July, when the Federal Open Market Committee cut for the first time in more than a decade.


(Bloomberg) Elliott’s $3.2 Billion AT&T Bet Signals ‘There Will Be a Fight’

  • AT&T Inc.’s sweeping transformation from Ma Bell to a multimedia titan has gone both too far and not far enough for Elliott Management Corp.
  • Billionaire Paul Singer’s New York hedge fund disclosed a new $3.2 billion position in AT&T, taking on one of the nation’s biggest and most widely held companies with a plan to boost its share price by more than 50% through asset sales and cost cutting.
  • Elliott outlined a four-part plan for the company in a letter to its board Monday. The proposal calls for the company to explore divesting assets, including satellite-TV provider DirecTV, the Mexican wireless operations, pieces of the landline business, and others.
  • AT&T is the most indebted company in the world — not counting financial firms and government-backed entities — with $194 billion in total debt as of June, a legacy of Stephenson’s steady clip of large acquisitions. The CEO used to keep a spreadsheet of a few dozen companies that he studies on his tablet to plan his next big deal, people familiar with the matter told Bloomberg in 2016.
06 Sep 2019

CAM Investment Grade Weekly Insights

CAM Investment Grade Weekly
9/6/2019

Spreads are set to finish the week tighter, a remarkable feat considering the tsunami of new issue supply.  The OAS on the corporate index closed at 120 on Thursday after closing the prior week at a spread of 120 but as we go to print on Friday afternoon spreads have ground tighter throughout the day.  The 10yr Treasury is 1.54%, essentially unchanged on the week but it had traded as low at 1.45% on Wednesday before positive headlines related to trade sparked a sell-off into the Thursday open.

The primary market just capped off the busiest week in its entire history, and in a holiday shortened week with a jobs report to boot.  Corporate borrowers brought over $75bln in new debt during the week, smashing the previous 2013 record of $66bln.  According to data compiled by Bloomberg, year-to-date corporate supply stands at $840bln.  After having trailed 2018 issuance by as much as 13% in June, 2019 year-to-date issuance is now down just 2% from the prior year.  The fact that secondary market spreads tightened amid such staggering supply speaks to the insatiable demand for IG U.S. corporate credit.

According to Wells Fargo, IG fund flows during the week of August 29-September 4 were +$4.4bln.  This brings YTD IG fund flows to +$202bln.  2019 flows to this juncture are up 7.7% relative to 2018.


16 Aug 2019

CAM Investment Grade Weekly Insights

CAM Investment Grade Weekly
8/16/2019

Spreads are likely to finish wider for the second consecutive week.  The OAS on the corporate index is at 124 this morning after closing the prior week at a spread of 120.  Spreads opened the previous week at 113, so the move wider in credit has been meaningful over the course of the past two weeks, but this move has largely been overshadowed by lower Treasuries.  The 10yr is wrapped around 1.54% as we go to print after having closed the week prior at 1.74%.  The 10yr closed the month of July at 2.01%.  The move lower in rates has been quick and intraday ranges have been volatile with the 10yr trading below 1.5% on Thursday while the 30yr traded below 2% for the first time in history.  For all the volatility in rates and spreads the corporate market has a positive tone as we go to print Friday morning.  There are not many sellers of corporate credit while buyers are plentiful.  This has made it difficult to find attractive bonds in recent weeks but we at CAM are chipping away and finding select opportunities in credit.


The primary market continues to show resiliency amid a volatile tape.  Corporate borrowers brought $23bln in new debt during the week, pushing the month to date total north of $64bln.  According to data compiled by Bloomberg, year-to-date corporate supply stands at $754.7bln, which trails 2019 supply by 6%.  The primary is set to enter a quiet period for the final two weeks of August before ramping up after Labor Day.  September has historically been among the strongest months for the new issue calendar.

Fund flows into investment grade corporates were strong for the second consecutive week.  According to Wells Fargo, IG fund flows during the week of August 8-14 were +$5.4bln.  This brings YTD IG fund flows to +$174bln.  2019 flows to this juncture are up 6.7% relative to 2018.


(Bloomberg) Investors Rushed to High Grade as Recession Fear Spooked Markets

  • Investors dove into U.S. investment-grade corporate bond funds during a week when fears of a global economic slowdown rose and trade-related headlines brought wild swings in stocks, credit and Treasuries.
  • Investors plowed $4 billion into high-grade funds for the week ended Aug. 14, according to Refinitiv’s Lipper. It was the biggest inflow since June, as U.S.-China trade headlines continued to rattle markets and concerns about a slowing global economy inverted a key portion of the U.S. Treasury yield curve for the first time in 12 years. High-yield funds posted a modest inflow of $346 million.
  • Investment grade has become the best performing asset class in fixed income with returns of over 13% so far this year, according to the Bloomberg Barclays US Corporate Total Return index.
  • The high-grade primary market has also remained steadfast during the volatility in recent weeks. With the exception of Wednesday, when issuers sidelined themselves during the rout, debt borrowers have been able to sell bonds at cheaper funding costs.
  • Last week investors yanked over $4 billion from junk bond funds, the most since October, while adding $2.8 billion to high-grade funds.
09 Aug 2019

CAM Investment Grade Weekly Insights

CAM Investment Grade Weekly
8/9/2019

Spreads in the corporate market are set to finish the week meaningfully wider as the OAS on the index opened at 113 on Monday and is trading at 119 as we go to print on Friday morning.  Rate volatility was as the forefront this week as the rates market has more carefully considered the impact of a full blown trade war. The 10yr Treasury closed at 1.85% last Friday and is wrapped around 1.70% as we go to print this morning.  Spreads opened the month of August at year-to-date tights of 108 and have now moved 11 wider, but at the same time the 10yr Treasury is 30 basis points lower, so the net effect is lower yields for corporate credit.  While the Fed cut the federal funds rate by 25bps last Wednesday, the market expectation is that this is merely the beginning of a multi-cut easing cycle.   Federal funds futures are now implying 2 additional cuts by the end of 2019 and 2 more by the end of 2020.  At CAM, we are of the belief that it is quite possible that markets are underestimating the probability of a lack of near term trade resolution and the associated impact that a prolonged trade dispute could have on risk assets.


Even amid heightened volatility and uncertainty, the primary market was quite active during the week.  In fact it was the fifth busiest week of the year that also saw Occidental Petroleum print the 4th largest bond deal of the year which was met with robust investor demand.  While spreads are set to finish the week meaningfully wider it is clear that there is solid demand for corporate credit, particularly higher quality issuers.  According to data compiled by Bloomberg, year-to-date corporate supply stands at $731.9bln, which trails 2019 supply by 6%.  It is worth noting that for most of 2019 supply has trailed 2018 by 10-12% but this gap has narrowed in recent weeks.  The M&A pipeline continues to grow and it would not surprise us at CAM if issuance were robust through the end of September which could continue to push issuance totals toward 2018 levels.

Fund flows into investment grade corporates escalated throughout the week.  There was a clear bifurcation between the high yield and investment grade credit markets as flows during the week were driven by a flight to quality.  According to Wells Fargo, IG fund flows during the week of August 1-August 7 were +$3.3bln while high yield funds experienced losses of -$3.7bln over the same time period and leveraged loan funds posted outflows of -$963 million.  This brings YTD IG fund flows to +$169bln.  2019 flows to this juncture are up 6.5% relative to 2018.  The fact that flows are up while new issue supply is down is but one factor that has led to a supportive environment for credit spreads.

19 Jul 2019

CAM Investment Grade Weekly Insights

CAM Investment Grade Weekly
7/19/2019

The corporate market was modestly wider on the week with the spread on the index 1 basis point wider week over week as we go to print on Friday morning.  Spreads have largely been in a holding pattern for the month of July, as the index opened the month at an OAS of 115 versus a 113 close yesterday evening.  The 10yr Treasury continues to hover just above 2% amid dovish commentary from Federal Reserve officials.  Media blackout begins tomorrow for Fed officials so we will get a respite from commentary until after the July 31 FOMC decision.


It was a quiet for the primary market as less than $15bln in new corporate debt was brought to the market which was underwhelming relative to the $30bln consensus figure.  According to data compiled by Bloomberg, year-to-date corporate supply has topped $600bln, which trails 2019 supply by 10%.

Fund flows into U.S. corporates escalated throughout the week.  According to Wells Fargo, IG fund flows during the week of July 11-July 17 were +$4.8bln.  This brings YTD IG fund flows to +$158bln.  2019 flows to this juncture are up 6.1% relative to 2018.


(Bloomberg) After Times Square Goes Dark, NYC’s ConEd Faces More Heat

  • It lasted all of five hours — and hit just the spot on New York’s power system to take out the lights in Times Square, force the evacuation of Madison Square Garden in the middle of a Jennifer Lopez concert and bring parts of the city’s subway system to a screeching halt.
  • The Saturday evening blackout on Consolidated Edison Inc.’s grid — extending from about Fifth Avenue to the Hudson River and from the 40s to 72nd Street — was so widespread that it took out much of Midtown, Hell’s Kitchen, Rockefeller Center and the lower reaches of Manhattan’s Upper West Side. Now ConEd, already under fire because of other mechanical breakdowns in recent years, is facing renewed calls to overhaul its network.
  • The power failure struck on the anniversary of the historic 1977 blackout that led to widespread looting and other crimes across New York City. And it peeled back disparities between old technology and new: halted subways meant a $2.75 fare ballooned to a $57 Uber primed to surge pricing.
  • Just over six months ago, ConEd was facing an investigation after an electrical fire at a substation turned New York City’s night sky blue, temporarily disrupting flights and subway services. In July 2018, it was the subject of a probe after an asbestos-lined steam pipe ruptured in Manhattan’s Flatiron district. And a power failure in 2017 led to significant delays on the subway during a morning commute, triggering an investigation that cost the company hundreds of millions of dollars.
  • ConEd Chief Executive Officer John McAvoy told reporters late Saturday that the company would investigate the root cause of the event and “restore the system to a fully normal condition once we understand what exactly occurred.” He said the power failure didn’t appear to be weather-related. Hot weather typically sends power demand surging as people blast air conditioners.


 (WSJ) Cellphone Tower Companies Race Higher

  • As the biggest wireless companies in the U.S. prepare to bring 5G to more customers, cellphone-tower operators are shaping up to be big winners in the stock market. They could be ready to get another boost if or when the deal between T-Mobile US Inc. TMUS -0.37% and Sprint Corp. S +0.37% closes, some analysts say.
  • Shares of Crown Castle International Corp., American Tower Corp. and SBA Communications Corp. all hit records in 2019, and are currently up at least 20% from where they traded six months ago. Cellphone companies like Verizon, AT&T and T-Mobile pay these tower companies fees to use their high-up real estate.
  • A concern among some investors is that these companies soared too high too fast. Of the trio, only shares of SBA Communications have risen in the past month. Part of the reason for that is a slowdown in talks between T-Mobile and Sprint.
  • While final conditions for the merger deal remain to be seen, a key component of the Federal Communications Commission’s conditions is an accelerated 5G rollout in rural areas, UBS notes. That stands to benefit American Tower most, as about 65% of its macro portfolio covers the most rural part of the U.S., according to a research report by UBS last month that looked at the FCC’s antenna registration database of tower locations throughout the U.S.
  • Another potential overhang has been worries that private operators could be competition for these three big public tower owners as wireless carriers seek out lower rents. However, UBS’s report also found that the big three public tower companies remain the dominant players in a hot business, with the largest private owner of tower sites accounting for just about 2% of all towers. That bodes well for SBA Communications, American Tower and Crown Castle.
  • “While the private operators have increased their tower counts…this competitive threat is far more limited in practice at this time,” UBS said in its note.


(Bloomberg) A Leveraged Loan Collapses and Reveals Key Risk in Credit Market

  • Operating out of a Chicago suburb, in a low-slung, red-brick building wedged between a Hyatt and a Radisson, Clover Technologies is in the mundane business of recycling everything from inkjet cartridges to mobile phones.
  • But in the past week it abruptly — and alarmingly — caught the attention of Wall Street. Almost overnight, a $693 million loan Clover took to the market five years ago lost about a third of its value. The startling nosedive stung even sophisticated investors, people who deal in the arcane business of trading corporate loans.
  • Clover’s loan isn’t especially large by Wall Street standards, yet its stark and swift decline set off fresh alarm bells — bells that regulators have been sounding for months. It immediately became a real life example of the perils of investing these days in the $1.3 trillion market for leveraged loans, where a global chase for yield has allowed an explosion in borrowing and lax underwriting. In a market where trading can be thin — and at a time when illiquidity is suddenly becoming a prominent concern in credit circles — the episode shows how loans to highly leveraged companies can quickly implode when fortunes change.
  • Using the leveraged loan market as a wallet, the company took loans that funded dividend payments totaling at least $278 million — $100 million in 2013 and $178 million in 2014. (Portions of the overall proceeds went to shareholders as well as to refinance the company’s existing debt and certain fees, according to a Moody’s report.) Clover also asked lenders for a further $100 million in 2014 to pay for an acquisition.
  • Those loans, as is typically done, were bought mostly by mutual funds and collateralized loan obligations, which bundle such leveraged debt into higher-rated securities that are pitched to more risk-averse investors. There’s been little trouble finding buyers for CLOs in recent years. With yields on high-grade bonds hovering near zero across much of the world, investors have been hungry for the juicy returns that these loans offer and, more and more, tend to overlook the lack of protection afforded.
  • Moody’s now predicts a higher likelihood Clover will default on its debt obligations. The ratings agency cites concerns over long-term viability of the business and “unexpected” operational developments. Its debt is just over 6 times its earnings, a level that typically raises lender concerns about the company’s ability to meet its financial obligations. Another warning sign came in May when the company pulled a seemingly attractive refinancing plan that offered a high yield of nearly 9% with a short, three-year maturity.
  • Investors may recall similar blowups in the credit market. American Tire Distributors’ bonds and loans plunged into distress less than a month after it announced the loss of two key suppliers, Goodyear and Bridgestone. ATM-maker Diebold Nixdorf Inc. also saw its bonds fall to almost half their face value after it posted an unexpected second quarter loss.