Category: Investment Grade Weekly

29 May 2020

CAM Investment Grade Weekly Insights

Spreads moved significantly tighter throughout the week.  The Bloomberg Barclays US Corporate Index closed on Thursday May 28 at 175 after closing the week of May 22 at 185.  The corporate index total return for the year through Thursday was +2.54%.

The primary market was busy again but volume was lower for the second consecutive week.  This week saw over $38bln price in the primary market.    Corporate issuance has now passed the $1 trillion mark for 2020 and it has done so at its fastest pace ever.  New issue concessions have steadily declined in recent weeks and even turned negative for some deals in the latter half of this week.  Strong inflows into the IG markets are the driving factor behind narrowing (and negative) concessions.

According to data compiled by Wells Fargo, inflows for the week of May 21-27 were +$11.5bln which brings the year-to-date total to -$43.7bln.  This extends the 8-week steak of inflows to $55bln for investment grade funds.


22 May 2020

CAM Investment Grade Weekly Insights

Spreads moved significantly tighter throughout the week.  The Bloomberg Barclays US Corporate Index closed on Thursday May 21 at 187 after closing the week of May 15 at 208.  The corporate index total return for the year through Thursday was +2.15%.  The fixed income markets will close early on Friday ahead of the Memorial Day weekend and spreads are modestly wider as we go to print as it looks like the extended rally in credit might finally have an off day.

The primary market was busy again but volume was lower than the week prior.  It could well be that the early market close on Friday was the only thing that kept volumes lower on the week as we saw over $47bln of new debt price through Thursday with no issuers on the calendar for Friday morning.    Corporate issuance is closing in on the $1 trillion mark as nearly $970bln of corporate debt has been priced so far this year which is 90% ahead of 2019’s pace.  We are still finding attractive opportunities in the primary market but certainly fewer today than in the recent past.  According to data compiled by Bloomberg, concessions have trended downward over the last month with issuers averaging just over 5bps this week vs 11bps last week and 22bps the week prior.

According to data compiled by Wells Fargo, inflows for the week of May 14-20 were +$8.5bln which brings the year-to-date total to -$55.2bln.  This extends the 7-week steak of inflows to $43.5bln for investment grade funds.


15 May 2020

CAM Investment Grade Weekly Insights

Spreads moved tighter throughout the week.  The Bloomberg Barclays US Corporate Index closed the week of May 15 at an OAS of 208 after closing the prior week at 212.  Through Friday, the index total return for the year was +0.72%.

The primary market again remained en fuego as borrowers rushed to stock their coffers with liquidity.  Over $60 billion in new debt was priced this past week according to data compiled by Bloomberg.  So far more than $156 billion has priced during the month of May.  It seems that the Memorial Day Holiday is the only thing that can slow the pace of issuance at this point.

According to data compiled by Wells Fargo, inflows for the week of May 7-13 were +$6.2bln which brings the year-to-date total to -$74.6bln.  This extends the 6-week steak of inflows to $35bln for investment grade funds.

08 May 2020

CAM Investment Grade Weekly Insights

Spreads drifted modestly wider throughout the week.  The Bloomberg Barclays US Corporate Index closed the week of May 8 at an OAS of 212 after closing the prior week at 206. Still, we have come a long way from the market wide on the index, which was an OAS of 373 on March 23.  Through Friday, the index total return for the year was nearly unchanged at +0.03%.

The primary market continues to be at the forefront as the historic deluge of issuance continues to break records on what seems like a daily basis.   $93.2 billion in new debt was priced this week according to data compiled by Bloomberg.  This vaulted the week into one of the top-5 busiest ever for volume.  There is no end in sight to issuance as borrowing costs remain low, investor demand is robust and companies are eager to amend, extend, refinance and bolster liquidity amid economic uncertainty.

According to data compiled by Wells Fargo, inflows for the week of April 30-May 6 were +$6bln which brings the year-to-date total to -$80.8bln.


01 May 2020

CAM Investment Grade Weekly Insights

Spreads got back on the tightening track this week after finishing the prior week slightly wider.  The Bloomberg Barclays US Corporate Index closed Thursday at an OAS of 202 after closing the prior week at 209. The market was mixed throughout the day on Friday but softer equities weighed on credit spreads pushing them wider at the margin.  Recall that the wide for the index was a 373 OAS on March 23.  Through Thursday, the index total return for the year was +1.42%.

The primary market made history yet again as $285 billion priced in the month of April, the largest monthly tally on record.  The previous record was this March which saw $259 billion in new debt.   It does not appear that issuance will slow down anytime soon even amid earnings season as borrowers look to lock in financing in the face of uncertainty.  Borrowing costs remain quite low by historical standards thanks to low Treasury rates.

According to data compiled by Wells Fargo, inflows for the week of April 23-29 were +$5.3bln which brings the year-to-date total to -$86.8bln.


24 Apr 2020

CAM Investment Grade Weekly Insights

The streak of tighter spreads for the past four weeks is in jeopardy.  The Bloomberg Barclays US Corporate Index closed Thursday at an OAS of 208 after closing the prior week at 206. The tone is mixed as we go to print on Friday morning so unless something changes throughout the day it looks unlikely that the market will close inside of 206, bringing the streak to an end.  Spreads have come a long way in the past month and it was a month ago today when the market closed at its widest level of the year with at 373 OAS on March 23.  Through Thursday, the index total return for the year was +1.41%.

It was a volatile week in the markets characterized by a brutal selloff in WTI crude futures which went negative for the first time.  Stocks were lower and spreads were wider on Monday and Tuesday but both reclaimed some ground on Wednesday and Thursday.  Economic data, too, was exceptionally poor although this was largely expected and already priced into risk assets to a large degree.  There is much to digest over the course of the next two weeks as the volume of companies reporting earnings will increase substantially.  The question is; how bad will it get?  This type of environment highlights the importance of both active management and bottom up research.

The primary market was busy yet again, even amidst earnings blackouts, which prohibit most companies from issuing new debt.  Issuers brought $35.5bln in new debt through Thursday and there are several benchmark deals pending in the market on Friday which should push the weekly total to around $38bln.  Issuance should slow for the next several weeks but we are still likely to see solid activity as companies continue to take advantage of low borrowing costs and inflows into the credit markets have provided plenty of investor demand.  According to data compiled by Wells Fargo, inflows for the week of April 16-22 were +$3bln which brings the year-to-date total to -$92.3bln.


17 Apr 2020

CAM Investment Grade Weekly Insights

Investment grade credit spreads were tighter for the fourth consecutive week.  The Bloomberg Barclays US Corporate Index closed Thursday at an OAS of 210 after closing the prior week at 233. The tone midway through the day on Friday is mixed but spreads look as though they will finish the day tighter as stocks drift higher.  Through Thursday, the index total return for the year was +1.35%.

The primary market posted another strong week and exceeded most expectations for supply.  Issuers brought $53.2bln in new debt through Thursday and there are several benchmark deals pending in the market on Friday that will look to push the weekly total toward $60bln.  Expectations are for another robust week to follow but issuance should abate near the end of the month as earnings season stars to pick up steam.

Investment grade credit saw the single largest weekly inflow ever and the largest since October 2014. According to data compiled by Wells Fargo, inflows for the week of April 9-15 were +$12.2bln which brings the year-to-date total to -$95.3bln.


09 Apr 2020

CAM Investment Grade Weekly Insights

Spreads ripped tighter during the week as risk assets of all stripes performed well on the back of extraordinary support from the Federal Reserve.  The Bloomberg Barclays US Corporate Index closed the holiday shortened week at an OAS of 233, a whopping 50 basis points tighter from the previous Friday close and over the course of just four trading days.  Through Thursday, the index total return for the year was -1.01% after having been down over -10% at one point just a few weeks ago.  The big announcement of the week came on Thursday morning as the Fed provided more details for its previously announced plans as well as additional support for the corporate credit markets.  The announcement sent spreads sharply tighter into the long weekend.


The primary market posted another strong week.  Over a dozen issuers priced more than $37 billion in new corporate debt over the course of the first three trading sessions this past week.  Thursday was essentially a “no-go” as there was an early market close for Easter weekend which made the timing of new issuance prohibitive.  Consensus estimates for issuance next week are strong again, with most prognosticators coming in around $40bln.

Investment grade credit saw inflows for the first time in five weeks.  According to data compiled by Wells Fargo, inflows for the week of April 2-8 were +1.9bbln which brings the year-to-date total to -$30.5bln.  As we have alluded to in previous commentaries, if the market starts to see consistent inflows then that could provide a tailwind for credit spreads.

03 Apr 2020

CAM Investment Grade Weekly Insights

The investment grade credit markets experienced another week that was largely positive in nature, although spreads are still wide to historical averages.  Bright spots included tighter spreads and higher commodity prices.  The spread on the Bloomberg Barclays US Corporate Index closed Thursday at 279, 16 basis points tighter from the end of the week prior.  The tone is mixed as we go to print on Friday morning amid a brutally high unemployment report.

The primary market continues its record breaking pace.  Not only was March the busiest month for new issuance on record with $259.2 billion in volume, but this week also set the record for weekly supply with $110.9 billion through Thursday; and it is not yet over with several deals in the market on Friday morning.  Last week has now fallen to the #2 spot in the record books as this was the second week in a row of record breaking supply.  Issuance this week was led by Oracle who printed $20bln on Monday and T-Mobile with a $19bln print on Thursday that boasted an order book of $74bln.  The majority of issuers to this point are still comprised of companies that would be considered high quality borrowers.  These companies are simply acting in a prudent and reasonable manner, shoring up their balance sheets amid an environment of uncertainty.

Investment grade credit was hit outflows again but a substantially smaller amount than in prior weeks.  According to data compiled by Wells Fargo, outflows for the week of March 26-April 1 were -$4.6bln which brings the year-to-date total to -$32.5bln.  As we have alluded to in previous commentaries, flows can do a lot to help stabilize the market and if they turn positive then the path of least resistance is tighter credit spreads.


This information is intended solely to report on investment strategies identified by Cincinnati Asset Management. Opinions and estimates offered constitute our judgment and are subject to change without notice, as are statements of financial market trends, which are based on current market conditions. This material is not intended as an offer or solicitation to buy, hold or sell any financial instrument. Fixed income securities may be sensitive to prevailing interest rates. When rates rise the value generally declines. Past performance is not a guarantee of future results. Gross of advisory fee performance does not reflect the deduction of investment advisory fees. Our advisory fees are disclosed in Form ADV Part 2A. Accounts managed through brokerage firm programs usually will include additional fees. Returns are calculated monthly in U.S. dollars and include reinvestment of dividends and interest. The index is unmanaged and does not take into account fees, expenses, and transaction costs. It is shown for comparative purposes and is based on information generally available to the public from sources believed to be reliable. No representation is made to its accuracy or completeness.


27 Mar 2020

CAM Investment Grade Weekly Insights

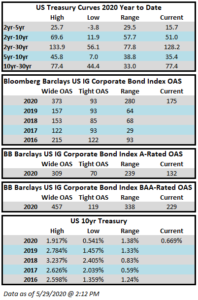
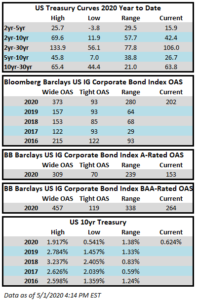
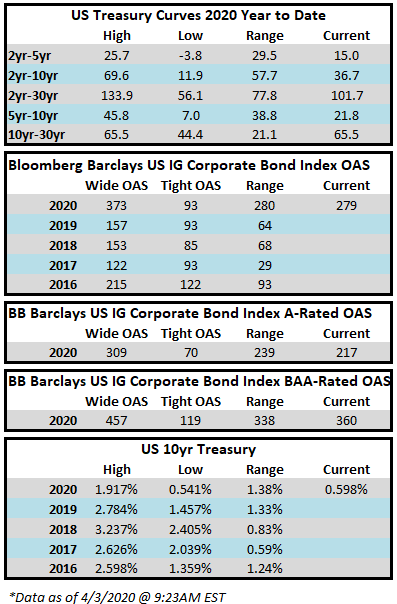
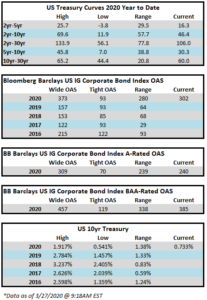
What a difference a few days makes.  The investment grade credit market, like equities, went out with a whimper last week.  On Monday, with the stimulus package in limbo, a deluge of supply pushed spreads out to their widest levels of the year, and the Bloomberg Barclays Corporate Index closed at 373.  The next few days saw a much improved tone, and even in the face of a historically large primary calendar, spreads ratcheted in 71 basis points to close Thursday at 302.  To put this 71 basis point move into context, it was larger than the yearly range of the corporate index for each of the preceding three years, and it took only three days; truly a stunning reversal.  Even with the improved tone, through Thursday, the index was down -5.96% year-to-date while the S&P 500 was down -18.21%.


The primary market continues to bustle with activity and through Thursday it easily smashed the record for its busiest week in history.  $98.9 billion had priced through Thursday eclipsing the previous weekly record of $74.8 billion, according to data compiled by Bloomberg.  There are several deals in the market as we go to print on Friday morning which will push the final weekly total north of $100 billion.  The bulk of the issuance this week was from highly rated issuers with “A” credit ratings but we started to see some BAA-rated issuers get into the mix as the week wore on.  There is one lower quality BAA issuer in the market on Friday morning which is really the first of its kind in recent weeks so we will get an idea about how the market feels about lending to more challenged credit stories.

Investment grade credit was hit with major outflows for the fourth consecutive week.  Flows for the week of March 19-25 were -$43.3bln according to data compiled by Wells Fargo.  The four week total was nearly -$100bln.  Year-to-date flows are now negative to the tune of -$28bln.  We would like to think that with an improved tone that many of the panic sellers and leveraged fast money has exited a space that is more suited for strategic permanent capital. Improving flows can only help to further strengthen the tone in the credit markets.


This information is intended solely to report on investment strategies identified by Cincinnati Asset Management. Opinions and estimates offered constitute our judgment and are subject to change without notice, as are statements of financial market trends, which are based on current market conditions. This material is not intended as an offer or solicitation to buy, hold or sell any financial instrument. Fixed income securities may be sensitive to prevailing interest rates. When rates rise the value generally declines. Past performance is not a guarantee of future results. Gross of advisory fee performance does not reflect the deduction of investment advisory fees. Our advisory fees are disclosed in Form ADV Part 2A. Accounts managed through brokerage firm programs usually will include additional fees. Returns are calculated monthly in U.S. dollars and include reinvestment of dividends and interest. The index is unmanaged and does not take into account fees, expenses, and transaction costs. It is shown for comparative purposes and is based on information generally available to the public from sources believed to be reliable. No representation is made to its accuracy or completeness.