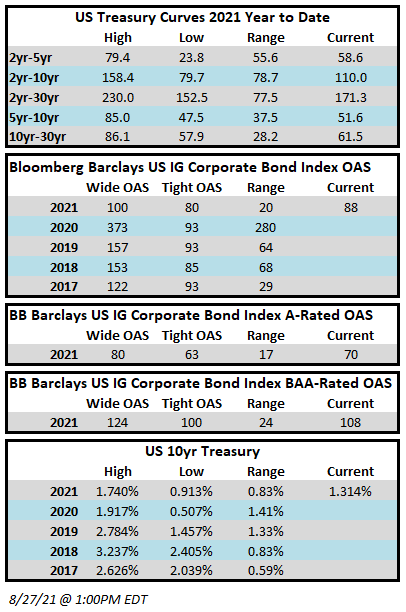
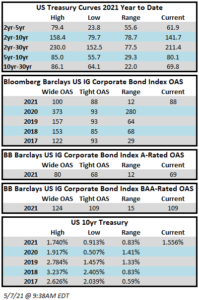
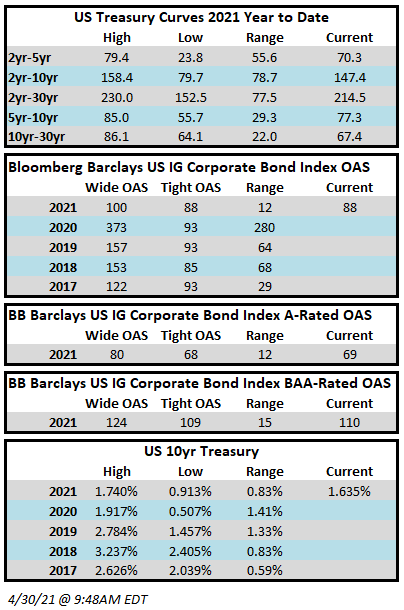
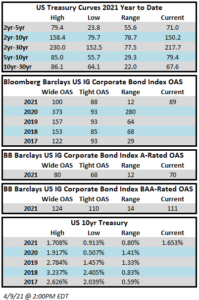
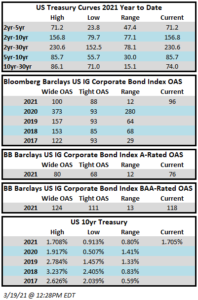
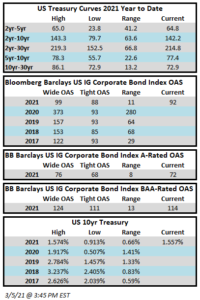
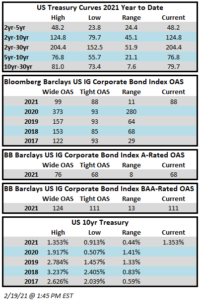
Category: Investment Grade Weekly

15 May 2020

CAM Investment Grade Weekly Insights

Spreads moved tighter throughout the week.  The Bloomberg Barclays US Corporate Index closed the week of May 15 at an OAS of 208 after closing the prior week at 212.  Through Friday, the index total return for the year was +0.72%.

The primary market again remained en fuego as borrowers rushed to stock their coffers with liquidity.  Over $60 billion in new debt was priced this past week according to data compiled by Bloomberg.  So far more than $156 billion has priced during the month of May.  It seems that the Memorial Day Holiday is the only thing that can slow the pace of issuance at this point.

According to data compiled by Wells Fargo, inflows for the week of May 7-13 were +$6.2bln which brings the year-to-date total to -$74.6bln.  This extends the 6-week steak of inflows to $35bln for investment grade funds.

08 May 2020

CAM Investment Grade Weekly Insights

Spreads drifted modestly wider throughout the week.  The Bloomberg Barclays US Corporate Index closed the week of May 8 at an OAS of 212 after closing the prior week at 206. Still, we have come a long way from the market wide on the index, which was an OAS of 373 on March 23.  Through Friday, the index total return for the year was nearly unchanged at +0.03%.

The primary market continues to be at the forefront as the historic deluge of issuance continues to break records on what seems like a daily basis.   $93.2 billion in new debt was priced this week according to data compiled by Bloomberg.  This vaulted the week into one of the top-5 busiest ever for volume.  There is no end in sight to issuance as borrowing costs remain low, investor demand is robust and companies are eager to amend, extend, refinance and bolster liquidity amid economic uncertainty.

According to data compiled by Wells Fargo, inflows for the week of April 30-May 6 were +$6bln which brings the year-to-date total to -$80.8bln.


01 May 2020

CAM Investment Grade Weekly Insights

Spreads got back on the tightening track this week after finishing the prior week slightly wider.  The Bloomberg Barclays US Corporate Index closed Thursday at an OAS of 202 after closing the prior week at 209. The market was mixed throughout the day on Friday but softer equities weighed on credit spreads pushing them wider at the margin.  Recall that the wide for the index was a 373 OAS on March 23.  Through Thursday, the index total return for the year was +1.42%.

The primary market made history yet again as $285 billion priced in the month of April, the largest monthly tally on record.  The previous record was this March which saw $259 billion in new debt.   It does not appear that issuance will slow down anytime soon even amid earnings season as borrowers look to lock in financing in the face of uncertainty.  Borrowing costs remain quite low by historical standards thanks to low Treasury rates.

According to data compiled by Wells Fargo, inflows for the week of April 23-29 were +$5.3bln which brings the year-to-date total to -$86.8bln.


24 Apr 2020

CAM Investment Grade Weekly Insights

The streak of tighter spreads for the past four weeks is in jeopardy.  The Bloomberg Barclays US Corporate Index closed Thursday at an OAS of 208 after closing the prior week at 206. The tone is mixed as we go to print on Friday morning so unless something changes throughout the day it looks unlikely that the market will close inside of 206, bringing the streak to an end.  Spreads have come a long way in the past month and it was a month ago today when the market closed at its widest level of the year with at 373 OAS on March 23.  Through Thursday, the index total return for the year was +1.41%.

It was a volatile week in the markets characterized by a brutal selloff in WTI crude futures which went negative for the first time.  Stocks were lower and spreads were wider on Monday and Tuesday but both reclaimed some ground on Wednesday and Thursday.  Economic data, too, was exceptionally poor although this was largely expected and already priced into risk assets to a large degree.  There is much to digest over the course of the next two weeks as the volume of companies reporting earnings will increase substantially.  The question is; how bad will it get?  This type of environment highlights the importance of both active management and bottom up research.

The primary market was busy yet again, even amidst earnings blackouts, which prohibit most companies from issuing new debt.  Issuers brought $35.5bln in new debt through Thursday and there are several benchmark deals pending in the market on Friday which should push the weekly total to around $38bln.  Issuance should slow for the next several weeks but we are still likely to see solid activity as companies continue to take advantage of low borrowing costs and inflows into the credit markets have provided plenty of investor demand.  According to data compiled by Wells Fargo, inflows for the week of April 16-22 were +$3bln which brings the year-to-date total to -$92.3bln.


17 Apr 2020

CAM Investment Grade Weekly Insights

Investment grade credit spreads were tighter for the fourth consecutive week.  The Bloomberg Barclays US Corporate Index closed Thursday at an OAS of 210 after closing the prior week at 233. The tone midway through the day on Friday is mixed but spreads look as though they will finish the day tighter as stocks drift higher.  Through Thursday, the index total return for the year was +1.35%.

The primary market posted another strong week and exceeded most expectations for supply.  Issuers brought $53.2bln in new debt through Thursday and there are several benchmark deals pending in the market on Friday that will look to push the weekly total toward $60bln.  Expectations are for another robust week to follow but issuance should abate near the end of the month as earnings season stars to pick up steam.

Investment grade credit saw the single largest weekly inflow ever and the largest since October 2014. According to data compiled by Wells Fargo, inflows for the week of April 9-15 were +$12.2bln which brings the year-to-date total to -$95.3bln.


09 Apr 2020

CAM Investment Grade Weekly Insights

Spreads ripped tighter during the week as risk assets of all stripes performed well on the back of extraordinary support from the Federal Reserve.  The Bloomberg Barclays US Corporate Index closed the holiday shortened week at an OAS of 233, a whopping 50 basis points tighter from the previous Friday close and over the course of just four trading days.  Through Thursday, the index total return for the year was -1.01% after having been down over -10% at one point just a few weeks ago.  The big announcement of the week came on Thursday morning as the Fed provided more details for its previously announced plans as well as additional support for the corporate credit markets.  The announcement sent spreads sharply tighter into the long weekend.


The primary market posted another strong week.  Over a dozen issuers priced more than $37 billion in new corporate debt over the course of the first three trading sessions this past week.  Thursday was essentially a “no-go” as there was an early market close for Easter weekend which made the timing of new issuance prohibitive.  Consensus estimates for issuance next week are strong again, with most prognosticators coming in around $40bln.

Investment grade credit saw inflows for the first time in five weeks.  According to data compiled by Wells Fargo, inflows for the week of April 2-8 were +1.9bbln which brings the year-to-date total to -$30.5bln.  As we have alluded to in previous commentaries, if the market starts to see consistent inflows then that could provide a tailwind for credit spreads.

03 Apr 2020

CAM Investment Grade Weekly Insights

The investment grade credit markets experienced another week that was largely positive in nature, although spreads are still wide to historical averages.  Bright spots included tighter spreads and higher commodity prices.  The spread on the Bloomberg Barclays US Corporate Index closed Thursday at 279, 16 basis points tighter from the end of the week prior.  The tone is mixed as we go to print on Friday morning amid a brutally high unemployment report.

The primary market continues its record breaking pace.  Not only was March the busiest month for new issuance on record with $259.2 billion in volume, but this week also set the record for weekly supply with $110.9 billion through Thursday; and it is not yet over with several deals in the market on Friday morning.  Last week has now fallen to the #2 spot in the record books as this was the second week in a row of record breaking supply.  Issuance this week was led by Oracle who printed $20bln on Monday and T-Mobile with a $19bln print on Thursday that boasted an order book of $74bln.  The majority of issuers to this point are still comprised of companies that would be considered high quality borrowers.  These companies are simply acting in a prudent and reasonable manner, shoring up their balance sheets amid an environment of uncertainty.

Investment grade credit was hit outflows again but a substantially smaller amount than in prior weeks.  According to data compiled by Wells Fargo, outflows for the week of March 26-April 1 were -$4.6bln which brings the year-to-date total to -$32.5bln.  As we have alluded to in previous commentaries, flows can do a lot to help stabilize the market and if they turn positive then the path of least resistance is tighter credit spreads.


This information is intended solely to report on investment strategies identified by Cincinnati Asset Management. Opinions and estimates offered constitute our judgment and are subject to change without notice, as are statements of financial market trends, which are based on current market conditions. This material is not intended as an offer or solicitation to buy, hold or sell any financial instrument. Fixed income securities may be sensitive to prevailing interest rates. When rates rise the value generally declines. Past performance is not a guarantee of future results. Gross of advisory fee performance does not reflect the deduction of investment advisory fees. Our advisory fees are disclosed in Form ADV Part 2A. Accounts managed through brokerage firm programs usually will include additional fees. Returns are calculated monthly in U.S. dollars and include reinvestment of dividends and interest. The index is unmanaged and does not take into account fees, expenses, and transaction costs. It is shown for comparative purposes and is based on information generally available to the public from sources believed to be reliable. No representation is made to its accuracy or completeness.


27 Mar 2020

CAM Investment Grade Weekly Insights

What a difference a few days makes.  The investment grade credit market, like equities, went out with a whimper last week.  On Monday, with the stimulus package in limbo, a deluge of supply pushed spreads out to their widest levels of the year, and the Bloomberg Barclays Corporate Index closed at 373.  The next few days saw a much improved tone, and even in the face of a historically large primary calendar, spreads ratcheted in 71 basis points to close Thursday at 302.  To put this 71 basis point move into context, it was larger than the yearly range of the corporate index for each of the preceding three years, and it took only three days; truly a stunning reversal.  Even with the improved tone, through Thursday, the index was down -5.96% year-to-date while the S&P 500 was down -18.21%.


The primary market continues to bustle with activity and through Thursday it easily smashed the record for its busiest week in history.  $98.9 billion had priced through Thursday eclipsing the previous weekly record of $74.8 billion, according to data compiled by Bloomberg.  There are several deals in the market as we go to print on Friday morning which will push the final weekly total north of $100 billion.  The bulk of the issuance this week was from highly rated issuers with “A” credit ratings but we started to see some BAA-rated issuers get into the mix as the week wore on.  There is one lower quality BAA issuer in the market on Friday morning which is really the first of its kind in recent weeks so we will get an idea about how the market feels about lending to more challenged credit stories.

Investment grade credit was hit with major outflows for the fourth consecutive week.  Flows for the week of March 19-25 were -$43.3bln according to data compiled by Wells Fargo.  The four week total was nearly -$100bln.  Year-to-date flows are now negative to the tune of -$28bln.  We would like to think that with an improved tone that many of the panic sellers and leveraged fast money has exited a space that is more suited for strategic permanent capital. Improving flows can only help to further strengthen the tone in the credit markets.


This information is intended solely to report on investment strategies identified by Cincinnati Asset Management. Opinions and estimates offered constitute our judgment and are subject to change without notice, as are statements of financial market trends, which are based on current market conditions. This material is not intended as an offer or solicitation to buy, hold or sell any financial instrument. Fixed income securities may be sensitive to prevailing interest rates. When rates rise the value generally declines. Past performance is not a guarantee of future results. Gross of advisory fee performance does not reflect the deduction of investment advisory fees. Our advisory fees are disclosed in Form ADV Part 2A. Accounts managed through brokerage firm programs usually will include additional fees. Returns are calculated monthly in U.S. dollars and include reinvestment of dividends and interest. The index is unmanaged and does not take into account fees, expenses, and transaction costs. It is shown for comparative purposes and is based on information generally available to the public from sources believed to be reliable. No representation is made to its accuracy or completeness.


23 Mar 2020

CAM Investment Grade Weekly Insights

We hope this commentary finds you all safe and healthy. We wish we would be able to provide you more frequent commentary however things have been changing so rapidly that any update we could provide would have been deemed irrelevant by the time the ink dried on the page. We will seek to provide you with commentary weekly or as is relevant.

The investment grade credit market has just capped off one of the most volatile two week periods in the history of its existence.  The impact of a global pandemic as well as the Saudi-Russia oil standoff has weighed heavily on risk assets of all stripes, and although high quality investment grade typically behaves as a safe haven, even it has not been able to escape the grasp of panicked sellers.  Through the week ended March 20, the YTD gross total return on the Bloomberg Barclays US Corporate Index was -10.58%.  For context, the S&P 500 was down -28.33% over the same time period.  CAM does not provide intra-monthly performance for our portfolios but we are generally more conservatively positioned relative to the corporate index.  Recall that CAM has a significant structural underweight on BAA-rated credit by capping our exposure at 30% while the index has a BAA concentration of nearly 50%.  CAM also targets a minimum rating of A3 for its portfolio.  In a risk off panic, such as the one we have experienced as of late, it is BAA-rated debt that typically underperforms relative to A-rated debt and that has been consistent with what the market has experienced so far in 2020.  Year-to-date, A-rated credit has outperformed BAA-rated credit as spreads on the A-rated portion of the index have widened 270 basis points while BAA-rated credit has underperformed to the tune of 46 basis points, having widened 316 basis points thus far in 2020.  The AAA/AA portion of the corporate index has held up even better, having outperformed the BAA-rated portion of the index by 126 basis points year to date on a spread basis.  To be sure, a pandemic driven global recession is not bullish for investment grade credit, however, it is important to remember that we are talking about high quality investment grade rated companies.  This portion of a portfolio is designed to be the ballast that, over time, will reduce volatility and correlations with other asset classes in the context of a well-diversified portfolio.  A recession is not good for any asset class and there will be some investment grade companies that are more affected than others.  By and large the majority of these companies will see themselves through to the other side and the vast majority of companies will continue to pay interest and debts owed to bondholders.  It is also important to remember that, in the framework of a capital structure, bondholders are ahead of equity holders as it is the bondholders that have first claim on the assets of a company.  We are already seeing numerous companies change their behavior by suspending share buybacks and cutting dividends in order to protect their balance sheets so that they can continue to make good on their financial obligations that are not negotiable – payments to bondholders.

As far as our portfolio positioning is concerned, we are not infallible and we have some credits that have been impacted by the economic consequences of the pandemic.  We are closely monitoring these situations as we always do.  We are fortunate in that we have zero exposure to gaming, lodging, leisure or restaurants, as these have been particularly hard hit by the pandemic.  We have some exposure to the energy sector but we are materially underweight relative to the corporate index.  We have some exposure to airlines but no exposure to unsecured bonds – our only exposure to airlines is through bonds that are secured by the aircraft themselves.  Our high quality bias and our bottom up research process leaves us feeling positive about the positioning of our portfolio relative to the index and we are constantly monitoring the portfolio for opportunities to better position, which for us usually means to more conservatively position.

Market Recap                                                                                  

Remarkably, the investment grade primary market remains alive and well as the week of March 16-20 ended up as the third busiest of all time with 23 borrowers bringing over $62bln in new debt.  This flurry of issuance was important for the psyche of the market in our view as it once again proved that the investment grade market is never closed to high quality issuers.  This was true during the depths of the financial crisis and it is true now.  So why, may you ask, would issuers choose to print deals amid such volatility?  First, it is really just the prudent thing to do if a company has access – faced with an uncertain near term economic outlook; it makes sense to bolster the balance sheet.  Second, due to the drop in Treasuries, debt remains cheap.  Take Coca-Cola for example, which was able to issue 10yr debt with a coupon of 3.45% on Friday.  That is a very reasonable interest rate when viewed through a historical context.  It is also reasonable compensation for investors who are faced with declining yields throughout the world.

Flows have not been the friend for credit investors with long time horizons these past two weeks and the flows themselves have been an even bigger driver of performance than the pandemic in our view.  Outflows from IG credit for the week of March 12-18 were an eye-watering -42.7bln according to data compiled by Wells Fargo.  This represents the largest outflow on record and is nearly 5x larger than the previous record for a weekly outflow.  Investment grade credit is liquid, especially compared to the majority of other fixed income products, such as municipals, but it is not liquid enough to withstand an outflow of this magnitude without serious dislocation, and that is exactly what occurred over the past week.  Liquidity for investment grade was easily as bad as it has been since the financial crisis and quite possibly worse based on the opinion of our team at CAM.  To be clear, yes the pandemic will weigh on credit metrics for many IG companies, but the underperformance of the IG market over the past week was much more about flows than concerns about creditworthiness.  This was panic selling plain and simple.  If the market gets to a point where flows are positive or even neutral then the path of least resistance is tighter spreads.  The dislocation has created opportunity for committed investment grade buyers especially at the front end of the curve as you can now purchase the 5-6-7 year bonds of some issuers at yields that are greater than their bonds that mature at 10yrs and beyond.

The Federal Reserve continues to act aggressively and decisively as it announced support for numerous market segments on Monday morning.  Of particular interest to us is that the Fed will now be buying investment grade rated corporate bonds.  The Fed will operate a Primary Market Corporate Credit Facility and a Secondary Market Corporate Support Facility.  Through the Primary Facility the Fed will purchase IG rated corporate bonds with maturities of 4 years or less.  Through the Secondary Facility, the Fed will purchase IG rated corporate bonds maturing in 5 years or less and it will also be providing liquidity for fixed income ETFs which should go a long way to correcting some of the price discovery problems we saw in the IG market last week.  This package by the Fed had the immediate effect of driving IG credit spreads significantly tighter, but more importantly than that it gave the market some much needed confidence.  The next step to instilling some semblance of calm into the capital markets would be the passage of a substantial relief package by the Senate.  They failed to come to an agreement Sunday evening and for the second time Monday afternoon but we are hopeful that they will come to terms by the end of this week.

As we continue to navigate these turbulent times we wish the best for the health of you and your families.  Thank you for your continued interest.


This information is intended solely to report on investment strategies identified by Cincinnati Asset Management. Opinions and estimates offered constitute our judgment and are subject to change without notice, as are statements of financial market trends, which are based on current market conditions. This material is not intended as an offer or solicitation to buy, hold or sell any financial instrument. Fixed income securities may be sensitive to prevailing interest rates. When rates rise the value generally declines. Past performance is not a guarantee of future results. Gross of advisory fee performance does not reflect the deduction of investment advisory fees. Our advisory fees are disclosed in Form ADV Part 2A. Accounts managed through brokerage firm programs usually will include additional fees. Returns are calculated monthly in U.S. dollars and include reinvestment of dividends and interest. The index is unmanaged and does not take into account fees, expenses, and transaction costs. It is shown for comparative purposes and is based on information generally available to the public from sources believed to be reliable. No representation is made to its accuracy or completeness.

20 Mar 2020

Corporate Bond Market Update

It was a difficult week for the Corporate Bond market as fear and uncertainty related to COVID-19, a precipitous drop in oil, and an inter-meeting rate cut by the U.S. Federal Reserve drove Treasuries lower and spreads wider.

When we look at the Investment Grade market the option adjusted spread on the Bloomberg Barclays US Corporate Index was 122 at month-end February 2020, while on Friday, March 13, 2020 it closed at 216. This was one of the quickest and most volatile spread moves in the history of the investment grade credit market.

(Source: Bloomberg)

There was a corresponding move lower in Treasuries across the board – this helped to mitigate some, but not all, of the impact of widening spreads.

(Source: Bloomberg)

To provide some context on the performance of the investment grade credit market, through the end of the day on Friday March 13, the Bloomberg Barclays US Corporate Index posted a YTD gross total return of -1.88%. Comparatively, the S&P 500 YTD gross total return was -15.73% (Source: Bloomberg). While we are not happy to see negative returns in the corporate bond market, the asset class has performed as expected during a period of extreme volatility, and it has held up materially better than equities and other risk assets.

CAM does not provide intra-monthly performance figures, however as of March 13, 2020 we note that CAM’s portfolio has the following defensive characteristics relative to the Index. CAM is significantly underweight in BBB rated corporate credit relative to the Index. CAM caps its exposure to BBB-rated credit at 30% while the Corporate Index’s exposure was 49.14% as of March 13. Interestingly, the BBB concentration of the Index is down slightly YTD but that is merely because some large issuers, like Kraft-Heinz, were downgraded from BBB to junk status – an example of the type of investment CAM seeks to avoid through its bottom up research process. The second and third major factors that will impact CAM’s performance relative to the Index relate to individual credit selection and avoidance of certain industries which have been particularly hard hit by COVID-19, such as Leisure. To be sure, we have individual credits within our portfolio that have been affected by both COVID-19 and the decline in the oil market and we are constantly monitoring and evaluating those situations through active management of the portfolio.

It was also an exceptionally difficult week for the High Yield market with a one-two punch of fear and uncertainty related to COVID-19 as well as a complete flush of the oil market due to the lack of an OPEC agreement. The option adjusted spread on the Bloomberg Barclays US Corporate High Yield Index spiked above 700 for the first time since the commodity fueled rout of 2016. The Index YTD gross total return was -8.84% through the end of Friday March 13 (Source: Bloomberg).

(Source: Bloomberg)

Again, CAM does not provide intra-monthly performance figures, but our High Yield portfolio has the following defensive characteristics relative to the Index. CAM had over 10% of its portfolio in cash at the start of the current sell-off in February and CAM is underweight, or zero weight, some sectors of the market that were particularly hard hit by this sell off, such as Oil Field services. To be sure, our portfolio’s gross total return was negative as of February 29, 2020, and subsequent drawdown has been widespread. We have a number of credits that have experienced increased volatility and as always we are closely monitoring those situations as well as all the credits in our portfolio. Currently, we are comfortable with the individual credit metrics of our holdings and we believe the overall portfolio is well positioned should the economy enter a recessionary environment. Our cash balance also affords us the ability to be opportunistic on behalf of our clients as those situations arise.

The High Yield market can be extremely volatile in times of stress. It is not as deep or as liquid as the Investment Grade credit market and that is one of the reasons that spreads can gap wider so quickly. The growth of ETFs has exacerbated this problem as they are often forced to sell in the face of investor liquidations. We would caution that during times like these it can be difficult to achieve favorable pricing when looking to sell a high yield security; and depending on your risk tolerance it can often be a good opportunity to buy. We ask that our investors continue to trust that we will professionally manage your portfolios with a long-term objective and through the extent of the current downturn to the best of our ability.

We believe it is important in times like these to remind our investors of our investment philosophy and process at CAM. While volatile markets present challenges as well as opportunities, the way we manage money remains very consistent. We are conservative investors of domestic corporate bonds with a “bottom-up value” investment discipline, stressing first and foremost the preservation of capital, with an important secondary focus on total return. We seek to deliver these results by identifying quality businesses that we are comfortable owning in all markets.

We take the responsibility of managing your money very seriously and we will always do our best to perform that task to the highest standard of care. We sympathize with our clients in uncertain times such as these and we hope that you and your families stay safe and healthy.

This information is intended solely to report on investment strategies identified by Cincinnati Asset Management. Opinions and estimates offered constitute our judgment and are subject to change without notice, as are statements of financial market trends, which are based on current market conditions. Fixed income securities may be sensitive to prevailing interest rates. When rates rise the value generally declines. High Yield bonds present risks specific to below investment grade fixed income securities. Valuation may result in uncertainties and greater volatility, less liquidity, widening credit spreads, and a lack of price transparency. Investments in fixed income securities may be affected by changes in the creditworthiness of the issuer and are subject to nonpayment of principal and interest. The value of fixed income securities also may decline because of real or perceived concerns about the issuer’s ability to make principal and interest payments. Past performance is not a guarantee of future results. Gross of advisory fee performance does not reflect the deduction of investment advisory fees. Our advisory fees are disclosed in Form ADV Part 2A. Accounts managed through brokerage firm programs usually will include additional fees. Returns are calculated monthly in U.S. dollars and include reinvestment of dividends and interest. The Index is unmanaged and does not take into account fees, expenses, and transaction costs. It is shown for comparative purposes and is based on information generally available to the public from sources believed to be reliable. No representation is made to its accuracy or completeness.

The information provided in this report should not be considered a recommendation to purchase or sell any particular security. There is no assurance that any securities discussed herein will remain in an account’s portfolio at the time you receive this report or that securities sold have not been repurchased. The securities discussed do not represent an account’s entire portfolio and in the aggregate may represent only a small percentage of an account’s portfolio holdings. It should not be assumed that any of the securities transactions or holdings discussed were or will prove to be profitable, or that the investment decisions we make in the future will be profitable or will equal the investment performance of the securities discussed herein.