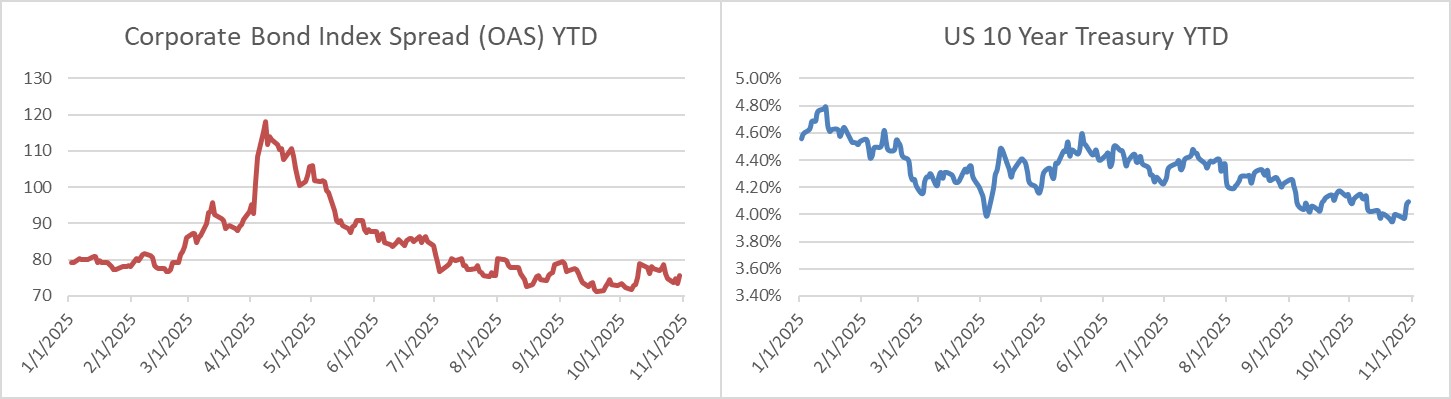
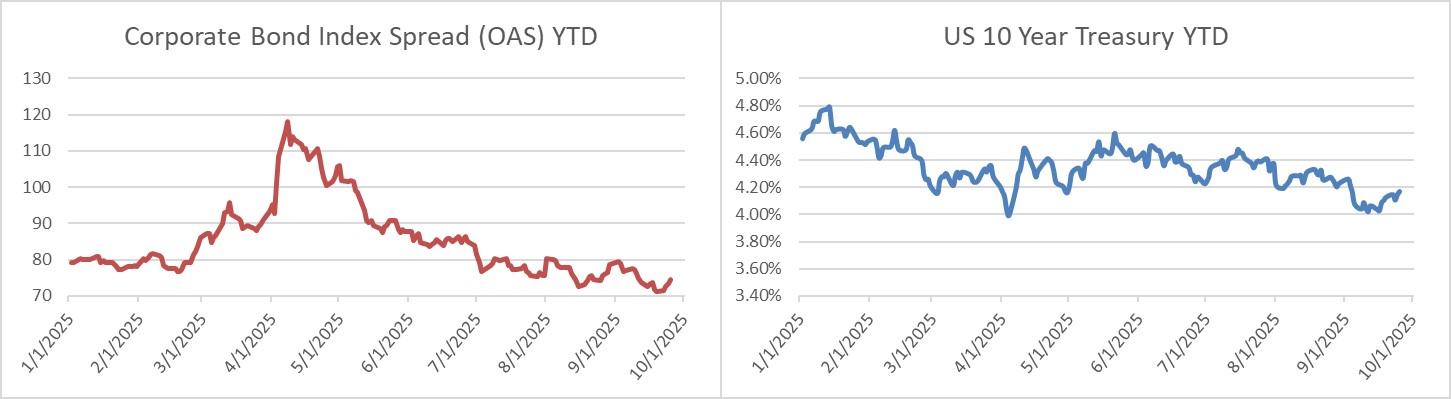
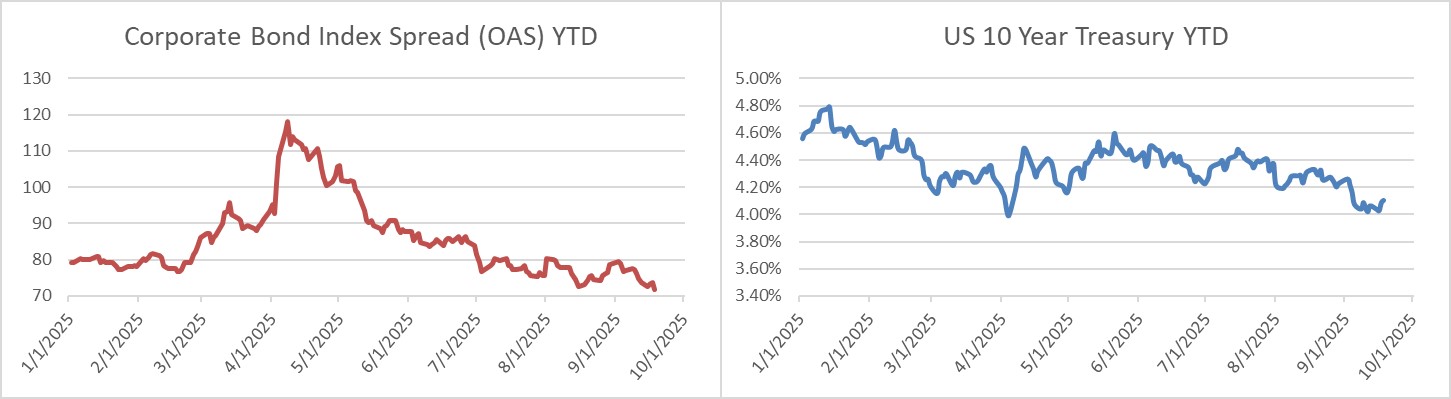
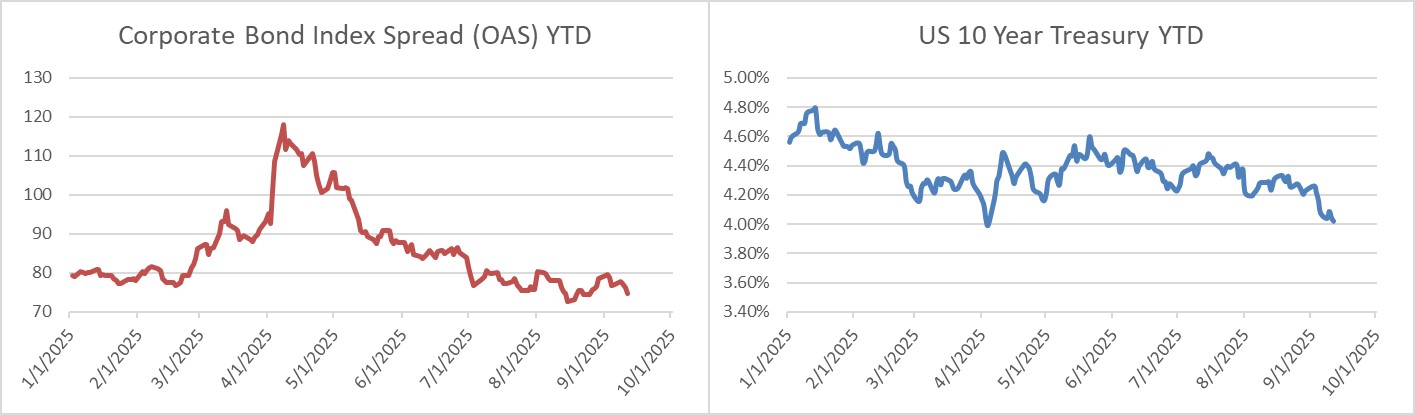
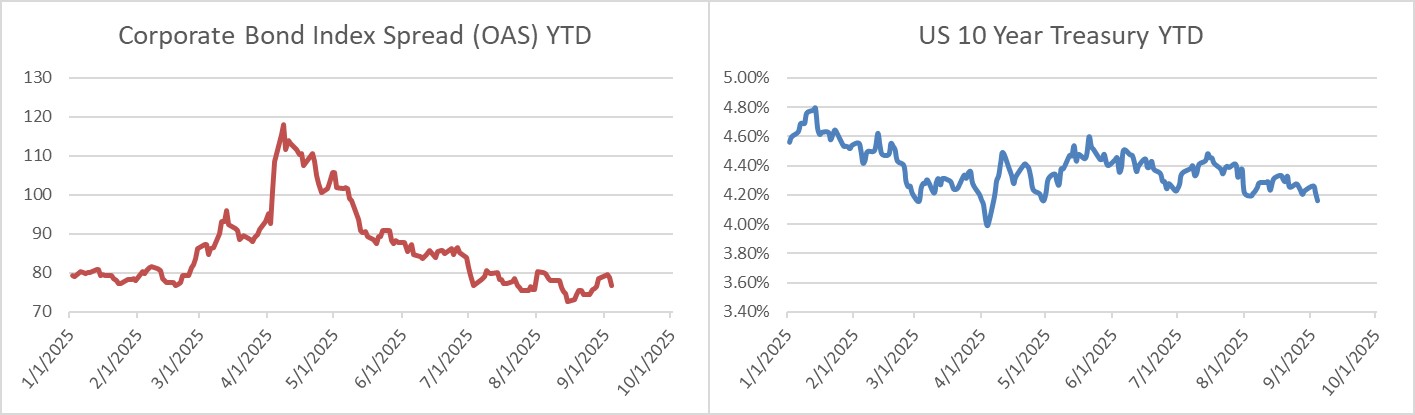
Category: Investment Grade Weekly

28 Jun 2024

CAM Investment Grade Weekly Insights

Credit spreads were little changed during the week.  The Bloomberg US Corporate Bond Index closed at 94 on Thursday June 27 after closing the week prior at the same level.  The 10yr Treasury yield is slightly higher on the week, trading at 4.33% this Friday afternoon after closing last week at 4.26%. Through Thursday, the corporate bond index YTD total return was -0.02% while the yield-to-maturity for the benchmark was 5.43%.

Economics

Economic data this week was mostly in line with consensus and there were no major surprises.  Highlights included a consumer confidence reading that was slightly below expectations and personal income data that came in slightly above expectations.  The biggest release this week was Friday morning’s PCE price index which was about as consistent with expectations as it possibly could be.  The release showed that the disinflationary environment sustained some momentum during May but it was probably not enough to make the Fed turn dovish.  Continued progress will be needed if the Fed expects to follow through with two cuts in the latter half of the year.  Next week is another disjointed one with several important releases early in the week (PMI, ISM manufacturing/services and durable goods) followed by a market holiday on Thursday in observance of Independence Day.  The biggest release of the week occurs on Friday morning with the employment report for the month of June.  Looking ahead, the Fed does not meet again until the very end of July.

Issuance

The IG primary market was strong this week as borrowers priced nearly $32bln in new debt, well ahead of the $20bln estimate.  More than half of this week’s volume was from borrowers outside the U.S., with Asia Pacific firms and governments leading the way.  So, although issuance was robust, it wasn’t coming from borrowers that are necessarily household names.  Next week syndicate desks are looking for a quiet week with just $5bln of issuance and only $80bln of issuance for the seasonally slow month of July (that estimate would make it the lowest volume month so far in 2024).  According to sources compiled by Bloomberg, after a record first quarter, the pace of issuance in 2024 slowed during the second quarter making 2024 the second busiest first half to a year on record.  It was eclipsed only by the surge in borrowing that occurred during the trading days that followed the official onset of the 2020 pandemic.


Flows

According to LSEG Lipper, for the week ended June 26, investment-grade bond funds reported a net inflow of +$0.389bln.  Short and intermediate investment-grade bond funds have seen positive flows 23 of the past 26 weeks.  YTD flows into IG stand at +$37.2bln.


This information is intended solely to report on investment strategies identified by Cincinnati Asset Management. Opinions and estimates offered constitute our judgment and are subject to change without notice, as are statements of financial market trends, which are based on current market conditions. This material is not intended as an offer or solicitation to buy, hold or sell any financial instrument. Fixed income securities may be sensitive to prevailing interest rates. When rates rise the value generally declines. Past performance is not a guarantee of future results.

21 Jun 2024

CAM Investment Grade Weekly Insights

Credit spreads moved incrementally wider for the second consecutive week. The Bloomberg US Corporate Bond Index closed at 94 on Thursday, June 20, after closing the week prior at 92. It isn’t shocking to see spreads take a breather as they have been at tight levels relative to historical trading ranges, and they have widened in concert with Treasury yields, which have decreased in recent weeks. The 10-year Treasury yield is nearly unchanged on the week, trading at 4.23% this Friday morning after closing last week at 4.22%. Through Thursday, the corporate bond index YTD total return was +0.16% while the yield-to-maturity for the benchmark was 5.39%. All-in yields remain elevated relative to the recent past – the average yield on the corporate index over the past 10 years was 3.56%, 183 bps lower than the yield available to investors today.


Economics

It was another busy week for economic data with a bevy of highlights. On Monday, we got an Empire Manufacturing print for that region that was better than feared but still showed contraction. Retail sales on Tuesday missed to the downside, and the release was also accompanied by downward revisions to previous months. It is too early to tell, but some economists believe that this could be the beginning of a sustained softening in consumer sentiment. On Thursday, we got housing data that showed new construction starts hit a four-year low. Lastly, on Friday, S&P’s data showed that U.S. services activity expanded in a broad-based way so far during the month of June. Positively, the survey also showed further softening of price pressures and a rebound in domestic manufacturing activity. Next week is pretty quiet on the data front until Thursday’s GDP and core PCE releases.

Issuance

The IG primary market rebounded this week as companies priced $31.4 billion of new debt – an impressive haul in a holiday-shortened week. We were unsure if issuance would really come through due to a spate of economic data and a looming summer slowdown, but Monday got the week off to a hot start as 13 issuers priced more than $21 billion. Next week, syndicate desks are looking for around $20 billion of issuance, but all it takes is one big issuer to push that total higher, much like we saw with Home Depot this week, which issued $10 billion on Monday to fund its acquisition of SRS Distribution.

Flows

According to LSEG Lipper, for the week ended June 19, investment-grade bond funds reported a net outflow of -$0.433 billion. This was the first outflow from IG funds in over a month, which have seen positive flows 22 of the past 25 weeks. YTD flows into IG stand at +$36.8 billion.


This information is intended solely to report on investment strategies identified by Cincinnati Asset Management. Opinions and estimates offered constitute our judgment and are subject to change without notice, as are statements of financial market trends, which are based on current market conditions. This material is not intended as an offer or solicitation to buy, hold or sell any financial instrument. Fixed income securities may be sensitive to prevailing interest rates. When rates rise the value generally declines. Past performance is not a guarantee of future results.

14 Jun 2024

CAM Investment Grade Weekly Insights

Credit spreads are slightly wider on the week.  The Bloomberg US Corporate Bond Index closed at 90 on Thursday June 13 after closing the week prior at 88.  Although this was the widest level for the index since late April, it is only 5bps off the tightest levels of the year which illustrates just how “unchanged” the index has been for the past month and a half.  The 10yr Treasury yield is lower this week, trading at 4.20% this Friday morning after closing last week at 4.43%. Through Thursday, the corporate bond index YTD total return was +0.41% while the yield-to-maturity for the benchmark was 5.33%.


Economics

There was a bounty of economic data this week with the biggest events occurring on Wednesday and Thursday.  Core CPI Inflation data for May was released on Wednesday morning, declining to +0.2% MoM relative to consensus of +0.3%.  This deceleration was a welcome relief on the heels of some hotter prints earlier this year.  However, this was just one data point and it does not make a trend.  On Wednesday afternoon the FOMC released its policy decision with no change in the Fed Funds rate, as expected.  The press conference was on script but there were some notable changes in the Summary of Economic Predictions (SEP aka The Dot Plot).  The SEP showed slightly higher Fed inflation forecasts for 2024 and 2025 and a move in the median number of cuts for 2024 from 3 to 1.  Interestingly, 4 of the 19 FOMC members are now expecting no cuts in 2024, which was up from 1 member in March.  Recall that the SEP is released every three months so the next update will not occur until September 18.  Thursday morning brought more good news on the inflation front as the PPI release showed that US producer prices declined in May by the most in seven months.  PPI for May came in at -0.2% versus the estimate of +0.1% but nearly 60% of the decline in the May PPI for goods was due to declining gasoline costs.  Next week is another busy one for economic data with empire manufacturing, retail sales, housing starts and global PMI, to name a few.

Issuance

The IG primary market was extremely slow this week as borrowers priced just $5.75bln in new debt.  According to Bloomberg, excluding seasonality and holiday-shortened weeks, this was the lowest volume total since borrowers raised $4.25bln in the week ended 12/9/2022.  The low issuance tally was really much ado about nothing: with CPI/Fed on Wednesday, that day was effectively closed to borrowers.  Interest rate volatility plus the beginning of summer seasonality likely kept a few issuers at bay on the other days. Year-to-date issuance remains robust, standing at $803bln YTD, up +20% relative to 2023.  Next week, dealers are calling for $25-$30bln in new supply.  While we expect some issuance as borrowers look to take advantage of lower borrowing costs, we are skeptical that it will be that strong of a week given the busy economic calendar and the fact that bond and equity markets are closed on Wednesday in observance of Juneteenth.

Flows

According to LSEG Lipper, for the week ended June 12, investment-grade bond funds reported a net inflow of +$0.989bln.  IG funds have seen positive flows 22 of the past 24 weeks.  YTD flows into IG stand at +$37.2bln.


This information is intended solely to report on investment strategies identified by Cincinnati Asset Management. Opinions and estimates offered constitute our judgment and are subject to change without notice, as are statements of financial market trends, which are based on current market conditions. This material is not intended as an offer or solicitation to buy, hold or sell any financial instrument. Fixed income securities may be sensitive to prevailing interest rates. When rates rise the value generally declines. Past performance is not a guarantee of future results.

17 May 2024

CAM Investment Grade Weekly Insights

Credit spreads have exhibited little change this week.  The Bloomberg US Corporate Bond Index closed at 87 on Thursday May 16 after closing the week prior at the same level.  The 10yr Treasury yield is lower this week, trading at 4.42% this Friday afternoon after closing last week at 4.50%. Through Thursday, the corporate bond index YTD total return was -0.74% while the yield-to-maturity for the benchmark was 5.44% relative to its 5-year average of 3.69%.


Economics

It was an action-packed week for data with a hot Producer Price Index (PPI) print kicking things off on Tuesday.  Market participants were on guard following PPI as many were expecting a similar surprise to the upside for the Wednesday CPI release. Instead, we got a relatively benign CPI number with weaker than expected inflation.  Wednesday also saw a retail sales release which showed a decline in April and it was also accompanied by downward revisions for sales during the first quarter.  The inflation and sales releases are dovish indicators and Treasury yields subsequently declined after those Wednesday releases, recouping some of the sell-off in rates that occurred after the hot PPI release early on Tuesday.  The next couple weeks are relatively light on the data front and the next Fed meeting on June 12 will be here before we know it.

Issuance

The IG primary market saw good activity on the week as 21 companies sold just over $28bln in new debt.  Syndicate desks are looking $25bln next week but that number could surprise to the upside as earnings season is winding down and there is no major economic data that will preclude issuers from tapping the market on any given day.  Year-to-date issuance stands at $719.8bln, well ahead of last year’s pace.

Flows

According to LSEG Lipper, for the week ended May 15, investment-grade bond funds reported a net outflow of -$1.04bln.  IG funds have seen positive flows 18 of the past 20 weeks.  YTD flows into IG stand at +$33.6bln.


This information is intended solely to report on investment strategies identified by Cincinnati Asset Management. Opinions and estimates offered constitute our judgment and are subject to change without notice, as are statements of financial market trends, which are based on current market conditions. This material is not intended as an offer or solicitation to buy, hold or sell any financial instrument. Fixed income securities may be sensitive to prevailing interest rates. When rates rise the value generally declines. Past performance is not a guarantee of future results.

03 May 2024

CAM Investment Grade Weekly Insights

Credit spreads stuck to a tight range during the week and are looking as though they will finish the period relatively unchanged from where they began.  The Bloomberg US Corporate Bond Index closed at 87 on Thursday May 2 after closing the week prior at the same level.  The 10yr Treasury yield is lower this week, trading at 4.51% this Friday afternoon after closing last week at 4.66%. Through Thursday, the corporate bond index YTD total return was -2.20% while the yield-to-maturity for the benchmark was 5.60% relative to its 5-year average of 3.67%.

Economics

It was a busy week for data with the two main events being the FOMC on Wednesday and the April payroll report on Friday.  The Fed release was in-line with expectations although Chairman Powell was clear that the committee does not anticipate additional rate hikes. The prospect for additional hikes was a theme that some investors had been latching onto in recent weeks so it was reassuring for the dovish camp to hear Powell address this specifically.  The Fed then got the type of data point they have been looking for with Friday’s jobs report: average hourly earnings came in cooler than expectations and job gains for April slowed to 175,000 versus the survey estimate of 240,000.  This was the lightest monthly print for payrolls since October of last year.  Next week is an extremely light week for economic data with the only meaningful prints in the latter half of the week with jobless claims and consumer confidence releases.

Issuance

It was a reasonably busy week for issuance considering the backdrop of earnings and the FOMC meeting as IG-rated companies printed $19bln of new debt.  Syndicate desks are looking for a busier week next week with an estimate of $30bln.  The window for new issuance will start to open up as earnings season winds down and with the lack of the aforementioned “market-moving” economic releases.  Year-to-date issuance stands at $636bln.

Flows

According to LSEG Lipper, for the week ended May 1, investment-grade bond funds reported a net inflow of +$812mm.  IG funds have seen positive flows 17 of the past 18 weeks.  YTD flows into IG stand at +$33.7bln.


This information is intended solely to report on investment strategies identified by Cincinnati Asset Management. Opinions and estimates offered constitute our judgment and are subject to change without notice, as are statements of financial market trends, which are based on current market conditions. This material is not intended as an offer or solicitation to buy, hold or sell any financial instrument. Fixed income securities may be sensitive to prevailing interest rates. When rates rise the value generally declines. Past performance is not a guarantee of future results.

26 Apr 2024

CAM Investment Grade Weekly Insights

Credit spreads battled through some volatility this week before moving tighter near the end of the period.  The Bloomberg US Corporate Bond Index closed at 89 on Thursday April 25 after closing the week prior at 92.  The 10yr Treasury yield is up slightly on the week, trading at 4.67% this Friday afternoon after closing last week at 4.62%. Through Thursday, the corporate bond index YTD total return was -3.22% while the yield-to-maturity for the benchmark was 5.75% relative to its 5-year average of 3.66%.

Economics

Most of the big economic news of the week occurred in the second half of the period.  Durable goods orders were released on Wednesday with a headline number for March that was in-line with consensus but accompanied by a significant revision downward in February’s number.  GDP data on Thursday was very weak relative to expectations, coming in at +1.6% versus the survey of +2.5% which caused a sizeable selloff in equities and ironically sent Treasury yields higher as the inflationary component of GDP advanced higher relative to expectations.  Friday saw the release of personal spending data as well as PCE data with both coming in hot versus economist estimates.  Taking it all together, there was something for both hawks and doves but none of these numbers are likely to be a game changer for the Fed in its zeal to cut rates.  The FOMC releases its May rate decision next Wednesday and interest rate futures are currently implying just a 2.6% probability of a cut as we go to print this Friday afternoon.  The ride on the road to policy easing continues to be a long and complicated journey.

Issuance

It was the slowest week of the year for new issue with only four borrowers tapping the market for a total of $11.6bln.  The consensus estimate of $20-$25bln was obviously too optimistic especially considering 32% of the S&P 500 reported earnings this week.  Next week is another busy one for earnings and with a Fed meeting on Wednesday prognosticators are only looking for $15bln in new supply.  Year-to-date issuance stands at $616.8bln, up >40% relative to 2023.

Flows

According to LSEG Lipper, for the week ended April 24, investment-grade bond funds reported a net outflow of -$607mm.  This was the first outflow of 2024, breaking a streak of 18 consecutive weeks of inflow for IG funds.  YTD flows into IG stand at +$32.9bln.

This information is intended solely to report on investment strategies identified by Cincinnati Asset Management. Opinions and estimates offered constitute our judgment and are subject to change without notice, as are statements of financial market trends, which are based on current market conditions. This material is not intended as an offer or solicitation to buy, hold or sell any financial instrument. Fixed income securities may be sensitive to prevailing interest rates. When rates rise the value generally declines. Past performance is not a guarantee of future results.

19 Apr 2024

CAM Investment Grade Weekly Insights

Spreads finally took a breather this week as the market moved modestly wider throughout the period.  The Bloomberg US Corporate Bond Index closed at 92 on Thursday April 18 after closing the week prior at 89.  The 10yr Treasury yield is higher again this week and is trading at 4.63% this Friday morning after closing last week at 4.52%. Higher Treasury yields have been a headwind for IG returns so far this year –through Thursday, the index YTD total return was -3.07% while the yield-to-maturity for the benchmark was 5.73% relative to its 5-year average of 3.65%.

Economics

Things got off to a hot start right away on Monday morning as March retail sales data beat expectations in a big way.  Some economists have argued that an early Easter may have pulled some spending forward from April into March but there is no denying that it was a very solid number and yet another data point showing a resilient economy. Federal Reserve chairman Jerome Powell may finally be coming around to the realization that the Fed will have difficulty justifying near term rate cuts.  At an economic forum on Tuesday, Powell commented on rate cuts: “The recent data have clearly not given us greater confidence and indicate that it is likely to take longer than expected to achieve that confidence.” Not all the data was rosy this week as Thursday’s existing home sales release showed a 4.3% decline from February, the biggest monthly drop in over a year.  Additionally, higher Treasury yields caused the average rate on the standard 30-year fixed rate mortgage to surge to 7.1%. Next week we get plenty of data with the grand finale on Friday morning when Core PCE will hit the tape.

Issuance

Issuance was on the screws relative to estimates on the week as volume came in at just over $31bln, although there was not much diversity with the financial sector accounting for 90% of that number.  Syndicate desks are looking for $20-$25bln of new bonds next week.  Year-to-date issuance stands at $605.2bln, up +42% relative to 2023.  It “feels” like new issue concessions showed some improvement on the week but the reality is that it has not yet shown up in the numbers.  Even still, data did show that 66% of deals priced this week rallied in the secondary market.

Flows

According to LSEG Lipper, for the week ended April 17, investment-grade bond funds reported a net inflow of +$170mm.  This was the 18th consecutive weekly inflow for IG funds.  YTD flows into IG stand at +$33.5bln.

This information is intended solely to report on investment strategies identified by Cincinnati Asset Management. Opinions and estimates offered constitute our judgment and are subject to change without notice, as are statements of financial market trends, which are based on current market conditions. This material is not intended as an offer or solicitation to buy, hold or sell any financial instrument. Fixed income securities may be sensitive to prevailing interest rates. When rates rise the value generally declines. Past performance is not a guarantee of future results.

12 Apr 2024

CAM Investment Grade Weekly Insights

Spreads inched tighter during the week with the Bloomberg US Corporate Bond Index at its narrowest level of the year.  The index closed at 87 on Thursday April 11 after having closed the week prior at 89.  The 10yr is trading at 4.52% this Friday morning after closing last week at 4.40%. Through Thursday, the index YTD total return was -2.40% while the yield-to-maturity for the benchmark was 5.62% relative to its 5-year average of 3.65%.

Economics

It was an active week for economic data with the highlight of the week being another firmer than anticipated CPI print on Wednesday.  This caused a sell-off in Treasuries with the 2-year leading the way as its yield finished the day 23bps higher.  At the end of Wednesday, rates across the board were at the highest levels of 2024 but have since come off the highs and the entire curve is rallying to the tune of about 10bps as we go to print this Friday morning.  These short term moves should not distract corporate bond investors from the bigger picture: this is an asset class that is well poised to deliver solid returns in the future, in our opinion.  This entire year we have been saying that we felt that the bar was quite high for the Fed to begin cutting rates because the economy was simply too strong and the economic data too good.  We were quite puzzled in January when interest rate futures were pricing 6 or 7 cuts despite a Fed dot plot that indicated 3 cuts at the median.  The market has now come around to our view with futures pricing just shy of 2 cuts in 2024 as of this Friday morning.  It is clear from its messaging that the Fed wants to cut and we know it is coming at some point.  We believe that cuts would be a positive for our strategy as we think that it would be an important catalyst for Treasury curves to regain some upward positive slope.  The Fed will cut when the data that it depends on will allow it to cut.  It is as simple as that.  In the interim, we believe that this backup in rates has created an opportunity for long term credit investors.  We would not be surprised if we were to look back a year or two from now and long for the yields that are available to corporate credit investors today.


Issuance

Issuance was in-line with estimates on the week as companies priced $20.2bln of new debt.  Next week dealers are estimating $30bln of new supply with banks leading the way as they report earnings and exit their blackout periods.  Year-to-date issuance stands at $573.7bln, up 39% relative to 2023.

Flows

According to LSEG Lipper, for the week ended April 10, investment-grade bond funds reported a net inflow of +$3.2bln.  This was the 17th consecutive weekly inflow for IG funds.  YTD flows into IG stand at +$33.3bln.

This information is intended solely to report on investment strategies identified by Cincinnati Asset Management. Opinions and estimates offered constitute our judgment and are subject to change without notice, as are statements of financial market trends, which are based on current market conditions. This material is not intended as an offer or solicitation to buy, hold or sell any financial instrument. Fixed income securities may be sensitive to prevailing interest rates. When rates rise the value generally declines. Past performance is not a guarantee of future results.

22 Mar 2024

CAM Investment Grade Weekly Insights

Spreads stuck to a tight range this week and are looking to finish the period at the narrowest levels of 2024.  The Bloomberg US Corporate Bond Index closed at 88 on Thursday March 21 after having closed the week prior at 89.  The 10yr is trading at 4.22% this Friday morning after closing last week at 4.31%. Through Thursday, the Investment Grade Corporate Index YTD total return was -1.00%.  The story remains the same: spreads are tight but yields are elevated.  The yield to maturity for the Bloomberg US Corporate Bond index as of Thursday evening was 5.34%.

Economics

It was a light week for economic data but an extremely busy week for central banks throughout the globe.  There were rate decisions from Australia, the BOJ, the BOE and of course the FOMC, among others.  Chairman Powell walked a tightrope in his press conference and the market interpreted the Fed release as slightly dovish.  The Fed made it clear that rate cuts are still on the agenda with its updated dot projections.  The market is currently coalescing around 3 cuts for a total of 75bps beginning at the June meeting.  This is far from certain in our view and only time (and ensuing economic data) will tell.  As of this morning, interest rate futures are implying a 65% chance of a cut in June.

Issuance

Issuance was in-line with estimates on the week as companies priced more than $27bln of new debt.  For the year, the torrid pace of issuance has now officially passed the half trillion mark, with 2024 setting a new record for how quickly $500bln was breached.  Next week dealers are estimating $20bln of new supply.  This number is certainly achievable, especially if Monday is busy, but we would not be surprised if the issuance tally is underwhelming relative to expectations.  It is typically a seasonally slow week and the bond market closes early on Friday leaving Monday and Tuesday as the most favorable days for new issue prints.

Flows

According to LSEG Lipper, for the week ended March 20, investment-grade bond funds reported a net inflow of +$1.4bln.  This was the 14th consecutive weekly inflow for IG funds.  YTD flows into IG stand at +$23.9bln.

This information is intended solely to report on investment strategies identified by Cincinnati Asset Management. Opinions and estimates offered constitute our judgment and are subject to change without notice, as are statements of financial market trends, which are based on current market conditions. This material is not intended as an offer or solicitation to buy, hold or sell any financial instrument. Fixed income securities may be sensitive to prevailing interest rates. When rates rise the value generally declines. Past performance is not a guarantee of future results.

15 Mar 2024

CAM Investment Grade Weekly Insights

Spreads moved tighter throughout the week.  The Bloomberg US Corporate Bond Index closed at 91 on Thursday March 15 after having closed the week prior at 95.  The 10yr is trading at 4.31% this Friday morning after closing last week at 4.07%. Through Thursday, the Investment Grade Corporate Index YTD total return was -1.40%.  Although spreads are near the tight end of their historical range, yields remain significantly higher than they have been in the recent past and meaningfully higher than they have been for most of the past two decades.  The yield to maturity for the Bloomberg US Corporate Bond index as of Thursday evening was 5.4%, relative to its 10 and 20-year averages of 3.49% and 4.15%, respectively.

Economics

It was a mixed week for economic data but, overall, the economy remains resilient and the job market hasn’t yet lost its luster.  On Tuesday, the core CPI gauge exceeded expectations for the second straight month.  Headline CPI was up +3.2% year over year in February, slightly ahead of the +3.1% recorded for January.  On Thursday, the data had something for both Hawks and Doves.  PPI came in hot with pries paid during the month of February exceeding estimates while an employment report showed that fewer people were applying for jobless benefits.  On the other side of the coin, tepid February retail sales data showed that consumer spending slowed relative to estimates.  Market expectations have continued to shift –last week at this time interest rate futures were showing that investors were looking for 3 or 4 rate cuts in 2024 while this week the consensus has shifted more toward only 3 cuts.  Next week is extremely light on the data front with the exception of the main event on Wednesday as all eyes will be on the FOMC rate decision.  The Fed will also release its first update to the vaunted dot plot since December of 2023.


Issuance

In was another solid week of issuance as companies priced over $37bln of new debt, in line with sell side estimates.  2024 continues to be the busiest year in the history of the investment grade primary market with supply running at ~$476bln YTD, which is +36% higher than 2023’s pace.  Next week is expected to see supply slow slightly with dealers estimating $25-$30bln of new supply.

Flows

According to LSEG Lipper, for the week ended March 13, investment-grade bond funds reported a net inflow of +$1.61bln.  This was the thirteenth consecutive weekly inflow for IG funds.  YTD flows into IG stand at +$22.5bln relative to +$13.1bln for the same period last year.  Demand for IG credit has been strong as investors look to lock-in yields ahead of potential Fed rate-cuts.

This information is intended solely to report on investment strategies identified by Cincinnati Asset Management. Opinions and estimates offered constitute our judgment and are subject to change without notice, as are statements of financial market trends, which are based on current market conditions. This material is not intended as an offer or solicitation to buy, hold or sell any financial instrument. Fixed income securities may be sensitive to prevailing interest rates. When rates rise the value generally declines. Past performance is not a guarantee of future results.