Category: Investment Grade Quarterly

14 Jul 2023

2023 Q2 Investment Grade Quarterly

Click here to read the Spanish version / Haga clic aquí para leer la versión en español

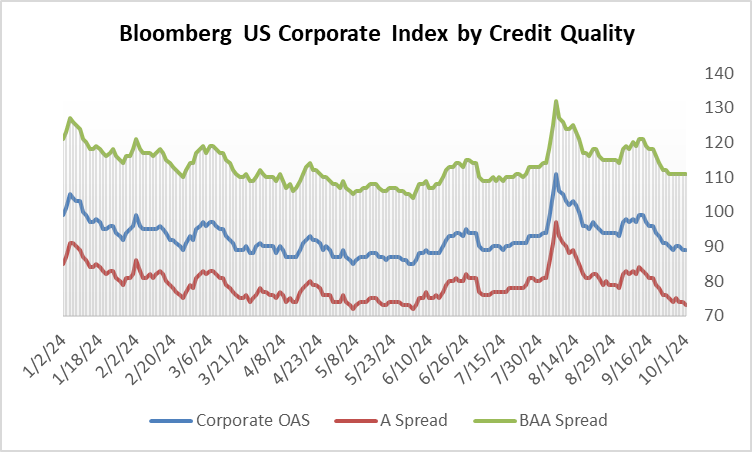
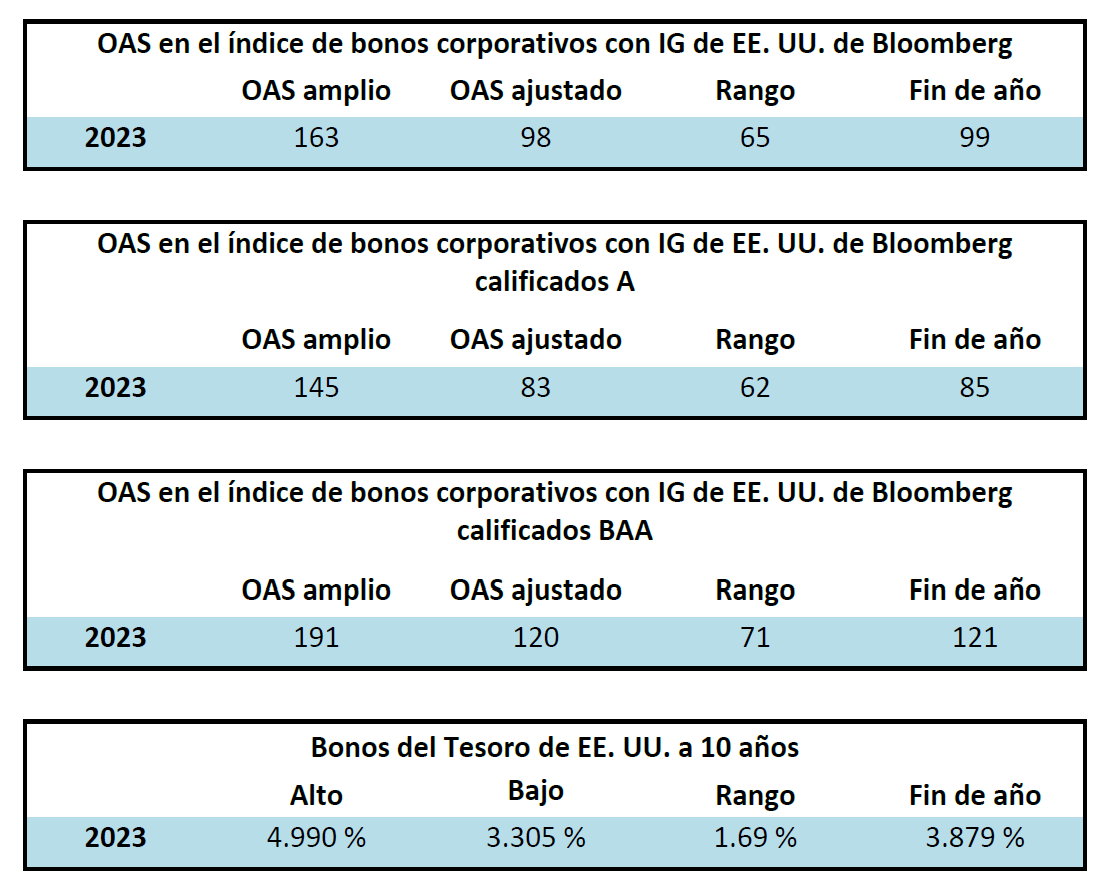
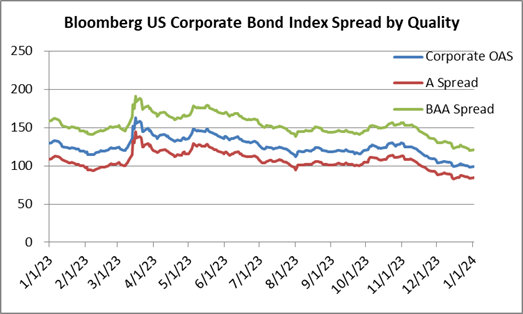
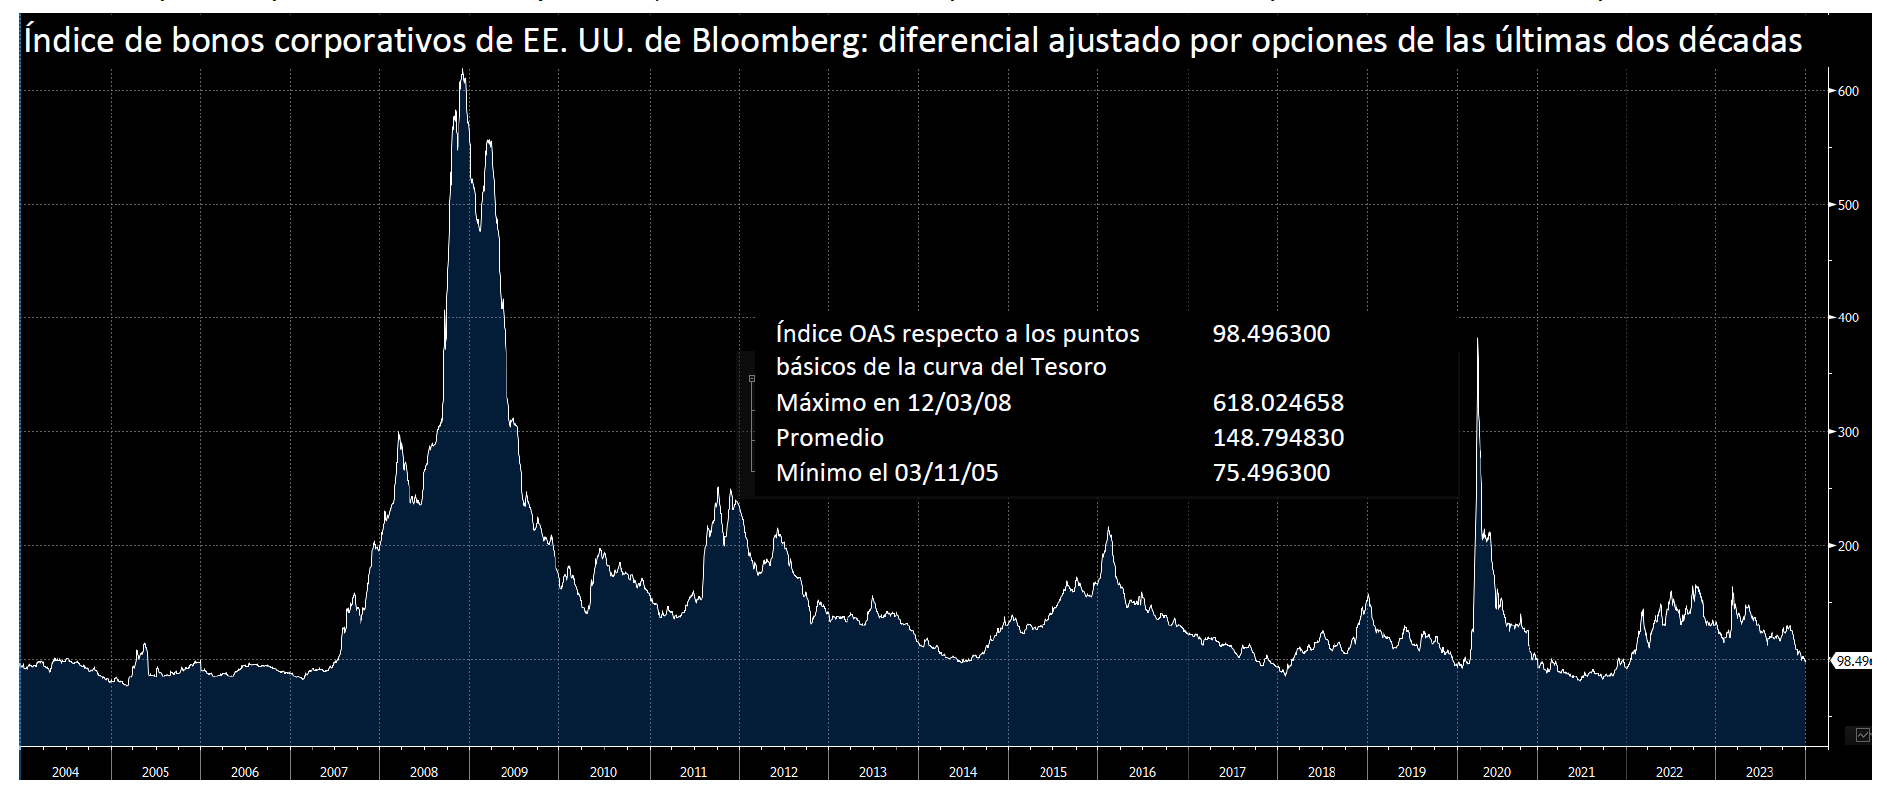
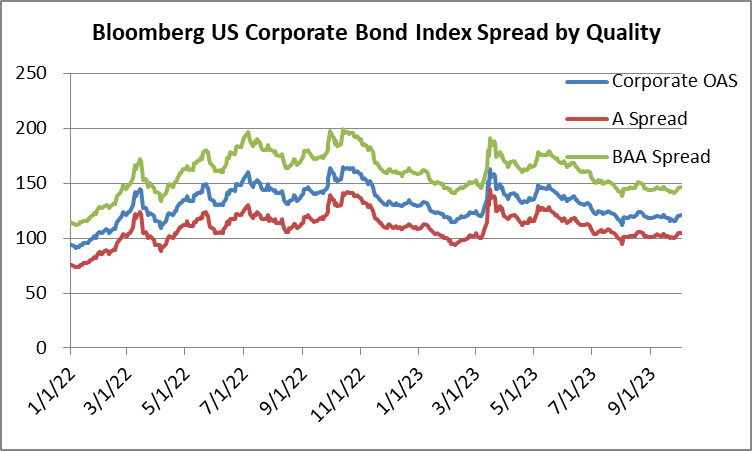
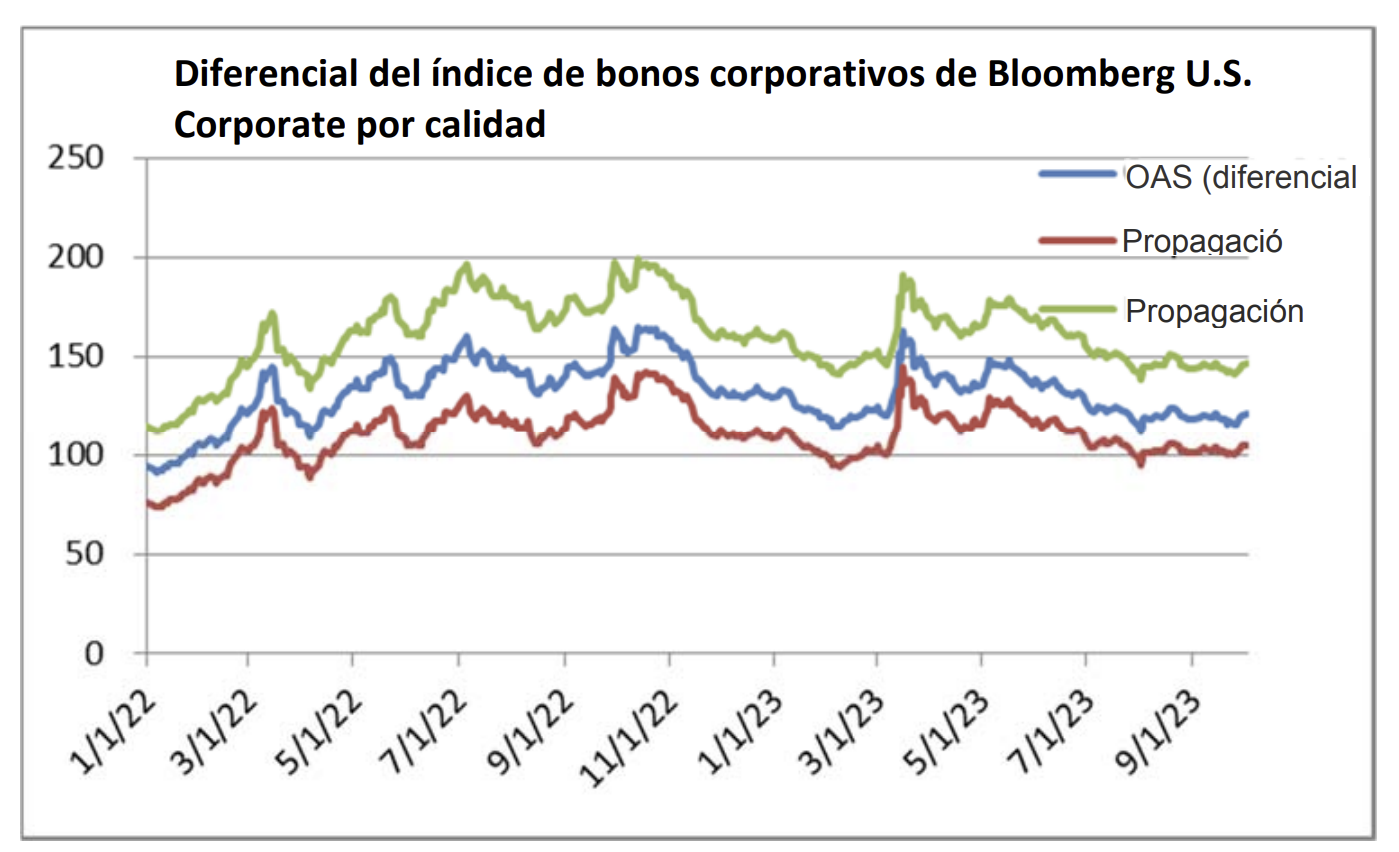
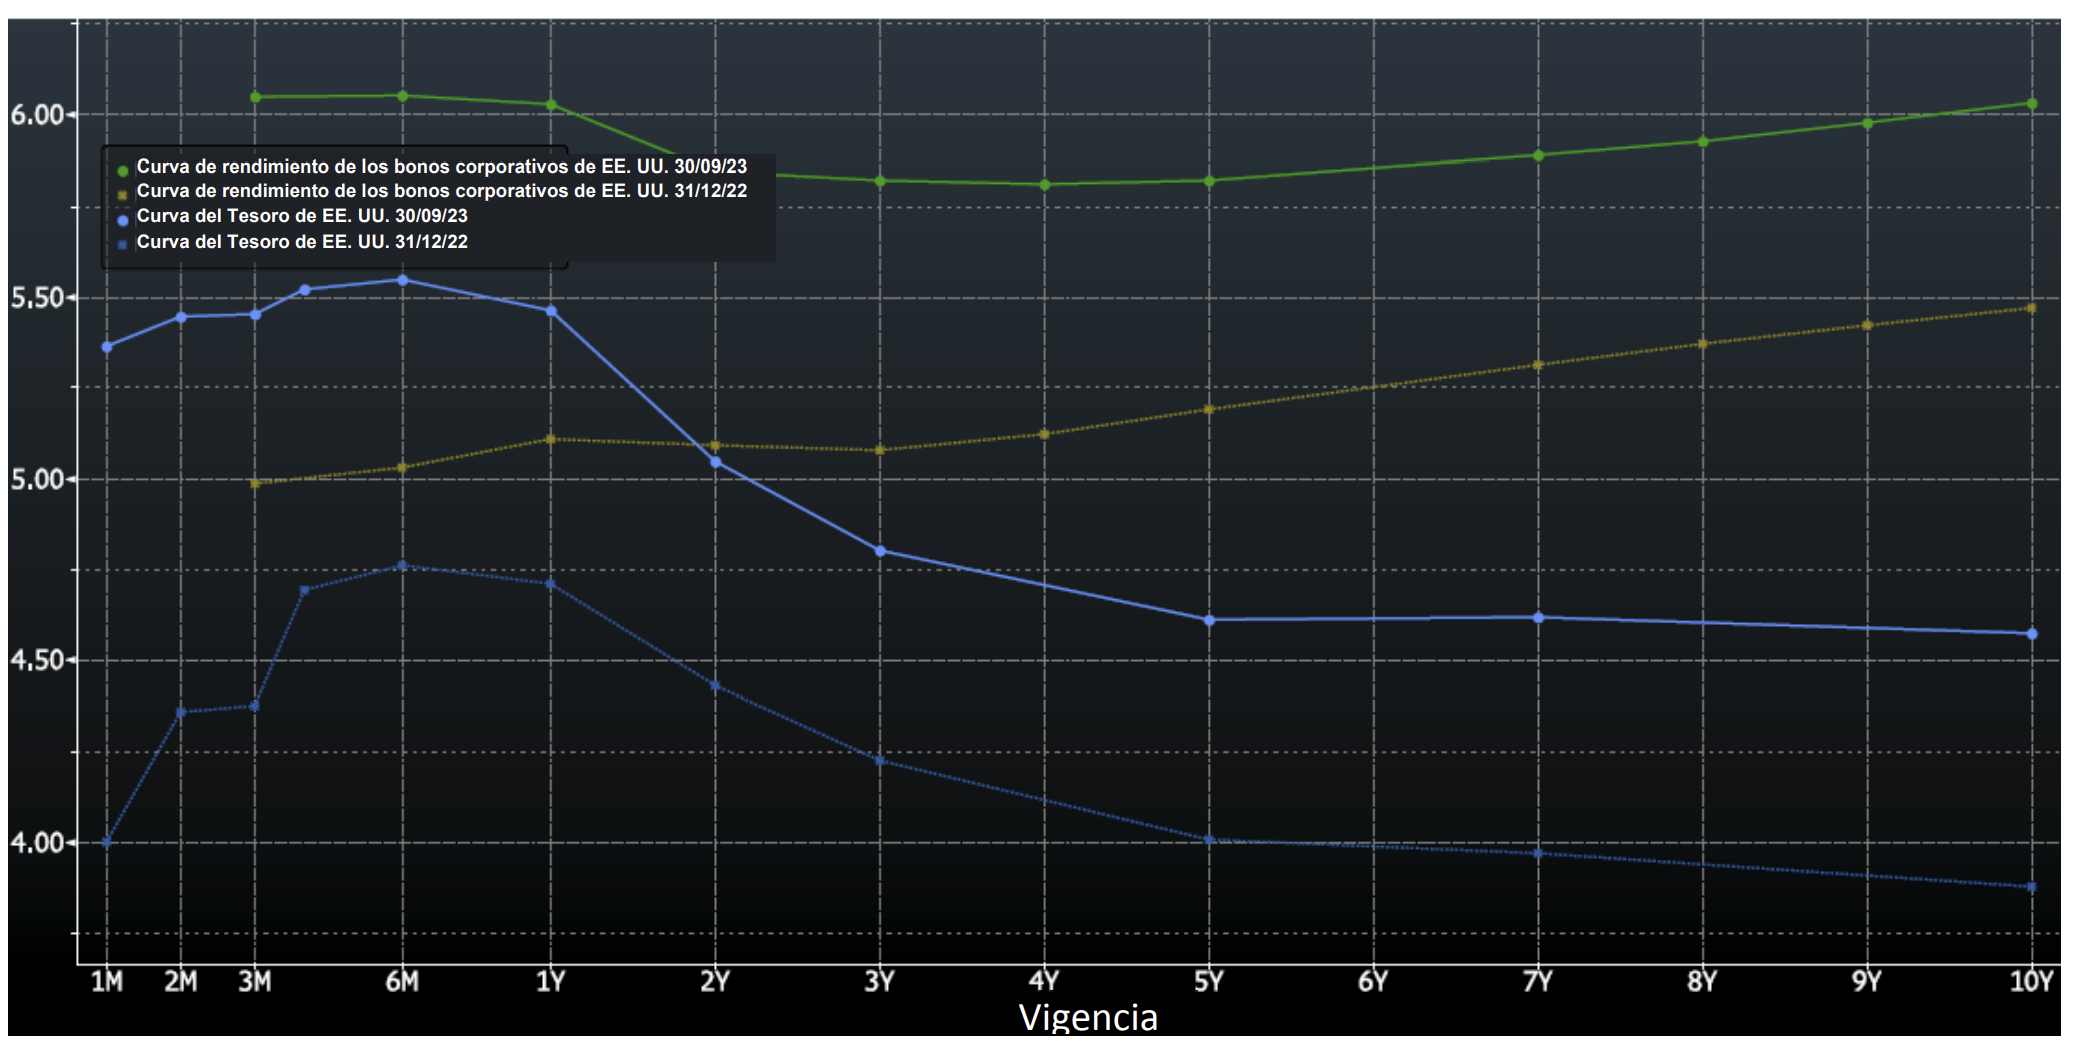
Investment grade credit returns were softer in the second quarter, although year-to-date performance for the asset class remained in positive territory.  During the quarter, the Option Adjusted Spread (OAS) on the Bloomberg US Corporate Bond Index tightened by 15 basis points to 123 after having opened at 138.  Higher interest rates were a headwind for returns as the 10yr Treasury yield increased by 37 basis points in the period, moving from 3.47% to 3.84%.

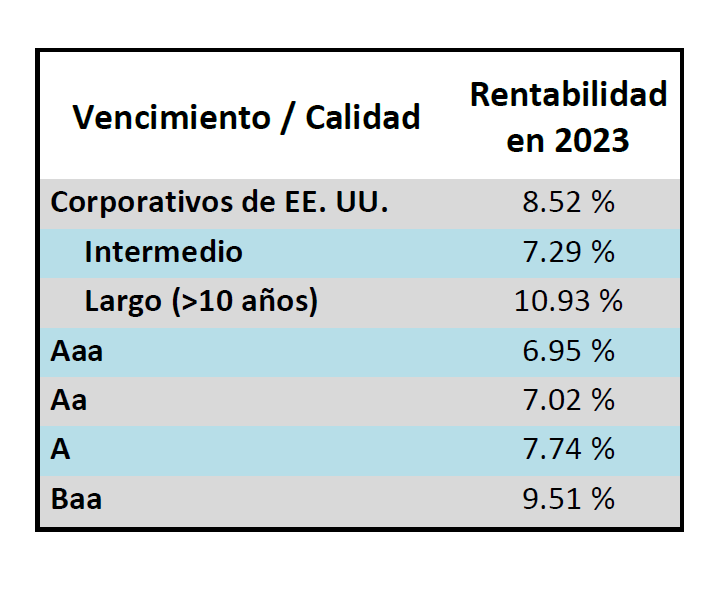
The Corporate Index posted a quarterly total return of -0.29%.  CAM’s Investment Grade Program net of fees total return was -0.33%.

Market Update

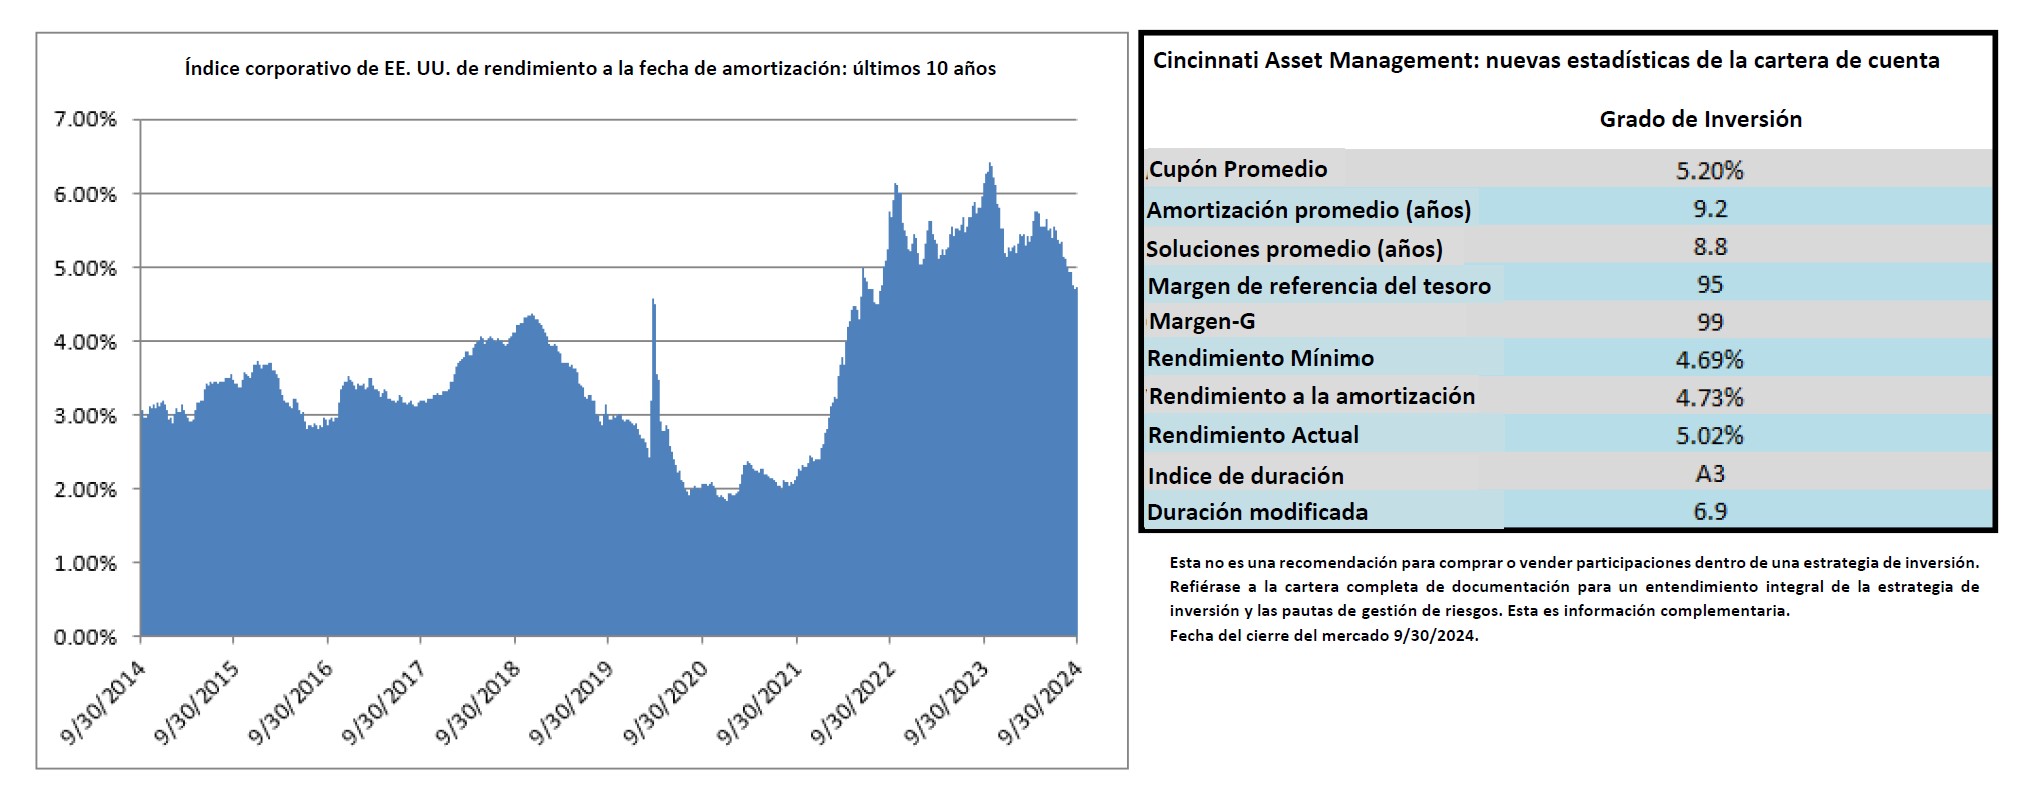
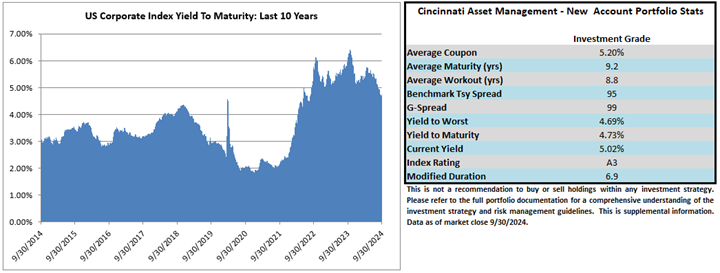
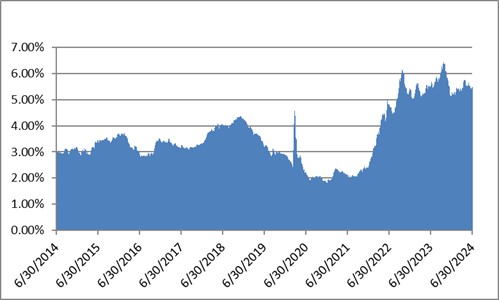
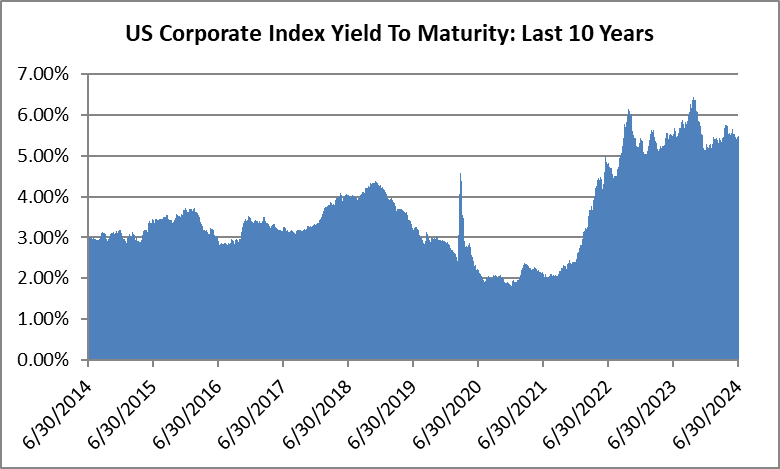
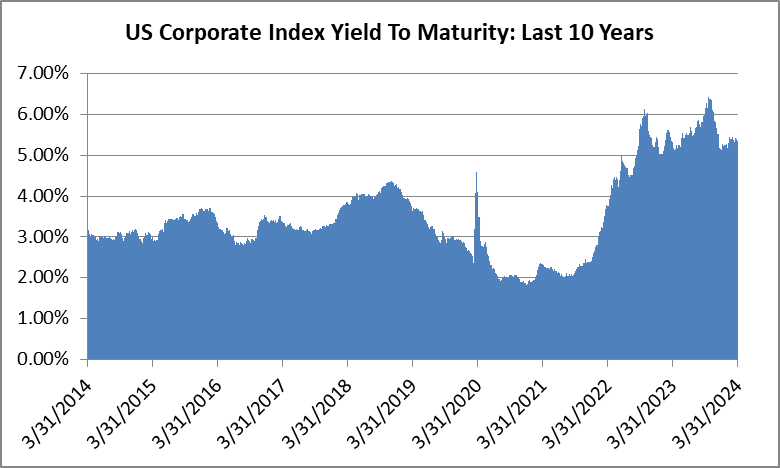
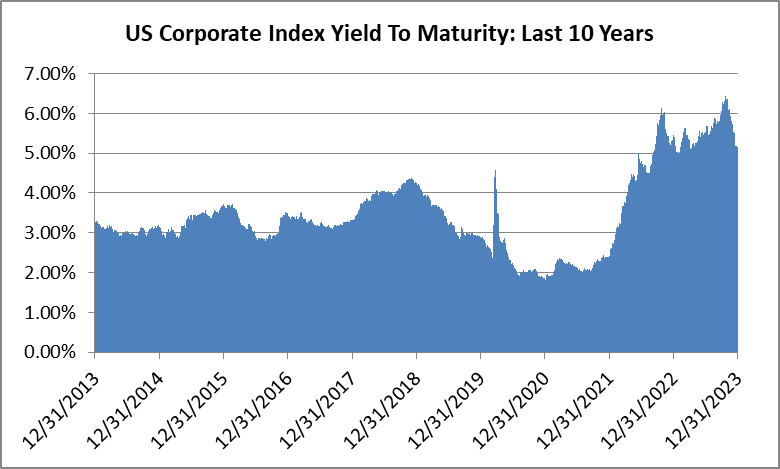
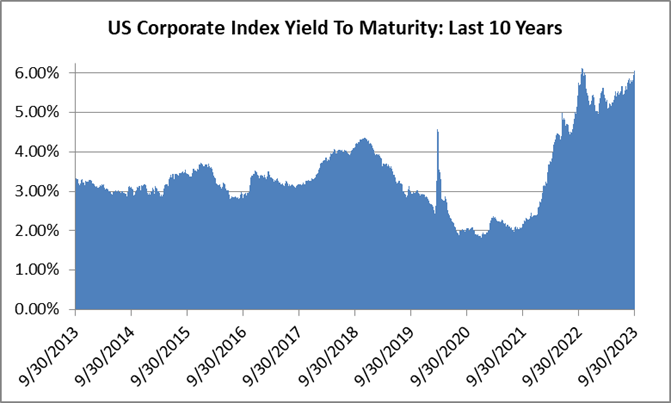
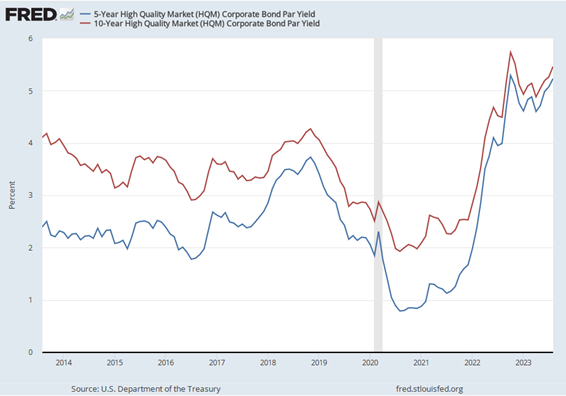
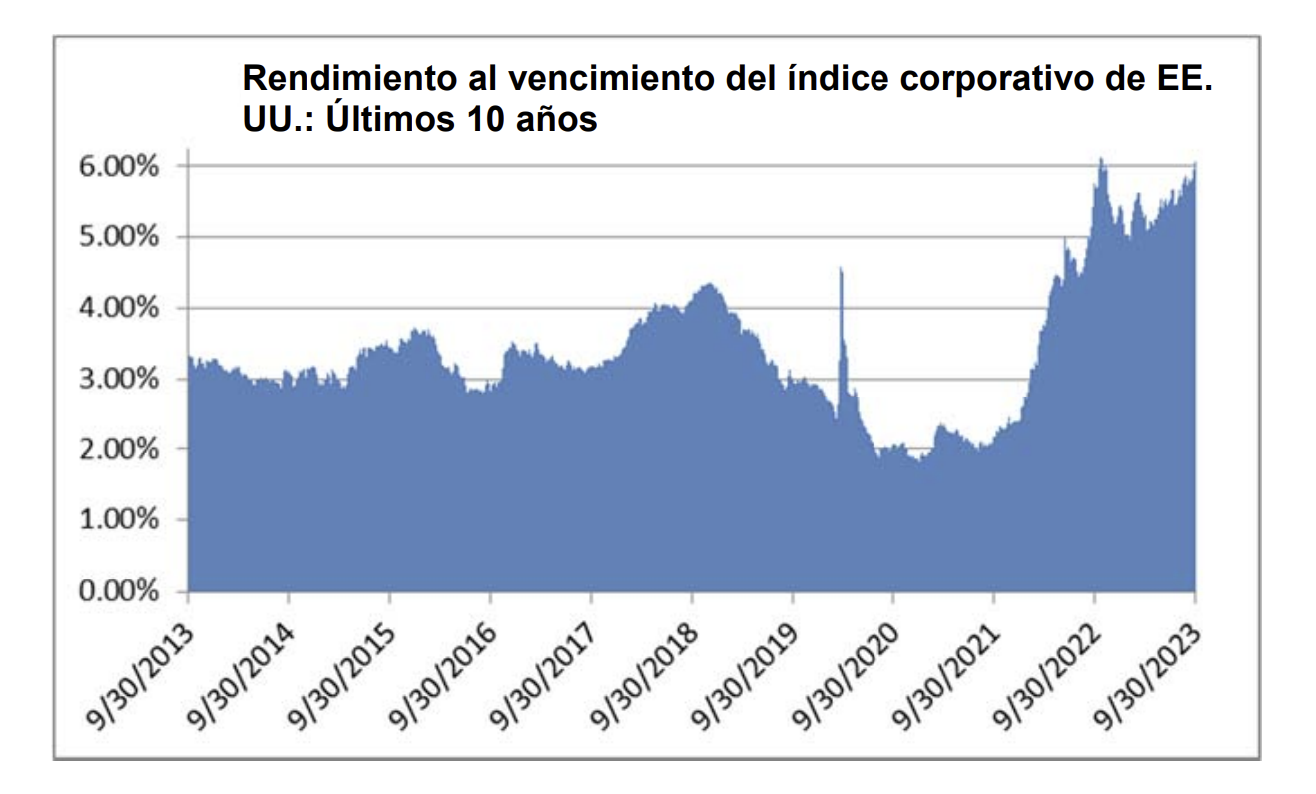
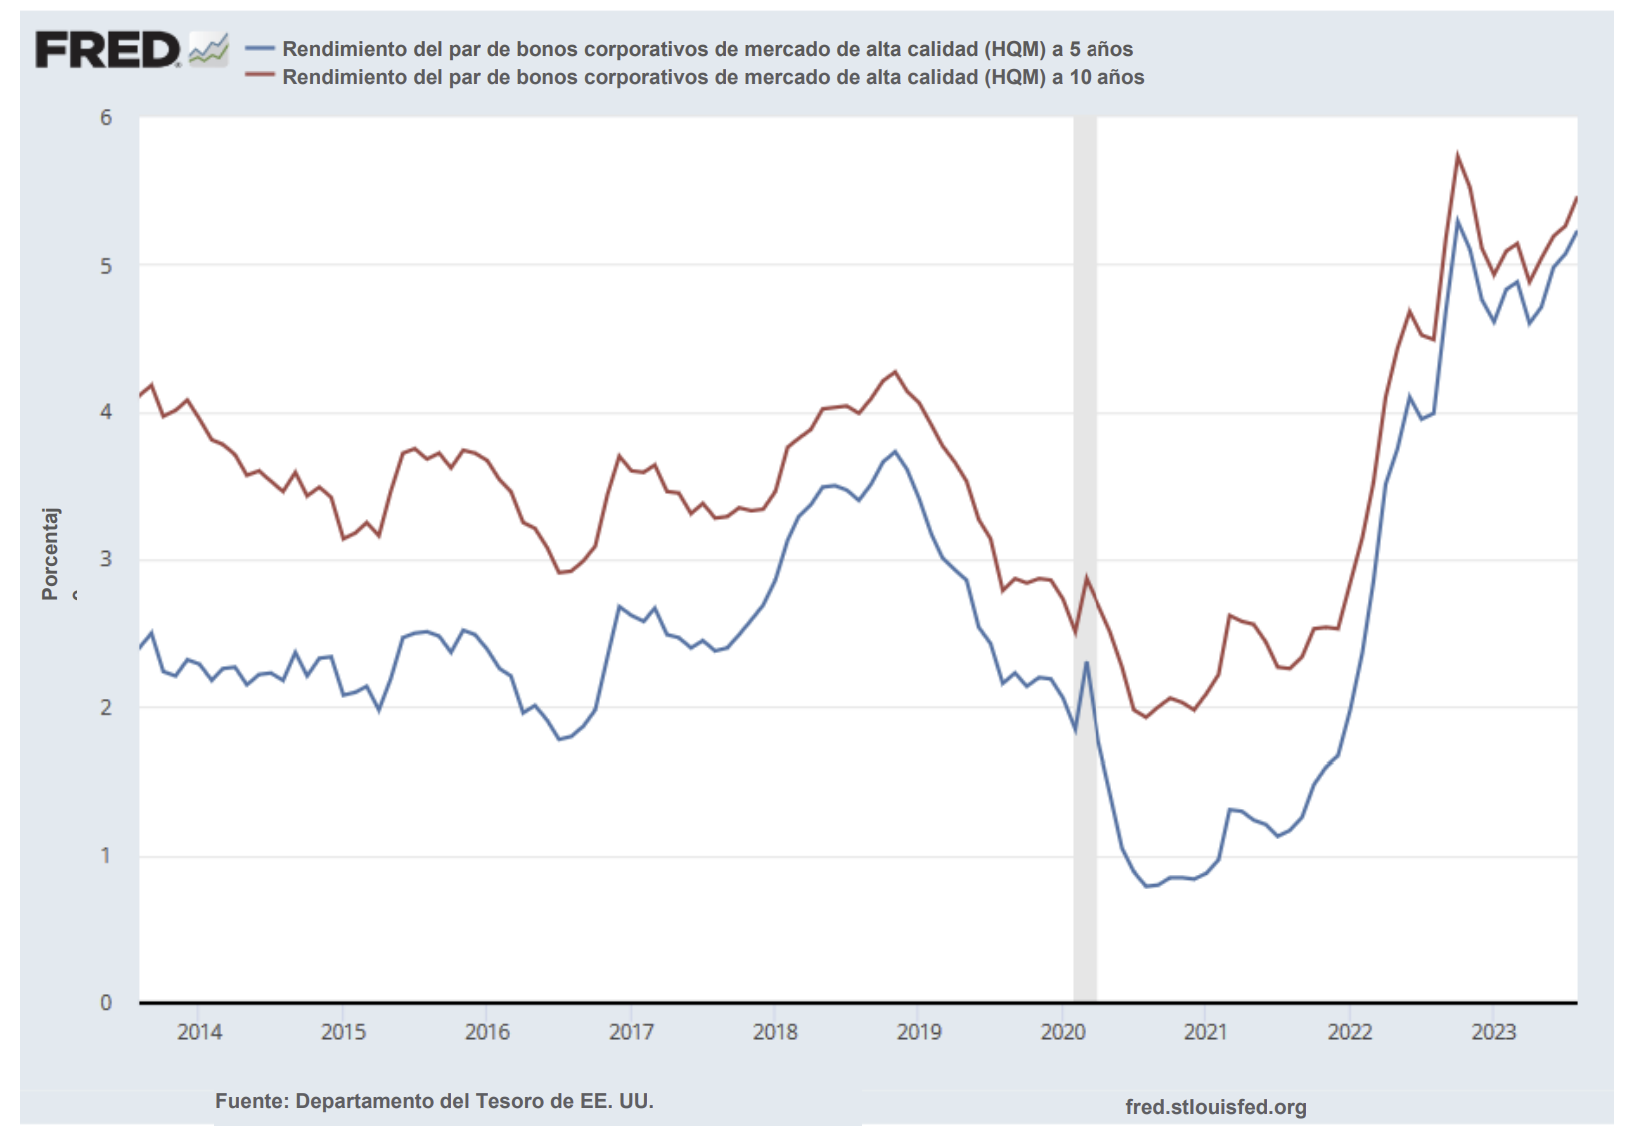
We are enthusiastic about the compensation we are receiving for the credit risk we are taking in the investment grade bond market.  There are ample opportunities to invest in high quality companies at spreads and yields that provide attractive entry points for long term oriented total-return investors.  The yield to maturity on the Corporate Index finished the quarter at 5.48% relative to its 10yr average of 3.34%.  Receiving this type of compensation for IG credit was simply unthinkable until very recently.  This does not mean that yields cannot go higher, or that bonds cannot get cheaper, but the attractiveness of the asset class screens very favorably relative to almost any point in the past decade.

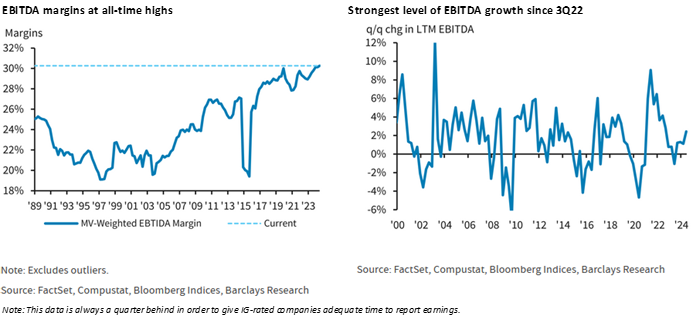
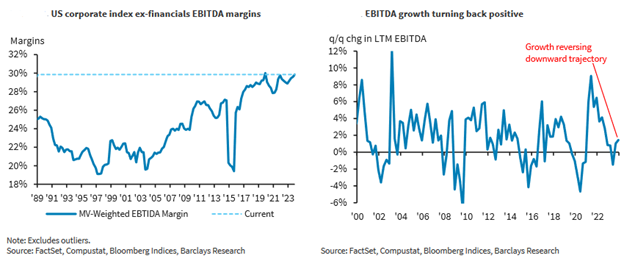
Fundamentally, IG credit is still in solid shape but we are past the peak credit conditions that we experienced at the end of 2021.  Just like consumers, companies are not immune to inflation or slowing economic growth.  Most companies have experienced rising input costs and, in many industries, wages have been growing faster than revenue since the beginning of 2022.i  Looking broadly at the entire investment grade universe, leverage has increased modestly while interest coverage ratios have declined.ii  However, there are still many individual companies that exhibit stable or improving credit metrics which is one of the things we look for as a bond manager.  For companies that are faced with declining margins or rising costs, most have numerous levers to pull in order to protect the health of their balance sheets.  For many companies, shoring up their finances is as simple as reducing shareholder returns, engaging in hiring freezes or implementing cost restructuring programs.

Technical factors have also served as a tailwind for the IG credit market in 2023.  According to data compiled by J.P. Morgan, there has been $110bln of inflows into the IG market year-to-date.  J.P. Morgan research goes on to show that this represents 67% of the $164bln of outflows that IG experienced in 2022.iii

Bottom line, yields are high, fundamentals remain strong and there is a tailwind of technical support in the market.  Taking it all together, we believe that the current environment continues to offer an opportunistic entry point for investment grade credit.

Turmoil in the Banking Industry

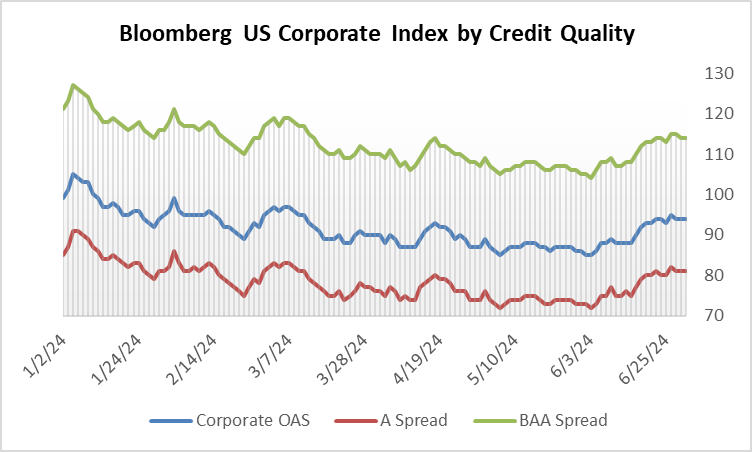
The turbulence that rocked the banking sector in early March feels like ancient history at this point, but investors are still feeling some pain.  Money Center bank spreads have tightened since early March while Super Regionals and Regionals are wider, in some cases meaningfully underperforming their larger peers.

The most striking observation about this chart is that, pre-crisis, the spreads of Money Center vs Regional banks were almost indistinguishable.  For example, in March 2023, J.P. Morgan had $3.3 trillion in assets while Huntington bank had $188 billion, yet investors received just 5 basis points of extra compensation for owning BAA-rated Huntington relative to A-rated J.P. Morganiv.  We do not believe that J.P. Morgan should trade anywhere close to regional banks –it should trade much tighter.  At the end of the second quarter there was a 108 basis point gulf between JPM and HBAN, which makes much more sense to us.

As we highlighted in our last commentary, CAM has always maintained a disciplined approach when it comes to banking exposure.  The above chart is not meant to be a recommendation to buy or sell any security but each of the 11 banks that we hold in our portfolio is featured.  We have traditionally eschewed regional banks as our analysis favors larger banks with broadly diversified revenue streams and geographically diverse lending footprints.  Based on our internal analysis, we remain very comfortable with the financial wherewithal of the banks that populate our investor portfolios.

Cash is King

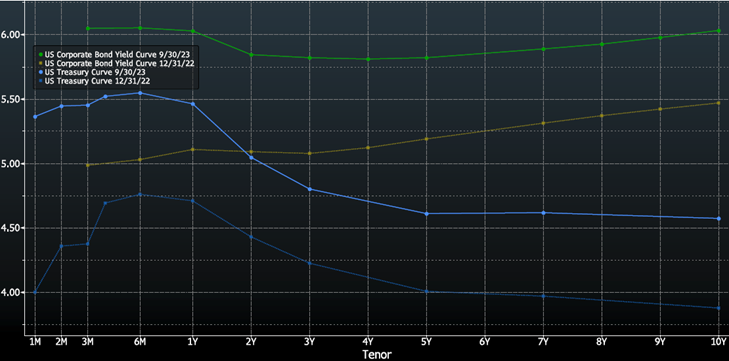
Fed policy has created an opportunity for investors to earn a return on cash and short term investments for the first time in many years.  We believe that investors should be taking full advantage of this phenomenon because it could be a fleeting opportunity.  Locking in a short term yield of more than 4% while taking minimal credit risk is a no-brainer but we would also emphasize that investors still need to be wary of reinvestment risk when evaluating longer term goals.  Consider the following example.

An investor owns a one year CD that pays 5%.  If interest rates fall 150 basis points over the course of the next year as that CD matures it can only be reinvested at 3.5% into a new one year CD at maturity.  The investor will have earned a total return of 5% over their one year holding period.

Now consider an investment grade rated bond portfolio yielding 5.5%. The Bloomberg US Corporate Bond Index had a duration of 7.1 and a yield of 5.5% at the end of the second quarter of 2023 and would have earned a one-year total return of approximately +16.2% in our scenario where interest rates experience a 150 basis point linear decline (5.5% yield + 7.1 duration multiplied by 1.5% decline in interest rates).  To be clear, the investor takes two additional risks by owning bonds in lieu of a CD: interest rate risk and credit risk but they also take less reinvestment risk.  As usual, there is no free lunch on Wall Street.  The purpose of this example is to show that investors with longer term goals may not be better off replacing their bond portfolios with juicy short term yields because it could impair their ability to earn attractive total returns over a longer time horizon.  That being said, investors should absolutely be taking advantage of elevated short term rates for the cash allocation in their overall investment portfolio.

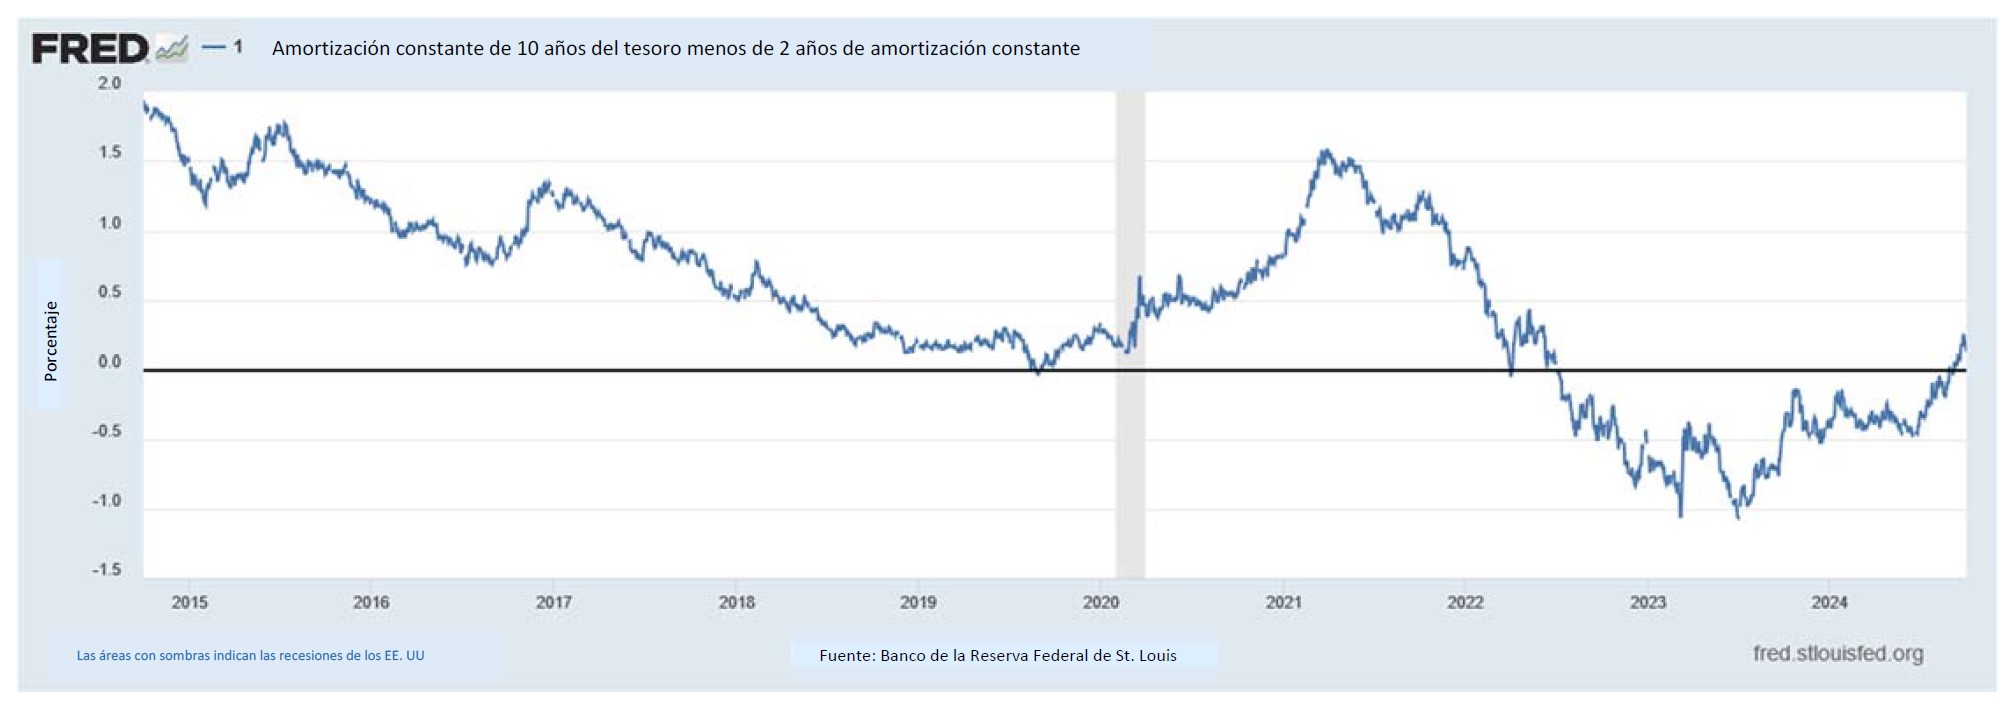
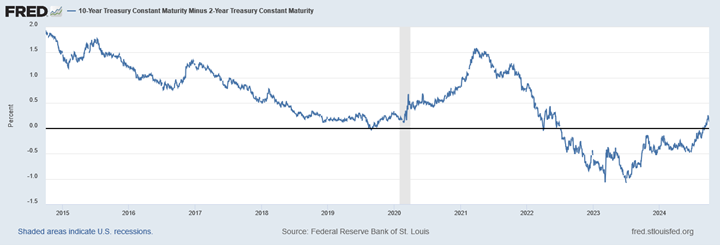
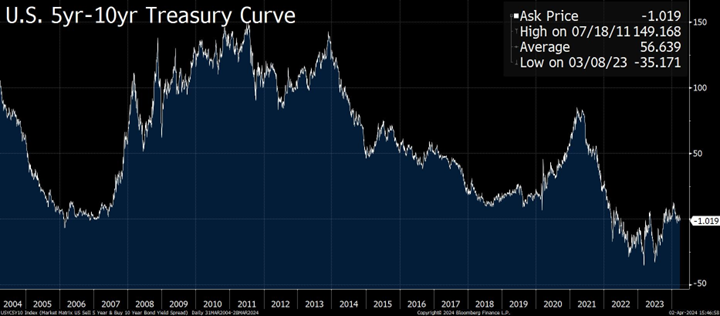
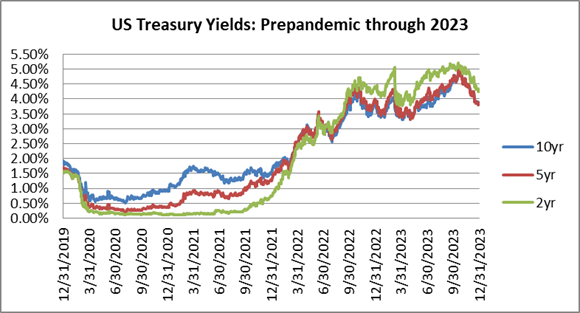
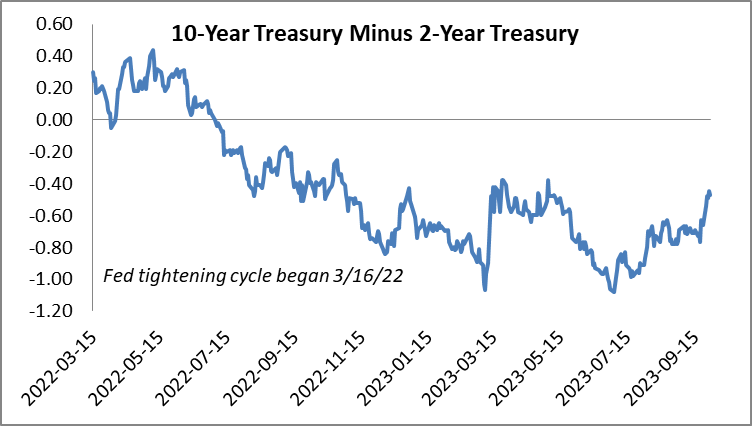
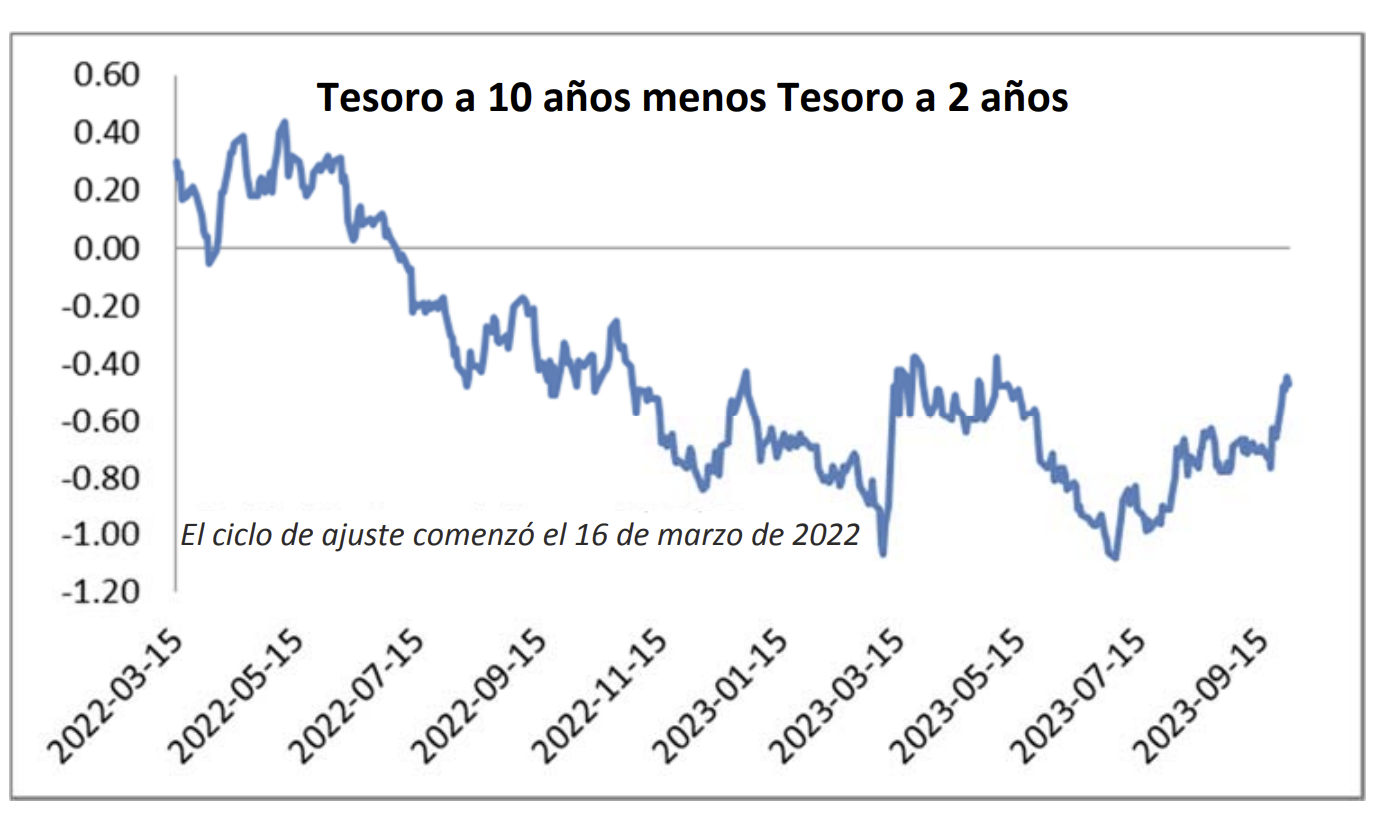
The CAM investment grade strategy is intermediate duration in nature; thus we take a particular interest in the current inversion of the yield curve.  The 2/10 Treasury curve finished the second quarter near its most deeply inverted point of this hiking cycle.  The 2/10 curve briefly inverted for the first time on April 1st 2022 but quickly returned to a positive slope before inverting again on July 5th 2022 and has remained so.  We have written before about the longest 2/10 inversion on record which lasted 21 months from August 1978 until April 1980.  This was a unique time where the economy suffered a brief recession in the first half of 1980 followed by a more painful recession that began in July of 1981 and lasted more than a year.  It is remarkable just how quickly the 2/10s curve went from a deeply inverted level of -241 basis points in March of 1980 to more than +100 basis points of positive slope by early June of that year.  This was a 350 basis point move in less than three months!  The catalysts for this change in the yield curve were significant Fed rate cuts in May and June of that year.  We do not want to draw too many parallels with our current situation but there are other periods of inversion throughout history that have shown similar turnarounds.  In the current cycle, the 2/10 curve has been inverted for either 15 months or 12 months at this point, as there is some debate as to whether the April 2022 or July 2022 should mark the beginning of the current inversion.  History shows that curves will revert to a positive slope over longer time horizons and we are confident that we are closer to the end of this inversion than we are to the beginning.  An upward sloping curve will allow us to be more effective in capturing total return opportunities for our investors, particularly for those more seasoned, fully-invested accounts that have been with us for some time.  The bar for economic sale and extension trades is much higher with an inverted curve whereas those opportunities are plentiful when the curve has a positive slope.  We ask current investors in seasoned accounts to be patient: if you aren’t seeing much sale activity in your account it is because we don’t believe it makes sense to print extension trades with inadequate compensation for our sale candidates.  We would expect that this could change quickly as the inversion reverses and those accounts could then see a flurry of sale and extend activity.  For new portfolios, the inversion is actually quite positive as it has created some dislocation in the secondary market and allowed us to consistently find attractive intermediate duration opportunities that are more difficult to come by when the curve has a positive slope.

FOMC Making Progress

The Federal Reserve held rates steady at its June meeting for the first time in the current 15-month long tightening cycle.  This pause came after 10 consecutive hikes (the Fed does not meet every month during the calendar year) that ranged from 0.25% to 0.75%.  Restrictive monetary policy has begun to impact the economy as inflation has been easing and the labor market, while resilient, is less tight today than it has been for most of the past few years.  Core PCE, the Fed’s preferred measure of inflation, fell to 4.6% through the end of May, a welcome relief after spending much of 2022 above 5%.

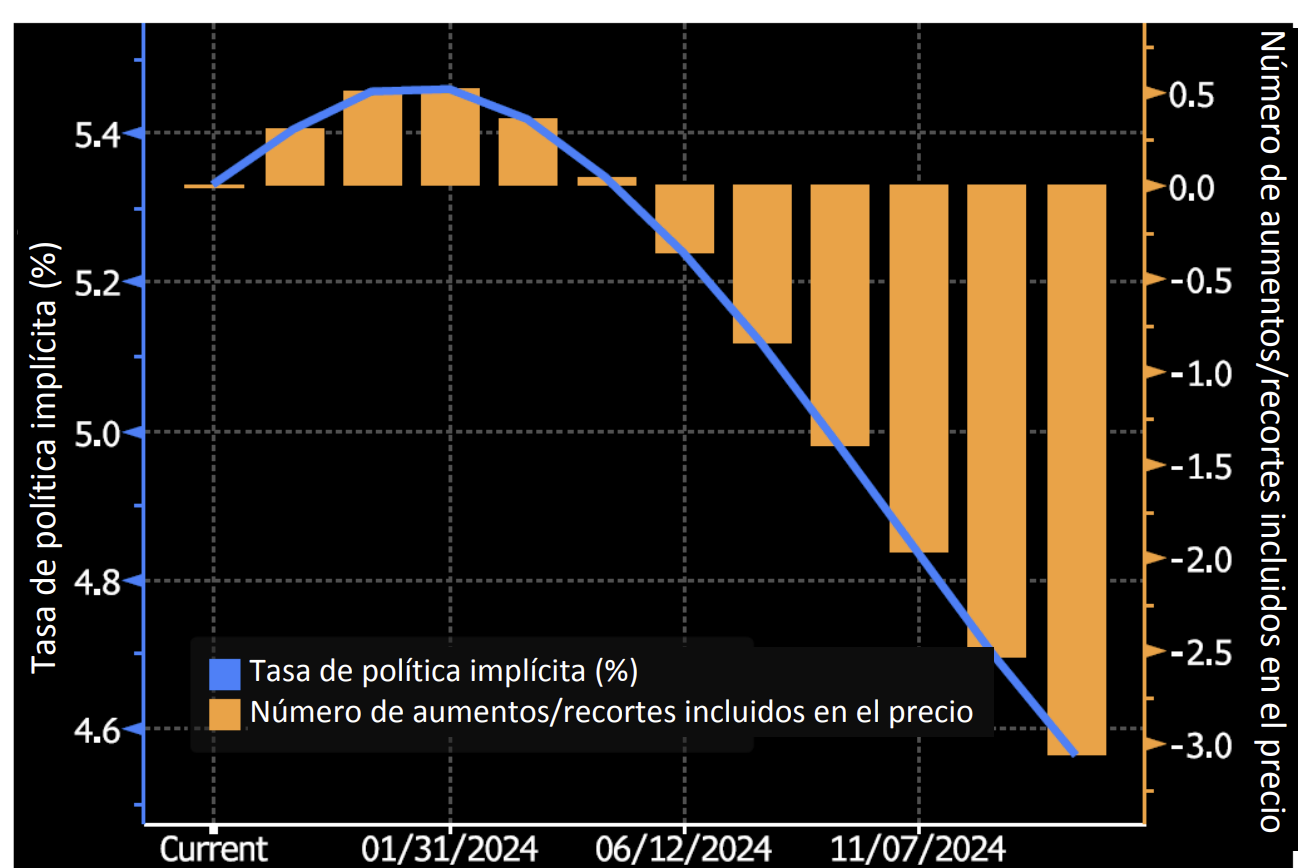
While there has been progress, inflation remains sticky and it is still uncomfortably high for most consumers and policymakers.  In his recent speeches and interviews, Chairman Powell has signaled that officials will probably need to raise the policy rate at least twice more in 2023, although forecasts have not always been a good indicator of what actually transpires.v  Recall the “transitory inflation” argument employed by the Fed throughout 2021 to describe elevated prices that were expected to be temporary.  The argument made sense at the time as supply chains were in disarray and consumers were in the midst of revenge spending.  We too initially believed it was a credible thesis, but by the time it was clear that elevated prices had staying power, it was too late.  The Fed, by its own admission, simply wasn’t nimble and did not respond quickly enough with rate hikes.  It is easy to see this now with the benefit of hindsight but the Fed could have made much more headway in its fight against inflation if it would have started increasing its policy rate in the latter half of 2021 or even a month or two earlier in 2022.  We also remind investors that in June 2022 the Fed’s dot plot implied a June 2023 target rate of 3.75% versus an actual rate of 5.25% at the end of June 2023.  We are not citing these examples to show that the Fed is ineffective or lacks credibility, but instead merely pointing out that Fed forecasts are not prophecy.  The Fed is faced with a difficult task, making policy decisions based on backward looking economic data.  The economic environment can change quickly and the Fed is doing its best to respond in real time.  We believe that the health of the labor market will be the primary decision input used by the Fed for any further rate hikes and it will also be the guidepost for eventual cuts. If the labor market remains stubbornly tight then Chairman Powell’s prediction of two (or more) additional rate hikes is very likely to come to fruition.  Policymakers are keen to avoid the missteps that led to two recessions in the early 1980s and it is becoming increasingly clear to us that the current Fed is willing to take things just a little too far to ensure that it accomplishes its goal.  If the Fed can manufacture a scenario where inflation reaches its target rate and the U.S. economy avoids a recession then it will have worked a near-miracle.  We believe that there are other factors on the horizon that could serve to further ease inflation but they could also hasten the prospect of a recession if the Fed keeps rates “higher for longer.”


Much has been written about aggregate excess savings that consumers accumulated in 2020 and 2021.  Research from the Federal Reserve Bank of San Francisco (FRBSF) covered this topic in a May 2023 Economic letter.  Excess savings reached a peak of $2.1 trillion through August 2021 and have since experienced cumulative drawdowns of $1.6 trillion through March 2023 with approximately $500 billion in excess savings remaining at that timevi.  FRBSF estimated that the remaining excess savings would likely continue to support household spending into the fourth quarter of 2023 or possibly into 2024 and beyond.  The length of support is dependent on drawdown rates and household preferences for savings increases.  The big question is what happens to the economy when this excess savings is eliminated?  In our view, consumer spending will likely slow as these savings continue to dwindle.  Another item that we are monitoring is the resumption of student loan payments.  There are still many moving pieces and the Supreme Court only just recently overruled the Biden administration’s student-loan relief plan.  What we know today is that student loan payments are set to resume on August 30th and economists estimate borrowers will be collectively paying $5-$10 billion per month to service student loan debtvii.  According to the Wall Street Journal, for context, consumers spend $35 billion per month on clothing and department stores per Census Bureau data.  Resuming student loan payments will not cripple the economy by itself but it creates a meaningful spending headwind for tens of millions of borrowers.  Taken together, these are some of the reasons that we believe that the probability of a US recession remains elevated.

Best is yet to Come

It wasn’t the greatest single quarter for performance but year-to-date returns have been solid thus far in 2023 and IG credit is in a much better place than it was a year ago.   We feel strongly about the opportunity in IG-credit at current valuations.  If the economy goes into a recession, then spreads will almost certainly go wider, but when the starting point is a yield of ~5.5%, the risk of wider spreads is mitigated just by virtue of a higher level of compensation. Investors that are zero weight or underinvested in this asset class may want to take a hard look at increasing allocations as we think this has the potential to be a once in 10-years type of opportunity.  Thank you for your continued interest – please do not hesitate to contact us if you have questions or if you would like to discuss the current state of the credit markets.

This information is intended solely to report on investment strategies identified by Cincinnati Asset Management. Opinions and estimates offered constitute our judgment and are subject to change without notice, as are statements of financial market trends, which are based on current market conditions. This material is not intended as an offer or solicitation to buy, hold or sell any financial instrument.  Fixed income securities may be sensitive to prevailing interest rates.  When rates rise the value generally declines.  Past performance is not a guarantee of future results.  Gross of advisory fee performance does not reflect the deduction of investment advisory fees.  Our advisory fees are disclosed in Form ADV Part 2A.  Accounts managed through brokerage firm programs usually will include additional fees.  Returns are calculated monthly in U.S. dollars and include reinvestment of dividends and interest. The index is unmanaged and does not take into account fees, expenses, and transaction costs.  It is shown for comparative purposes and is based on information generally available to the public from sources believed to be reliable.  No representation is made to its accuracy or completeness. 


The information provided in this report should not be considered a recommendation to purchase or sell any particular security.  There is no assurance that any securities discussed herein will remain in an account’s portfolio at the time you receive this report or that securities sold have not been repurchased.  The securities discussed do not represent an account’s entire portfolio and in the aggregate may represent only a small percentage of an account’s portfolio holdings.  It should not be assumed that any of the securities transactions or holdings discussed were or will prove to be profitable, or that the investment decisions we make in the future will be profitable or will equal the investment performance of the securities discussed herein.


Additional disclosures on the material risks and potential benefits of investing in corporate bonds are available on our website:
https://www.cambonds.com/disclosure-statements/.

i Source 1.) S&P 500 23Q1 Earnings Growth Rate of -0.7% y/y, -0.4% q/q per Refinitiv Lipper Data.  Source 2.) Federal Reserve Bank of Atlanta Wage Growth Tracker: Monthly three-month moving average of median hourly wage growth data has been greater or equal to 6% since April 2022.

ii J.P. Morgan, June 23 2023, “Credit Market Outlook & Strategy, 2023 Mid-year Outlook: Running to stand still”

iii J.P. Morgan, June 23 2023, “Credit Market Outlook & Strategy, 2023 Mid-year Outlook: Running to stand still”

iv Federal Reserve Statistical Release, March 31 2023, “Insured U.S.-Chartered Commercial Banks That Have Consolidated Assets of $300 Million or More, Ranked by Consolidated Assets”, https://www.federalreserve.gov/releases/lbr/current/

v Bloomberg News, June 29 2023, “Fed’s Bostic Says Powell Sees More Urgency to Hike Than He Does”
vi Research from the Federal Reserve Bank of San Francisco, May 8 2023, “FRBSF Economic Letter: The Rise and Fall of Pandemic Excess Savings”

vii The Wall Street Journal, June 16 2023, “Student-Loan Repayments Are Coming Back.  Retailers Are in for a Big Shock.”

13 Jul 2023

COMENTARIO DEL SEGUNDO TRIMESTRE

Los rendimientos del crédito con grado de inversión fueron más débiles en el segundo trimestre, aunque el rendimiento del año hasta la fecha para la clase de activos se mantuvo en territorio positivo. Durante el trimestre, el diferencial ajustado por opciones (Option Adjusted Spread, OAS) en el índice de bonos corporativos de EE. UU. de Bloomberg se redujo en 15 puntos básicos y llegó a 123 después de haber abierto el año con un OAS de 138. Las tasas de interés más altas fueron un obstáculo para los rendimientos, ya que el rendimiento del Tesoro a 10 años aumentó 37 puntos básicos en el período, y pasó del 3.47 % al 3.84 %.

El índice corporativo registró un rendimiento total de todo el trimestre de -0.29 %. La rentabilidad total neta de comisiones del programa de grado de inversión de Cincinnati Asset Management, Inc. (CAM) fue del -0.33 %.

Actualización de mercado

Estamos entusiasmados con la compensación que estamos recibiendo por el riesgo crediticio que hemos tomado en el mercado de bonos de grado de inversión. Hay amplias oportunidades para invertir en empresas de alta calidad con diferenciales y rendimientos que proporcionan puntos de entrada atractivos para los inversores de rendimiento total orientados a largo plazo. El rendimiento al vencimiento del índice corporativo terminó el trimestre en 5.48 % en relación con su promedio de 10 años de 3.34 %. Recibir este tipo de compensación por crédito de grado de inversión (Investment Grade, IG) era simplemente impensable hasta hace muy poco. Esto no significa que los rendimientos no puedan subir más, o que los bonos no puedan abaratarse, pero el atractivo de la clase de activos se muestra de manera muy favorable en relación con casi cualquier punto de la última década.

En esencia, el crédito IG todavía está en forma sólida, pero hemos superado las condiciones crediticias máximas que experimentamos a finales de 2021. Al igual que los consumidores, las empresas no son inmunes a la inflación ni a la desaceleración del crecimiento económico. La mayoría de las empresas han tenido un aumento en los costos de los insumos y, en muchas industrias, los salarios han crecido más rápido que los ingresos desde principios de 2022.i Mirando en términos generales todo el universo de grado de inversión, el apalancamiento ha aumentado de manera modesta, mientras que los índices de cobertura de intereses han disminuido.ii Sin embargo, todavía hay muchas empresas individuales que exhiben métricas crediticias estables o en mejora, que es una de las cosas que buscamos como gestores de bonos. Para las empresas que se enfrentan a márgenes decrecientes o costos crecientes, la mayoría tiene numerosas palancas para proteger la salud de sus balances. Para muchas empresas, reforzar sus finanzas es tan simple como reducir los rendimientos de los accionistas, congelar las contrataciones o implementar programas de reestructuración de costos.

Los factores técnicos también han servido como viento a favor para el mercado de crédito IG en 2023. Según los datos recopilados por JP Morgan, ha habido $110 mil millones de entradas en el mercado de IG en lo que va del año. La investigación de JP Morgan continúa mostrando que esto representa el 67 % de los $ 164 mil millones de salidas que IG experimentó en 2022.iii

En pocas palabras, los rendimientos son altos, los fundamentos siguen siendo sólidos y hay un viento a favor para el soporte técnico en el mercado. En conjunto, creemos que el entorno actual continúa ofreciendo un punto de entrada oportunista para el crédito de grado de inversión.

Agitación en la industria bancaria

La turbulencia que sacudió el sector bancario a principios de marzo parece historia antigua en este momento, pero los inversores todavía sienten algo de dolor. Los diferenciales bancarios de Money Center se han ajustado desde principios de marzo, mientras que los superregionales y los regionales son más amplios, en algunos casos con un desempeño significativamente inferior al de sus pares más grandes.

La observación más llamativa de este gráfico es que, antes de la crisis, los diferenciales de los bancos Money Center y Regional eran casi indistinguibles. Por ejemplo, en marzo de 2023, JP Morgan tenía $3.3 billones en activos, mientras que el banco Huntington tenía $188 mil millones, pero los inversores recibieron solo 5 puntos básicos de compensación
adicional por poseer Huntington con calificación BAA en relación con JP Morgan con calificación A. iv. No creemos que JP Morgan deba negociar en ningún lugar cerca de los bancos regionales; debería negociar de manera mucho más estricta. Al final del segundo trimestre había una brecha de 108 puntos básicos entre JPM (JP Morgan) y HBAN (Huntington Bancshares), lo que tiene mucho más sentido para nosotros.

Como destacamos en nuestro último comentario, CAM siempre ha mantenido un enfoque disciplinado en lo que respecta a la exposición bancaria. El gráfico anterior no pretende ser una recomendación para comprar o vender ningún valor, pero se presenta cada uno de los 11 bancos que tenemos en nuestra cartera. Tradicionalmente hemos evitado los bancos regionales, ya que nuestro análisis favorece a los bancos más grandes con flujos de ingresos ampliamente diversificados y huellas crediticias geográficamente diversas. Según nuestro análisis interno, nos sentimos muy cómodos con los medios financieros de los bancos que llenan nuestras carteras de inversores.

El efectivo es el rey

La política de la Reserva Federal ha creado una oportunidad para que los inversionistas obtengan un rendimiento en efectivo e inversiones a corto plazo por primera vez en muchos años. Creemos que los inversores deberían aprovechar al máximo este fenómeno porque podría ser una oportunidad fugaz. Asegurar un rendimiento a corto plazo de más del 4 % mientras se asume un riesgo crediticio mínimo es una obviedad, pero también enfatizamos que los inversores aún deben tener cuidado con el riesgo de reinversión al evaluar objetivos a más largo plazo. Considere el siguiente ejemplo.

Un inversionista posee un certificado de depósito (CD) de un año que paga el 5 %. Si las tasas de interés caen 150 puntos básicos en el transcurso del próximo año a medida que vence el CD, solo se puede reinvertir al 3.5 % en un nuevo CD de un año al vencimiento. El inversor habrá obtenido un rendimiento total del 5 % durante su período de tenencia de un año.

Ahora considere una cartera de bonos con calificación de grado de inversión con un rendimiento del 5.5 %. El índice de bonos corporativos de EE. UU. de Bloomberg tenía una duración de 7.1 y un rendimiento del 5.5 % al final del segundo trimestre de 2023 y habría obtenido un rendimiento total a un año de aproximadamente +16.2 % en nuestro escenario, donde las tasas de interés experimentan una disminución lineal de 150 puntos básicos (5.5 % de rendimiento + 7.1 de duración multiplicado por 1.5 % de disminución de las tasas de interés). Para ser claros, el inversionista asume dos riesgos adicionales al poseer bonos en lugar de un CD: riesgo de tasa de interés y riesgo crediticio, pero también asume menos riesgo de reinversión. Como de costumbre, no hay almuerzo gratis en Wall Street. El propósito de este ejemplo es mostrar que los inversionistas con objetivos a más largo plazo pueden no estar mejor reemplazando sus carteras de bonos con jugosos rendimientos a corto plazo porque podría afectar su capacidad de obtener rendimientos totales atractivos en un horizonte de tiempo más largo. Dicho esto, los inversores deberían aprovechar absolutamente las tasas elevadas a corto plazo para la asignación de efectivo en su cartera de inversión general.

La estrategia de grado de inversión CAM es de naturaleza de duración intermedia; por lo tanto, tomamos un interés particular en la inversión actual de la curva de rendimiento. La curva del Tesoro de 2/10 años terminó el segundo trimestre cerca de su punto más profundamente invertido de este ciclo de alzas. La curva 2/10 años se invirtió brevemente por primera vez el 1.º de abril de 2022, pero volvió rápidamente a una pendiente positiva antes de invertirse de nuevo el 5 de julio de 2022 y se ha mantenido así. Hemos escrito antes sobre la inversión 2/10 años más larga registrada que duró 21 meses desde agosto de 1978 hasta abril de 1980. Este fue un momento único en el que la economía sufrió una breve recesión en la primera mitad de 1980 seguida de una recesión más dolorosa que comenzó en julio de 1981 y duró más de un año. Es notable lo rápido que la curva de 2/10 años pasó de un nivel profundamente invertido de -241 puntos básicos en marzo de 1980 a más de +100 puntos básicos de pendiente positiva a principios de junio de ese año. ¡Este fue un movimiento de 350 puntos básicos en menos de tres meses! Los catalizadores de este cambio en la curva de rendimiento fueron los importantes recortes de tasas de la Reserva Federal en mayo y junio de ese año. No queremos trazar demasiados paralelismos con nuestra situación actual, pero hay otros períodos de inversión a lo largo de la historia que han mostrado giros similares. En el ciclo actual, la curva de 2/10 años se ha invertido durante 15 meses o 12 meses en este punto, ya que existe cierto debate sobre si abril de 2022 o julio de 2022 deberían marcar el comienzo de la inversión actual. La historia muestra que las curvas volverán a una pendiente positiva en horizontes de tiempo más largos y estamos seguros de que estamos más cerca del final de esta inversión que del comienzo. Una curva con pendiente ascendente nos permitirá ser más efectivos en la captura de oportunidades de rendimiento total para nuestros inversores, particularmente para aquellas cuentas más experimentadas y totalmente invertidas que han estado con nosotros durante algún tiempo. La barra para la venta económica y los intercambios de extensión es mucho más alta con una curva invertida, mientras que esas oportunidades son abundantes cuando la curva tiene una pendiente positiva. Pedimos paciencia a los inversores actuales en cuentas experimentadas: si no ve mucha actividad de venta en su cuenta es porque no creemos que tenga sentido imprimir operaciones de extensión con una compensación inadecuada para nuestros candidatos de venta. Esperaríamos que esto pudiera cambiar rápidamente a medida que la inversión se revierte y esas cuentas podrían ver una ráfaga de ventas y extender la actividad. Para las carteras nuevas, la inversión es en realidad bastante positiva, ya que ha creado cierta dislocación en el mercado secundario y nos ha permitido encontrar constantemente oportunidades atractivas de duración intermedia que son más difíciles de conseguir cuando la curva tiene una pendiente positiva.

El Comité Federal del Mercado Abierto (Federal Open Market Committee, FOMC) avanza

La Reserva Federal mantuvo las tasas estables en su reunión de junio por primera vez en el actual ciclo de endurecimiento de 15 meses. Esta pausa se produjo tras 10 subidas consecutivas (la Reserva Federal no se reúne todos los meses del año natural) que oscilaron entre el 0.25 % y el 0.75 %. La política monetaria restrictiva ha comenzado a afectar la economía a medida que la inflación se ha ido moderando y el mercado laboral, aunque resistente, está menos ajustado hoy de lo que ha estado durante la mayor parte de los últimos años. El gasto personal (Personal Consumption Expenditure, PCE) básico, la medida de inflación preferida por la Reserva Federal, cayó al 4.6 % hasta finales de mayo, un alivio bienvenido después de pasar gran parte de 2022 por encima del 5 %.

Si bien ha habido progreso, la inflación sigue estancada y sigue siendo incómodamente alta para la mayoría de los consumidores y los encargados de formular políticas. En sus discursos y entrevistas recientes, el presidente Powell ha señalado que los funcionarios probablemente necesitarán aumentar la tasa de política monetaria al menos dos veces más en 2023, aunque los pronósticos no siempre han sido un buen indicador de lo que realmente sucede.v Recordemos el argumento de “inflación transitoria” empleado por la Reserva Federal a lo largo de 2021 para describir precios elevados que se esperaba que fueran temporales. El argumento tenía sentido en ese momento, ya que las cadenas de suministro estaban desordenadas y los consumidores estaban en medio de un gasto de venganza. Nosotros también creímos inicialmente que era una tesis creíble, pero cuando quedó claro que los precios elevados tenían poder de permanencia, ya era demasiado tarde. La Reserva Federal, por su propia admisión, simplemente no fue ágil y no respondió con la suficiente rapidez con aumentos de tasas. Es fácil ver esto ahora con el beneficio de la retrospectiva, pero la Reserva Federal podría haber avanzado mucho más en su lucha contra la inflación si hubiera comenzado a aumentar su tasa de política en la segunda mitad de 2021 o incluso uno o dos meses antes en 2022. También recordamos a los inversores que en junio de 2022 el gráfico de puntos de la Reserva Federal implicaba una tasa objetivo de junio de 2023 del 3.75 % frente a una tasa real del 5.25 % a fines de junio de 2023. No estamos citando estos ejemplos para mostrar que la Reserva Federal es ineficaz o carece de credibilidad, sino que simplemente señalamos que sus previsiones no son profecías. La Reserva Federal se enfrenta a una tarea difícil y toma decisiones políticas basadas en datos económicos retrospectivos. El entorno económico puede cambiar rápidamente y la Reserva Federal está haciendo todo lo posible para responder en tiempo real. Creemos que la salud del mercado laboral será el factor de decisión principal utilizado por la Reserva Federal para cualquier otra subida de tipos y también será la guía para eventuales recortes. Si el mercado laboral sigue obstinadamente ajustado, es muy probable que la predicción del presidente Powell de dos (o más) aumentos de tasas adicionales se haga realidad. Los formuladores de políticas están ansiosos por evitar los pasos en falso que condujeron a dos recesiones a principios de la década de 1980 y cada vez es más claro para nosotros que la Reserva Federal actual está dispuesta a llevar las cosas un poco demasiado lejos para garantizar que logre su objetivo. Si la Reserva Federal puede desarrollar un escenario en el que la inflación alcance su tasa objetivo y la economía de los EE. UU. evite una recesión, habrá funcionado casi como un milagro. Creemos que hay otros factores en el horizonte que podrían servir para aliviar aún más la inflación, pero también podrían acelerar la perspectiva de una recesión si la Reserva Federal mantiene las tasas “más altas por más tiempo”.

Mucho se ha escrito sobre el exceso de ahorro agregado que los consumidores acumularon en 2020 y 2021. La investigación del Banco de la Reserva Federal de San Francisco (Federal Reserve Bank of San Francisco, FRBSF) cubrió este tema en una carta económica de mayo de 2023. El exceso de ahorro alcanzó un máximo de $2.1 billones hasta agosto de 2021 y desde entonces ha experimentado reducciones acumuladas de $1.6 billones hasta marzo de 2023 con aproximadamente $500 mil millones en exceso de ahorro restantes en ese momentovi. El FRBSF estimó que el exceso de ahorro restante probablemente continuaría respaldando el gasto de los hogares hasta el cuarto trimestre de 2023 o posiblemente hasta 2024 y más allá. La duración del apoyo depende de las tasas de retiro y las preferencias de los hogares para aumentar los ahorros. La gran pregunta es ¿qué sucede con la economía cuando se elimina este exceso de ahorro? En nuestra opinión, es probable que el gasto de los consumidores se desacelere a medida que estos ahorros continúen disminuyendo. Otro elemento que estamos monitoreando es la reanudación de los pagos de préstamos estudiantiles. Todavía hay muchas piezas en movimiento y la Corte Suprema anuló recientemente el plan de alivio de préstamos estudiantiles de la administración Biden. Lo que sabemos hoy es que los pagos de préstamos estudiantiles se reanudarán el 30 de agosto y los economistas estiman que los prestatarios pagarán colectivamente entre $5 y $10 mil millones por mes para pagar la deuda de préstamos estudiantiles.vii. Según el Wall Street Journal, por contexto, los consumidores gastan $35 mil millones por mes en ropa y tiendas departamentales según los datos de la Oficina del Censo. La reanudación de los pagos de los préstamos estudiantiles no paralizará la economía por sí sola, pero crea un obstáculo significativo para el gasto de decenas de millones de prestatarios. En conjunto, estas son algunas de las razones por las que creemos que la probabilidad de una recesión en EE. UU. sigue siendo elevada.

Lo mejor está por venir
No fue el mejor trimestre individual para el rendimiento, pero los rendimientos del año hasta la fecha han sido sólidos hasta ahora en 2023 y el crédito de IG está en un lugar mucho mejor que hace un año. Estamos convencidos de la oportunidad que ofrece el crédito IG con las valoraciones actuales. Si la economía entra en recesión, es casi seguro que los diferenciales se ampliarán, pero cuando el punto de partida es un rendimiento de ~5.5 %, el riesgo de diferenciales más amplios se mitiga solo en virtud de un mayor nivel de compensación. Los inversores que no tienen ponderación o que no han invertido lo suficiente en esta clase de activos pueden querer analizar con atención el aumento de las asignaciones, ya que creemos que esto tiene el potencial de ser una oportunidad única cada 10 años. Gracias por su continuo interés. No dude en comunicarse con nosotros si tiene preguntas o si desea hablar sobre el estado actual de los mercados crediticios.

Esta información solo tiene el propósito de dar a conocer las estrategias de inversión identificadas por Cincinnati Asset Management. Las opiniones y estimaciones ofrecidas están basadas en nuestro criterio y están sujetas a cambios sin previo aviso, al igual que las declaraciones sobre las tendencias del mercado financiero, que dependen de las condiciones actuales del mercado. Este material no tiene como objetivo ser una oferta ni una solicitud para comprar, mantener ni vender instrumentos financieros. Los valores de renta fija pueden ser vulnerables a las tasas de interés vigentes. Cuando las tasas aumentan, el valor suele disminuir. El rendimiento pasado no es garantía de resultados futuros. El rendimiento bruto de la tarifa de asesoramiento no refleja la deducción de las tarifas de asesoramiento de inversión. Nuestras tarifas de asesoramiento se comunican en el Formulario ADV Parte 2A. En general, las cuentas administradas mediante programas de firmas de corretaje incluyen tarifas adicionales. Los rendimientos se calculan mensualmente en dólares estadounidenses e incluyen la reinversión de dividendos e intereses. El índice no está administrado y no considera las tarifas de la cuenta, los gastos y los costos de transacción. Se muestra con fines comparativos y se basa en información generalmente disponible al público tomada de fuentes que se consideran confiables. No se hace ninguna afirmación sobre su precisión o integridad.
La información proporcionada en este informe no debe considerarse una recomendación para comprar o vender ningún valor en particular. No hay garantía de que los valores que se tratan en este documento permanecerán en la cartera de una cuenta en el momento en que reciba este informe o que los valores vendidos no hayan sido vueltos a comprar. Los valores de los que se habla no representan la cartera completa de una cuenta y, en conjunto, pueden representar solo un pequeño porcentaje de las tenencias de cartera de una cuenta. No debe suponerse que las transacciones de valores o tenencias analizadas fueron o demostrarán ser rentables, o que las decisiones de inversión que tomemos en el futuro serán rentables o igualarán el rendimiento de la inversión de los valores discutidos en este documento.
En nuestro sitio web se encuentran disponibles las divulgaciones adicionales sobre los riesgos materiales y los beneficios potenciales de invertir en bonos corporativos: https://www.cambonds.com/disclosure-statements/.

i Source 1.) S&P 500 23Q1 Earnings Growth Rate of -0.7% y/y, -0.4% q/q per Refinitiv Lipper Data.  Source 2.) Federal Reserve Bank of Atlanta Wage Growth Tracker: Monthly three-month moving average of median hourly wage growth data has been greater or equal to 6% since April 2022.

ii J.P. Morgan, June 23 2023, “Credit Market Outlook & Strategy, 2023 Mid-year Outlook: Running to stand still”

iii J.P. Morgan, June 23 2023, “Credit Market Outlook & Strategy, 2023 Mid-year Outlook: Running to stand still”

iv Federal Reserve Statistical Release, March 31 2023, “Insured U.S.-Chartered Commercial Banks That Have Consolidated Assets of $300 Million or More, Ranked by Consolidated Assets”, https://www.federalreserve.gov/releases/lbr/current/

v Bloomberg News, June 29 2023, “Fed’s Bostic Says Powell Sees More Urgency to Hike Than He Does”

vi Research from the Federal Reserve Bank of San Francisco, May 8 2023, “FRBSF Economic Letter: The Rise and Fall of Pandemic Excess Savings”

vii The Wall Street Journal, June 16 2023, “Student-Loan Repayments Are Coming Back.  Retailers Are in for a Big Shock.”

11 Apr 2023

2023 Q1 Investment Grade Quarterly

Investment grade credit posted solid positive total returns to start 2023. During the first quarter, the Option Adjusted Spread (OAS) on the Bloomberg US Corporate Bond Index widened by 8 basis points to 138 after having opened the year at 130. With wider spreads, positive performance during the quarter was driven by coupon income and a rally in Treasuries with the 10yr Treasury finishing the quarter at 3.47%, 41 basis points lower year‐to‐date.

During the first quarter the Corporate Index posted a total return of +3.50%. CAM’s Investment Grade Program net of fees total return during the quarter was +3.41%.

Investment Grade is Fashionable Again

In our last commentary we wrote that total returns for investment grade credit may be poised to rebound from the depths. The Corporate Index has now posted two consecutive quarters of positive total returns with 4Q2022 and 1Q2023 coming in at +3.63% and +3.50%, respectively. 2022 was the worst full year total return for IG credit on record (‐15.76%) and November 7th was the bottom from a performance perspective. Since November 7th the Corporate Index has posted a positive total return of +8.89%, illustrating just how quickly market temperament can change; which is one of the reasons we caution against trying to time the market.

Short term Treasuries are currently available at some of the highest yields in years. The 2‐year Treasury closed the first quarter of 2023 at 4.03% and we believe that short duration Treasuries are an attractive cash alternative. While short term rates may be an attractive place to park some cash, we do not believe that they are a suitable replacement for an intermediate corporate bond portfolio for most investors due to the high degree of reinvestment risk incurred. When the Federal Reserve pivots and begins to cut its policy rate short term Treasury yields are likely to follow. At that point, an investor looking to replace their short‐term Treasuries may find that intermediate credit has since rallied significantly on a relative basis making the entry point for IG credit potentially less attractive than it is today. By eschewing intermediate corporates and limiting fixed income allocations to short duration assets an investor risks giving up a meaningful amount of total return potential. For certain asset classes, tactical positioning and attempts at market timing may well be a beneficial endeavor. However, we do not think that Investment Grade credit is one of those asset classes. We instead maintain that it is more effective for investors with medium or longer term time horizons to view IG credit in a strategic manner, and to give the asset class a permanent allocation of capital within a well‐diversified investment portfolio.

Money & Banking

Given the turmoil in the Banking industry we thought it would be instructive to comment on CAM’s exposure and investment philosophy as it pertains to the Financial Institutions sector.

The Finance sector comprises a large portion of the Corporate Index, with a 33.07% weighting within the index at the end of the first quarter 2023. Banking was the largest industry within the Finance sector with a 23.22% index weighting. The remaining industries that make up the balance of the Finance sector are Brokerage & Asset Managers, Finance Companies, Insurance, REITs and Other Finance. CAM has always sought to limit each client portfolio to a 30% (or less) weighting within the Finance sector to ensure that each portfolio is properly diversified from a risk management standpoint. At the end of the first quarter, CAM’s portfolio had just under a 20% exposure to the Banking industry while the rest of our Financial sector exposure was comprised of P&C Insurance (three companies) and REITs (two companies).

As far as exposure to the Banking industry is concerned, CAM is highly selective with investments in just 11 banks at the end of the first quarter 2023. Our disciplined approach to the Banking industry has always been to focus on well managed highly capitalized institutions that have broadly diversified revenue streams and geographically diverse lending footprints. The fundamental nature of CAM’s investment philosophy and bottom up research process excludes specialty banks and regional banks because their loan portfolios have outsize exposure to particular industries or their footprints are too concentrated. We apply the same type of rigorous analysis to our Finance exposure in both the Insurance and REIT industries. As a result, we have a high degree of confidence in our investments within the Financial Institutions sector.

Aversion to Inversion

We continue to receive questions from investors about the inverted yield curve and its impact on the portfolio. There are two major themes to discuss.

  1. For new accounts, the inversion has brought good fortune, creating an attractive entry point; and seasoned accounts enjoy this same benefit as they make additional purchases. The inverted curve has consistently created situations where it is opportunistic to buy shorter intermediate bonds that we believe are likely to perform well as the curve normalizes over time. We have been able to purchase bonds that mature in 7‐8 years at prices that are attractive relative to 9‐10 year bonds. This results in a lower overall duration for the client portfolio and less interest rate risk. These types of opportunities are much more fleeting during environments with normalized upward sloping Treasury curves.
  2. For seasoned accounts or those that are fully invested, they will find that our holding period will be longer than usual. This is because the yield curve inversion has resulted in less attractive economics for extension trades. Rather than selling bonds at the 5‐year mark, as we typically would, we will continue to hold those bonds and collect coupon income while we wait for curve normalization. We will exude patience, constantly monitoring the landscape for extension opportunities to present themselves, meaning we are likely to hold existing bonds until there are 3 or 4 years left to maturity so long as the curve remains inverted.

Treasury curves will normalize –they always have. Historically, curve inversions have been brief in nature with the longest period of inversion on record for 2/10s being 21 months from August 1978 until April 1980.i  The current 2/10 curve inversion began on July 5 2022 and was at its most deeply inverted point of ‐107 bps on March 8, 2023 before sharply reversing course to finish the quarter at ‐55 bps. The most likely catalyst for an upward sloping yield curve is a Fed easing cycle and a decrease in the Federal Funds Rate. The mere anticipation of a pause in the hiking cycle could be enough for the market to begin the process of returning to a more normalized Treasury curve.

Market Conditions & New Issuance

Demand for investment grade credit has been consistently strong to start the year. According to sources compiled by Wells Fargo, IG funds reported $62.1bln of inflows year‐to‐date through March 15.ii We have observed this demand and its associated impact on pricing in the primary market, from large institutional buyers in particular. Our invest‐up period for a new account averages 8 to 10 weeks. For new accounts we historically have been very consistent in that we have been able to find compelling opportunities in the primary market so that a new account could expect to have 30‐35% of its portfolio populated by new issuance. Seasoned accounts too could expect to purchase new issuance from time to time as coupon income is received within those accounts and cash builds to the point that the account is ready to make a purchase.

Let’s walk through the mechanics of what we are currently observing within the primary market:

A company and its investment bankers, in a normalized market with a balanced level of demand, could expect to pay what we call a “new issue concession” to investors in order to incentivize them to purchase a newly issued bond. For example, if a company has a 9‐year bond outstanding that trades at a spread of 100/10yr then it would be entirely reasonable for an investor to expect to be paid 115/10yr to compensate for the additional duration incurred as well as some compensation in the form of extra spread to incent the investor to buy the new bond. New issue concessions change frequently and are based on market dynamics including the state of the economy, geopolitical issues, overall demand for credit, as well as characteristics of the issuing company and prevailing opinion of its’ credit worthiness. Sometimes new issue concessions can be very attractive and other times they can be flat or even negative.

Throughout the first quarter we observed a high frequency of flat/negative new issue concessions which made for situations where the secondary bonds of a given issuer were more attractive than the new bonds. Sometimes this meant that the secondary bonds were an opportunistic investment relative to the new bond but other times it meant that both secondary and the new bonds were fairly or overvalued based on our analysis. The reasoning to purchase a 10yr bond that offers less yield than an 8yr bond may seem counterintuitive, but the rationale lies in how we consider the constraints placed upon investors in the corporate bond market. Bonds are finite, trade over the counter (not on an exchange) and are less liquid than equities. There is a major problem that a willing buyer of a bond may face from time to time –what if there are no willing sellers? Complicating matters for the buyer in our example –what if the buyer has a lot of cash that needs to be invested? This is the phenomenon that we are observing currently; very large buyers that are willing to “pay‐up” in order to get money to work. The large buyer cannot just go out and buy $10-$50mm of the secondary bond because there simply aren’t enough willing sellers. Instead the large buyer must pay a premium in order to put its money to work by paying too much (in our view) to buy a bond in the primary market. This is not a problem for CAM and highlights one of our comparative advantages. As a boutique manager we are still small enough that we can freely operate and buy what we need in an opportunistic manner in order to fill client accounts. If given the choice to buy a shorter bond at a higher yield than a longer bond of the same issuer, then we will buy the short bond all day long as long as the bond math makes economic sense. While the newer bond will likely have a higher coupon because it is being priced off of a higher Treasury rate than the 8yr bond that was priced two years, coupon alone does not tell the entire story. Spread and the amount of yield per turn of duration is the real key to generating total return, not coupon. The following example is a real‐world one that we observed in early February of this year:

The new bond was from an issuer that we hold in high regard and a company that we currently invest in for client accounts (note: we have omitted the name of the company as this is not a recommendation to buy or sell a specific security). The initial price for the new issue was +170bps/10yr, a level that we considered to be attractive given the credit worthiness of the issuer and its relative value within the market at that time, but that price was merely a starting point. For new issues, the initial price will change in response to the strength of demand and it is a very fluid process that occurs over the course of a few hours. In this particular instance, we would have been willing to purchase the new bond at a spread of +160bps or better but given very strong buyer demand, the syndicate was able to move the pricing in to +143bps at which point we declined to participate. Thus in this scenario, given the option between buying the new bond and the secondary bond, we would most certainly choose the secondary bond for a variety of reasons. The secondary bond offered 2bps more yield, required an upfront investment of $14 less because of its discounted price, and it was 29 months shorter in maturity than the new bond, offering meaningfully more yield per turn of duration. As it turns out we elected not to purchase the secondary bond in this example as we considered it to be fully valued at that time and not an opportunistic way to deploy capital for clients. If the bond would have been trading at a spread of +150 we would have purchased it. This is just but one example of our investment discipline in how we approach the decisions we are making for clients on a daily basis. Hopefully this is helpful in explaining some of the dynamics that we have been seeing in the market to start the year and how we think about managing risk and opportunities for client accounts.

What Will The Fed Do?
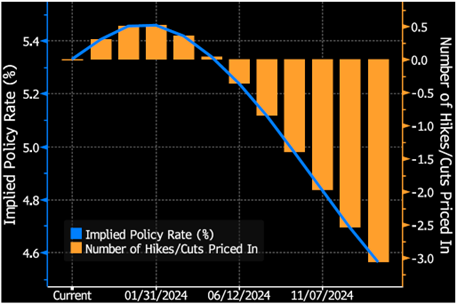
We know that the Fed can’t raise its policy rate forever. We have already seen the consequences of this unprecedented hiking cycle as cracks have emerged in some corners of the banking industry and we believe it is becoming increasingly clear that monetary policy is beginning to slow the economy. At the end of the first quarter of 2023 Fed Funds Futures were pricing a +25bp rate hike at the May meeting and a 43% chance of a +25bp hike at the June meeting. Perhaps more surprising is that futures were also predicting three policy rate cuts in the last three months of the year. We have since received a weak job openings report on the morning  of April 4 that showed that labor demand and job openings have cooled with US job openings dipping below 10 million for the first time since May of 2021.iii The next big data point will be the March Employment Report which will be released on April 7th. We think that the Fed will continue to use data as its guide, particularly as it relates to employment. If the labor market cools significantly then the current hiking cycle could have already reached its peak. If the labor market is resilient then we foresee another 1‐2 hikes and possibly more if needed. At present, we have a difficult time envisioning cuts in 2023 and we think a multi‐month pause is the more likely path.

We continue to believe that the Fed has little choice –it has to tighten conditions by too much or for too long which in all likelihood will lead to recession. Predicting the timing or depth of any recession is difficult so we find it more productive to focus on the risks that we can measure and best control within our portfolio and credit risk is the one variable where we can exert the most influence. We believe we are well equipped to manage and evaluate credit risk for client portfolios through the work of our deeply experienced team. A recession is not generally good for risk assets but it is not a death knell for investment grade credit. These companies are investment grade for a reason and if we have done our job and populated the portfolio appropriately then we believe our portfolio will perform well regardless of the economic environment. We look for companies that have resilient business models and highly competent management teams as well as significant financial wherewithal and cushion. We believe IG credit would outperform the majority of risk assets if we end up in a Fed‐drive recession scenario.

Time Marches On

Credit is off to a good start in 2023 but there is still plenty of work to do to erase the negative returns of 2022. Thankfully, time is the biggest friend of bond investors. Bonds have a stated maturity and those that are trading at a discount will move closer to par with the passage of time. Time also allows investors to reap coupon income. We believe the future is bright for bond investors that are in it for the long haul. Risks remain, to be sure, and we are particularly concerned with geopolitical risks. We also can’t help but wonder what stones have yet to be uncovered as it relates to the speed with which the Fed has increased its policy rate. We will continue to grind away for you and for the rest of our clients doing our best to earn a superior risk adjusted return. Thank you for your continued interest and for your confidence in us as a manager.

This information is intended solely to report on investment strategies identified by Cincinnati Asset Management. Opinions and estimates offered constitute our judgment and are subject to change without notice, as are statements of financial market trends, which are based on current market conditions. This material is not intended as an offer or solicitation to buy, hold or sell any financial instrument. Fixed income securities may be sensitive to prevailing interest rates. When rates rise the value generally declines. Past performance is not a guarantee of future results. Gross of advisory fee performance does not reflect the deduction of investment advisory fees. Our advisory fees are disclosed in Form ADV Part 2A. Accounts managed through brokerage firm programs usually will include additional fees. Returns are calculated monthly in U.S. dollars and include reinvestment of dividends and interest. The index is unmanaged and does not take into account fees, expenses, and transaction costs. It is shown for comparative purposes and is based on information generally available to the public from sources believed to be reliable. No representation is made to its accuracy or completeness. Additional disclosures on the material risks and potential benefits of investing in corporate bonds are available on our website: https://www.cambonds.com/disclosure‐statements/.

The information provided in this report should not be considered a recommendation to purchase or sell any particular security. There is no assurance that any securities discussed herein will remain in an account’s portfolio at the time you receive this report or that securities sold have not been repurchased. The securities discussed do not represent an account’s entire portfolio and in the aggregate may represent only a small percentage of an account’s portfolio holdings. It should not be assumed that any of the securities transactions or holdings discussed were or will prove to be profitable, or that the investment decisions we make in the future will be profitable or will equal the investment performance of the securities discussed herein.

i St. Louis Fed, 2022, “10‐Year Treasury Constant Maturity Minus 2‐Year Treasury Constant Maturity”
ii Wells Fargo Securities, March 16 2023, “Credit Flows | Supply & Demand: 3/9‐3/15”
iii Bloomberg, April 4 2023, “US Job Openings Fall Below 10 Million for First Time Since 2021”

10 Apr 2023

2023 Q1 COMENTARIO DEL PRIMER TRIMESTRE

El crédito con grado de inversión (en inglés IG) registró rendimiento total positivo estable a partir de 2023. Durante el primer trimestre, el diferencial ajustado por opciones (OAS) en el Índice de Bonos Corporativos de EE. UU. de Bloomberg se amplió en 8 puntos básicos y llegó a 138 después de haber comenzado el año en 130. Con diferenciales más amplios, el rendimiento positivo durante el trimestre se vio impulsado por los ingresos por cupones y un repunte en los bonos del Tesoro, con el título a 10 años cerrando el trimestre en 3.47 %, 41 puntos básicos menos en lo que va del año.

Durante el primer trimestre, este Índice registró una rentabilidad total del +3.50 %. La rentabilidad total sin comisiones del programa de grado de inversión de CAM durante el trimestre fue del +3.41 %.

El grado de inversión vuelve a estar de moda

En nuestro último comentario, escribimos que el rendimiento total del crédito con grado de inversión podría estar a punto de rebotar. El Índice Corporativo ahora ha publicado dos trimestres consecutivos con rendimiento total positivo: el cuarto trimestre de 2022 y el primer trimestre de 2023 con +3.63 % y +3.50 %, respectivamente. 2022 fue el peor año en cuanto a rentabilidad total para el credito con grado de inversión registrado (-15.76 %), y el 7 de noviembre llegó al valor más bajo desde el pun o de vista de la rentabilidad. Desde el 7 de noviembre, el Índice Corporativo ha registrado una rentabilidad total positiva del +8.89 %, lo que ilustra la rapidez con la que puede cambiar el temperamento del mercado.

Los bonos del Tesoro a corto plazo ofrecen actualmente algunos de los rendimientos más elevados de los últimos años. El bono a 2 años cerró el primer trimestre de 2023 en 4.03 % y creemos que los de corta duración son una alternativa atractiva frente al efectivo. Aunque las tasas de corto plazo pueden resultar atractivas para colocar algo de efectivo, no creemos que sean un sustituto adecuado para una cartera de bonos corporativos de mediano plazo para la mayoría de los inversores, debido al alto grado de riesgo de reinversión que presentan. Cuando la Reserva Federal gire y comience a recortar la tasa de referencia, es probable que el rendimiento de los bonos del Tesoro de corto plazo tomen la misma dirección. En ese momento, un inversor que busque reemplazar sus bonos del Tesoro de corto plazo puede encontrarse con que el crédito de mediano plazo ha repuntado de forma significativa desde entonces en términos relativos; lo que podría hacer que el punto de entrada para el crédito con grado de inversión resultase menos atractivo de lo que es hoy. Al evitar los bonos corporativos de mediano plazo y limitar las asignaciones de renta fija a activos de corta duración, el inversor posiblemente corre el riesgo de renunciar a una buena cantidad de rentabilidad total. Para ciertas clases de activos, el posicionamiento táctico y la búsqueda del momento justo en el mercado pueden ser un esfuerzo beneficioso. Sin embargo, no creemos que el crédito con grado de inversión sea de ese tipo. En cambio, sostenemos que es más eficaz para los inversores con horizontes de medio o largo plazo considerar el crédito con grado de inversión de manera estratégica y asignarle una posición de capital permanente en una cartera de inversión bien diversificada.

Dinero y banca

Dada la agitación bancaria, pensamos que sería ilustrativo comentar la exposición y la filosofía de inversión de CAM en lo que respecta al sector de las instituciones financieras.

El sector financiero comprende una gran parte del Índice Corporativo, con una ponderación del 33.07 % al cierre del primer trimestre de 2023. La banca fue la industria más grande dentro del sector financiero, con una ponderación del 23.22 %. El resto de las industrias que componen la balanza del sector financiero son agentes de bolsa y administradores de activos, empresas financieras, aseguradoras, fideicomisos de inversión inmobiliaria (o REIT) y otras finanzas. CAM siempre ha tratado de limitar la cartera de cada cliente a una ponderación del 30 % (o menos) dentro del sector financiero para garantizar una diversificación adecuada desde el punto de vista del riesgo. A finales del primer trimestre, la cartera de CAM tenía una exposición ligeramente inferior al 20 % en la banca, mientras que el resto de la exposición en el sector financiero se componía de tres empresas de seguros de propiedad y siniestros (P&C) y dos empresas de REIT.

En cuanto a la exposición en el sector bancario, CAM es muy selectiva, con inversiones en apenas 11 bancos a fines del primer trimestre de 2023. Con un enfoque disciplinado en esta industria, siempre nos hemos centrarnos en instituciones bien administradas y de alta capitalización con flujos de ingresos muy diversificados y huella crediticia en diferentes regiones. El carácter fundamental de la filosofía de inversión de CAM y su proceso de análisis particular excluyen a bancos especializados y a bancos regionales porque tienen carteras de préstamos demasiado expuestas a determinados sectores o porque sus huellas están demasiado concentradas. Aplicamos el mismo tipo de análisis riguroso a nuestras exposiciones financieras en seguros y REIT. Como resultado, tenemos un alto grado de confianza en nuestras inversiones en el sector de instituciones financieras.

Aversión a la inversión

Seguimos recibiendo preguntas de los inversores sobre la curva de rendimiento invertida y su impacto en la cartera. Hay dos grandes temas para analizar.

  1. Para las cuentas nuevas, la inversión es auspiciosa, y genera un atractivo punto de entrada; mientras que las cuentas más antiguas pueden disfrutar de este mismo beneficio cuando realizan nuevas compras. La curva invertida ha creado de manera sistemática situaciones en las que resulta oportuno comprar bonos de mediano a corto plazo que, en nuestra opinión, probablemente tengan buen desempeño a medida que la curva se normalice con el tiempo. Pudimos comprar bonos que vencen en 7-8 años a precios que son atractivos en relación con los bonos de 9-10 años. Esto se traduce en una menor duración global para la cartera de clientes y un menor riesgo de la tasa de interés. Este tipo de oportunidades son mucho más pasajeras en entornos con curvas de bonos del Tesoro normalizadas al alza.
  2. Para las cuentas más antiguas o con inversión completa, el período de tenencia será más largo de lo habitual. Esto se debe a que la curva de rendimiento invertida ha dado lugar a una economía menos atractiva para las operaciones de extensión. En lugar de vender bonos a los 5 años, como haríamos normalmente, seguiremos conservándolos y cobrando los cupones mientras esperamos la normalización de la curva. Tendremos paciencia y estaremos atentos al panorama para ver si se presentan oportunidades de extensión; lo que significa que es probable que mantengamos los bonos existentes hasta que queden 3 o 4 años para su vencimiento, siempre que la curva permanezca invertida.

Las curvas del bono del Tesoro se normalizarán, siempre lo han hecho. Históricamente, las curvas invertidas han sido breves; la mayor duración registrada para 2/10s fue de 21 meses, de agosto de 1978 a abril de 1980.i La curva invertida actual 2/10 comenzó el 5 de julio de 2022 y alcanzó su punto más marcado de -107 pb el 8 de marzo de 2023 antes de revertir bruscamente su curso para terminar el trimestre en -55 pb. El catalizador más probable de un ascenso en la curva de rendimiento es un ciclo de relajación de la Reserva Federal y una disminución en la tasa de fondos federales. La mera anticipación de una pausa en el ciclo de alzas podría bastar para que el mercado iniciara el proceso de vuelta a una curva más normalizada para los bonos del Tesoro.

La demanda de crédito con grado de inversión se ha mantenido fuerte a principios de año. Según fuentes compiladas por Wells Fargo, los fondos con grado de inversión registraron $62,100 millones de entradas en lo que va del año hasta el 15 de marzo. Hemos observado esta demanda y el impacto asociado en los precios en el mercado primario, en particular, de los grandes compradores institucionales. En nuestro caso, el período de inversión para una cuenta nueva es de 8 a 10 semanas en promedio. En el caso de las cuentas nuevas, históricamente hemos sido muy consistentes en buscar oportunidades atractivas en el mercado primario, de modo que se podría esperar que entre el 30 % y el 35 % de la cartera estuviera compuesta por nuevas emisiones. Las cuentas más antiguas también podrían comprar nuevas emisiones ocasionalmente, a medida que reciben ingresos por cupones y se acumula efectivo al punto de que la cuenta está lista para realizar una compra.
Repasemos la mecánica de lo que observamos en la actualidad en el mercado primario:
Una empresa y la banca de inversión, en un mercado normalizado con una demanda equilibrada, podrían estar dispuestos a pagar lo que llamamos una “concesión por nueva emisión” a los inversores para incentivarlos a comprar un bono recién emitido. Por ejemplo, si una empresa tiene un bono en circulación a 9 años que se negocia con un diferencial de 100/10 años, sería totalmente razonable que un inversor esperara que le pagaran 115/10 años para compensar la duración adicional, así como alguna otra compensación en forma de diferencial para incentivarlo a comprar el nuevo bono. Las concesiones por nuevas emisiones cambian con frecuencia y se basan en la dinámica del mercado, como la situación de la economía, las cuestiones geopolíticas, la demanda global de crédito, así como las características de la empresa emisora y la opinión generalizada sobre su solvencia crediticia. A veces, las concesiones por nuevas emisiones pueden ser muy atractivas y otras veces pueden ser fijas o incluso negativas.
A lo largo del primer trimestre, observamos con mucha frecuencia concesiones por nuevas emisiones fijas o negativas, por lo que los bonos secundarios de un emisor determinado resultaron más atractivos que los nuevos. En ocasiones, se debió a que los bonos secundarios eran una inversión oportunista en relación con los bonos nuevos, pero en otras se debió a que tanto los bonos secundarios como los nuevos estaban valorados de manera razonable o sobrevalorados según nuestro análisis. El razonamiento para comprar un bono a 10 años que ofrece menos rendimiento que un bono a 8 años puede parecer poco sensato, pero la lógica reside en cómo consideramos las limitaciones impuestas a los inversores en el mercado de bonos corporativos. Los bonos son finitos, se negocian en el mercado extrabursátil (no en bolsa) y son menos líquidos que las acciones. Hay un problema importante al que puede enfrentarse de vez en cuando un interesado en comprar un bono: ¿qué pasa si no hay quien esté dispuesto a vender? Para complicar más aún al comprador de nuestro ejemplo, ¿qué sucede si dispone de mucho dinero en efectivo que necesita invertir? Este es el fenómeno que estamos observando actualmente; compradores muy grandes que están dispuestos a “pagar bien” para que el dinero rinda. El comprador grande no puede salir y comprar $10-$50 millones del bono secundario porque, sencillamente, no hay suficientes vendedores. En cambio, el comprador grande debe pagar una prima para que su dinero rinda y pagar demasiado (en nuestra opinión) por un bono en el mercado primario. Esto no es un problema para CAM y destaca una de nuestras ventajas comparativas. Como administrador boutique, aún somos lo bastante pequeños como para poder operar con libertad y comprar lo que necesitamos de forma oportunista para cubrir las cuentas de los clientes. Si nos dan la opción de comprar un bono más corto con un rendimiento más alto que un bono más largo del mismo emisor, compraremos el corto siempre y cuando den los números desde el punto de vista económico. Aunque es probable que el bono más reciente tenga un cupón más alto porque su precio se basa en una tasa del Tesoro más alta que el bono a 8 años, cuyo precio se fijó hace dos, el cupón por sí solo no lo es todo. El diferencial y el rendimiento por duración es la verdadera clave para generar rentabilidad total, no el cupón. El siguiente es un ejemplo real que observamos a principios de febrero de este año:

El nuevo bono procedía de un emisor que tenemos en alta estima y una empresa en la que actualmente invertimos para cuentas de clientes (nota: no mencionamos el nombre de la empresa porque no se trata de una recomendación para comprar o vender un título-valor específico). El precio inicial de la nueva emisión era de +170 pb/10 años, un nivel que consideramos atractivo dada la solvencia del emisor y su valor relativo en el mercado en aquel momento, pero ese precio era solo un punto de partida. En el caso de las emisiones nuevas, el precio inicial cambia en respuesta a la solidez de la demanda y es un proceso muy fluido que se produce en unas pocas horas. En este caso particular, hubiéramos estado dispuestos a comprar el nuevo bono a un diferencial de +160 pb o superior, pero dada la fuerte demanda de compradores, el sindicato logró mover el precio a +143 pb, momento en el que dejamos de participar. Por lo tanto, en este escenario, dada la posibilidad de comprar el nuevo bono y el bono secundario, sin duda elegiríamos el bono secundario por varias razones. El bono secundario ofrecía 2 pb más de rendimiento, requería una inversión inicial de $14 menos por su precio con descuento, y su vencimiento era 29 meses menor que el del nuevo bono, con un rendimiento significativamente mayor por duración. Resulta que, en este ejemplo, decidimos no comprar el bono secundario porque consideramos que estaba muy valorado en ese momento y no era una oportunidad para invertir el capital de nuestros clientes. Si el bono se hubiera negociado con un diferencial de +150, lo hubiéramos comprado. Este es solo un ejemplo de nuestra disciplina de inversión, en cómo abordamos las decisiones que tomamos para los clientes a diario. Esperamos que esto sea útil para explicar algunas de las dinámicas que hemos estado viendo en el mercado para comenzar el año y cómo encaramos la administración de riesgos y las oportunidades para las cuentas de clientes.

¿Qué hará la Reserva Federal?

Sabemos que la Reserva Federal no puede aumentar su tasa de referencia monetaria para siempre. Ya hemos visto las consecuencias de este ciclo de alzas sin precedentes, como las grietas que han aparecido en algunos rincones de la banca, y creemos que cada vez es más evidente que la política monetaria está empezando a frenar la economía. A finales del primer trimestre de 2023, los futuros de fondos federales preveían un alza en las tasas de +25 bp en la reunión de mayo y un 43 % de probabilidades de un alza de +25 bp en la reunión de junio. Quizá lo más sorprendente sea que los futuros también preveían tres recortes en la tasa de interés de referencia en los tres últimos meses del año. Desde entonces hemos recibido un magro informe de ofertas de empleo en la mañana del 4 de abril que mostró que la demanda laboral y las ofertas de empleo se han enfriado en EE. UU. con una caída de 10 millones por primera vez desde mayo de 2021.ii El próximo gran dato será el informe de empleo de marzo, que se publicará el 7 de abril. Creemos que la Reserva Federal seguirá guiándose por los datos, sobre todo en lo que respecta al empleo. Si el mercado laboral se enfría de forma significativa, el actual ciclo de alzas podría haber alcanzado ya su punto álgido. Si el mercado laboral lo resiste, prevemos una o dos alzas más y posiblemente más si es necesario. En la actualidad, nos resulta difícil prever recortes en 2023 y creemos que lo más probable es una pausa de varios meses.

Seguimos creyendo que la Reserva Federal no tiene muchas opciones: tiene que endurecer demasiado las condiciones o durante demasiado tiempo, lo que seguramente conducirá a una recesión. Predecir el momento o la profundidad de cualquier recesión es difícil, por lo que consideramos más productivo centrarnos en los riesgos que podemos medir y controlar mejor dentro de nuestra cartera, y el riesgo de crédito es la variable en la que podemos ejercer mayor influencia. Creemos que estamos bien equipados para administrar y evaluar el riesgo crediticio de las carteras de clientes gracias a nuestro equipo de gran experiencia. En general, una recesión no es buena para los activos de riesgo, pero no es una sentencia de muerte para el crédito con grado de inversión. Estas empresas tienen grado de inversión por una razón, y si hemos hecho nuestro trabajo y hemos surtido la cartera de forma adecuada, creemos que se desempeñará bien con independencia del entorno económico. Buscamos empresas que presenten modelos de negocio resilientes y equipos de dirección muy competentes, así como con gran capacidad financiera y margen de maniobra. Creemos que el crédito con grado de inversión podrá superar a la mayoría de los activos de riesgo si acabamos en un escenario de recesión impulsado por la Reserva Federal.

El tiempo sigue avanzando

El crédito se inicia con viento a favor en 2023, pero aún queda mucho por hacer para saldar los rendimientos negativos de 2022. Afortunadamente, el tiempo es el mejor aliado de los inversores en bonos. Los bonos tienen un vencimiento establecido y los que cotizan con descuento se acercarán a la par con el paso del tiempo. El tiempo también les da a los inversores la oportunidad de obtener ingresos por cupones. Creemos que el futuro es prometedor para los inversores en bonos a largo plazo. Los riesgos persisten, sin duda, y estamos particularmente preocupados por la situación geopolítica. Tampoco podemos dejar de preguntarnos qué nos resta aún conocer en cuanto a la velocidad con la que la Reserva Federal ha aumentado la tasa de referencia. Seguiremos trabajando sin descanso para usted y para el resto de nuestros clientes, haciendo todo lo posible para obtener una rentabilidad superior ajustada al riesgo. Gracias por su continuo interés y por su confianza en nosotros como administradores.

Esta información solo tiene el propósito de dar a conocer las estrategias de inversión identificadas por Cincinnati Asset Management. Las opiniones y estimaciones ofrecidas están basadas en nuestro criterio y están sujetas a cambios sin previo aviso, al igual que las declaraciones sobre las tendencias del mercado financiero, que dependen de las condiciones actuales del mercado. Este material no tiene como objetivo ser una oferta ni una solicitud para comprar, mantener ni vender instrumentos financieros. Los valores de renta fija pueden ser vulnerables a las tasas de interés vigentes. Cuando las tasas aumentan, el valor suele disminuir. El rendimiento pasado no es garantía de resultados futuros. El rendimiento bruto de la tarifa de asesoramiento no refleja la deducción de las tarifas de asesoramiento de inversión. Nuestras tarifas de asesoramiento se comunican en el Formulario ADV Parte 2A. En general, las cuentas administradas mediante programas de firmas de corretaje incluyen tarifas adicionales. Los rendimientos se calculan mensualmente en dólares estadounidenses e incluyen la reinversión de dividendos e intereses. El índice no está administrado y no considera las tarifas de la cuenta, los gastos y los costos de transacción. Se muestra con fines comparativos y se basa en información generalmente disponible al público tomada de fuentes que se consideran confiables. No se hace ninguna afirmación sobre su precisión o integridad. En nuestro sitio web se encuentran disponibles las divulgaciones adicionales sobre los riesgos materiales y los beneficios potenciales de invertir en bonos corporativos: https://www.cambonds.com/disclosure-statements/.


La información proporcionada en este informe no debe considerarse una recomendación para comprar o vender ningún valor en particular. No hay garantía de que los valores que se tratan en este documento permanecerán en la cartera de una cuenta en el momento en que reciba este informe o que los valores vendidos no hayan sido vueltos a comprar. Los valores de los que se habla no representan la cartera completa de una cuenta y, en conjunto, pueden representar solo un pequeño porcentaje de las tenencias de cartera de una cuenta. No debe suponerse que las transacciones de valores o tenencias analizadas fueron o demostrarán ser rentables, o que las decisiones de inversión que tomemos en el futuro serán rentables o igualarán el rendimiento de la inversión de los valores discutidos en este documento.

i Reserva Federal de St. Louis, 2022, “10-Year Treasury Constant Maturity Minus 2-Year Treasury Constant Maturity”
ii Wells Fargo Securities, 16 de marzo de 2023, “Credit Flows | Supply & Demand: 3/9-3/15”
iii Bloomberg, 4 de abril de 2023, “US Job Openings Fall Below 10 Million for First Time Since 2021”

12 Jan 2023

2022 Q4 INVESTMENT GRADE QUARTERLY

It will be remembered as the year to forget for investment grade corporate credit as the asset class generated the largest negative yearly total return in its history driven by a combination of wider spreads and much higher interest rates.  For the full year 2022, the option adjusted spread (OAS) on the Bloomberg US Corporate Bond Index widened by 38 basis points to 130 after having opened the year at 92.  The 4th quarter was particularly volatile for credit spreads as the OAS on the index traded as wide as 165 in mid-October after which spreads marched steadily tighter into year-end.  Treasuries also experienced a massive amount of volatility in the 4th quarter with the 10yr Treasury trading as high as 4.24% at the end of October and then as low as 3.42% near the beginning of December before finishing the year at 3.88%.  The full year numbers really illustrate the pain-trade for interest rates as the 10yr Treasury posted its largest one-year gain in history of +237 basis points, more than doubling from its starting point of 1.51%.

For the full year 2022, the Corporate Index posted a total return of -15.76%.  CAM’s Investment Grade Program gross of fees total return for the full year 2022 was -13.31% (-13.52% net of fees).  As bad as the year was, the Corporate Index did manage to finish on a high note with a positive 4th quarter total return of +3.63%.  This compares to CAM’s gross 4th quarter return of +2.99% (2.93% net).  Looking at longer time periods, the Corporate Index ended 2022 with 5 and 10-year returns of +0.45% and 1.96%, respectively.  CAM’s investment grade program posted 5 and 10-year gross annualized returns of +0.70% (0.47% net) and 1.90% (1.66% net), respectively.

There was nowhere to hide in 2022, with all buckets of maturities and credit ratings posting negative returns.  Intermediate credit performed relatively better than longer dated credit due to its lower duration.  A-rated credit performed slightly better than the index as a whole and it outperformed both >Aa-rated credit and Baa-rated credit but the returns picture was ugly across the board.

When Will the Tide Turn for Corporate Bonds?

 The fact is that returns for IG credit have already started to improve.  Please note that we are not calling a bottom by any means, we are just observing the data and reasoning that it is entirely possible that the worst is over for this cycle.  When the market closed on November 7, the Corporate Index to that point in the year had posted a negative total return of -20.65%.  The index then rebounded, benefitting from tighter credit spreads and lower interest rates, and finished the year with a negative total return of -15.76%.  From November 7 until year end the index posted a +4.89% total return.  In our experience many investors tend to wait on the sidelines for the perfect entry point, missing much of the low hanging fruit when the tide has turned.

When it comes to bonds, negative returns have typically made for opportunity.  We do not know what the future will bring and past returns are not indicative of future results, but a glimpse of history paints a favorable picture for IG corporates.

2022 was by far the worst year of performance since the inception of the Corporate Bond Index in 1973, eclipsing the second worst year of performance by a whopping -9.90%.  In the past 50 years there have been 11 years where the index has posted negative returns.  Only twice has the index posted consecutive years of negative returns, 1979-1980 and 2021-2022.  The index has never posted 3 consecutive years of negative total returns.  The average return the year after the index has posted a negative return is +8.17%.  This is no guarantee of positive returns in 2023 but it does illustrate the resiliency of investment grade credit as an asset class over the course of history.

Wider credit spreads and much higher Treasuries have led to some of the largest yields that have been available in IG corporates in more than a decade.  The yield to maturity on the Corporate Index finished the year at 5.42% and it traded at just over 6% in the first week of November.  The average yield to maturity on the index going back to the beginning of 2010 was 3.33%.  When the all-in yield for intermediate corporate bonds is >5% it gives the investor a much larger margin of safety, increasing the probability that IG corporate bonds will generate positive total returns in the future even if spreads and/or interest rates go higher.  To put this into context, take the 38 basis point widening in credit spreads that the index experienced in 2022.  If an investor were to purchase the index today at a YTM of 5.42% and spreads moved wider by 38 basis points over the course of the next year but interest rates did not move at all then that investor will have earned an annual total return of >5% despite the move wider in spreads.  Even if interest rates also traded higher by +50bps in addition to the +38bp move wider in spreads then our hypothetical investor would have earned a total return of >4.5%.  We believe IG corporate yields that are meaningfully higher than they have been in the recent past offer an attractive opportunity for investors and the compensation is high enough to offset short term volatility.

U.S. Recession Looms Large

Much has been written about what may be the most widely anticipated recession in history.  According to sources compiled by Bloomberg, forecasters surveyed by the Federal Reserve Bank of Philadelphia put the probability of a downturn in 2023 at more than 40% and economists polled by Bloomberg see the chances of recession in 2023 at 65%.[i]  We hate to be on the same side of what appears to be a crowded trade but we agree that a recession is more likely than not over the course of the next 18 months, either in 2023 or the first half of 2024.  Our belief stems largely from restrictive Federal Reserve policy as well as the FOMC’s commitment to tame inflation.  A dramatic move higher in the Federal Funds Target Rate of +425bps in one calendar year has begun to have its intended effect with certain sectors of the economy, such as housing, experiencing a significant contraction.ii  But the Fed is not done yet, and additional rate hikes are in the queue. We believe that the Fed will maintain tight conditions until it sees significantly diminished demand within the labor market.  In our view, the Fed cannot afford to reverse course too quickly and if anything it is likely to hold the policy rate in restrictive territory for longer than expected.  This bias toward Fed “over-tightening” underpins our recession expectations.

How can investors prepare for a recession?  We are admittedly biased as a corporate bond manager but we think an appropriate allocation to IG credit could be very useful to most investors in order to sufficiently diversify and position their overall investment portfolios for an economic slowdown.  A recession is not guaranteed and we may find instead that the economy simply grows at a low rate for some period of time.  Historically, according to data compiled by Credit Suisse, in a scenario with quarterly GDP growth of 0-1% IG credit has performed well and generated positive spread returns.iii In a scenario where the economy experiences a brief shallow recession with modestly negative growth IG spreads have historically widened, but this does not necessarily mean negative total returns.  IG credit has typically outperformed other risk assets during periods of negative economic growth.iv  By and large, investment grade rated companies took full advantage of the low interest rate environment that was available to them in recent years and as a result most IG balance sheets are flush with liquidity and maturity walls have been pushed out making a modest downturn easily navigable for the vast majority of IG-rated companies.  Credit metrics for the index have deteriorated slightly from the peak which was at the end of the first quarter of 2022, but fundamentals are still very strong.  At the end of the third quarter 2022 net leverage for the index (ex-financials) was 2.9x while EBITDA margin was 28.2% and interest coverage was 15.1x.

Where things start to get a little trickier is if there is a more prolonged deeper recession.  In a “deep recession” scenario we would expect credit spreads to trade meaningfully wider.  An OAS of 200+ on the index versus 130 at the end of the year would be probable in a deep recession scenario.  However, in such a scenario we could also see Treasury yields trade lower which would serve to offset wider credit spreads.  The most important thing for investors is the aforementioned level of yield that is available today, which is much higher than in the recent past, offering a buffer against any short term volatility incurred as the result of a recession.

Inverted Treasury Curves & Our Response

We have touched on this topic in previous commentaries and we continue to get questions from our investors so we think that it would be helpful to revisit.  An inverted curve makes bond investing more challenging but the economics still work.  There are two curves to think about as a corporate bond investor.  The underlying curve is the Treasury curve or risk free rate –this is the base rate and any IG corporate bond that an investor purchases will be at an additional spread on top of the risk free rate.  The spreads investors are paid for owning various maturities of corporate bonds form their own curve which we refer to as the corporate credit curve.  So we have two curves, and in normalized times they are both upward sloping.  The corporate credit curve is always upward sloping other than idiosyncratic cases inspired by market volatility that are quickly arbitraged away.  The Treasury curve is almost always upward sloping but it can invert, especially in economic environments like the one we are in currently.  Think of it this way –the Fed Funds Rate is extremely meaningful to where the 2yr Treasury trades but not very meaningful at all for where the 10yr trades.  This is because the 2yr is a short maturity that has to adjust for Fed Funds but the 10yr trading level is predicated on investor expectations for longer term economic growth and inflation expectations.

As an example, if a company issued new bonds on December 30 an investor would always be compensated with more yield to purchase the 10yr bond of that company relative to the 5yr bond.  This is despite the fact that at the end of 2022 the 10yr Treasury had a yield of 3.87% while the 5yr Treasury had a yield of 4.00% –the 5/10 Treasury curve was inverted by 13 basis points.  In order to make up for the Treasury curve inversion, market participants demand sufficiently more spread compensation to own the 10yr corporate bond relative to the 5yr corporate bond –the corporate credit curve would be even steeper than usual to account for the inverted Treasury curve.

Curve inversion has impacted our strategy at CAM, but only at the margins. In a typical environment we buy bonds that mature in 9-10 years and then we sell around the 5yr mark.  Curve inversion along with other technical factors at play in the market have created an environment where there are many more attractive investment opportunities for us to purchase that mature in 7-9 years but it has also required us to hold our current investments somewhat longer, until the 3-4 year mark in order to affect a more economic sale.  We are still looking at a holding period that averages approximately 5 years for new portfolios, but we are getting to that 5-year holding period with slightly shorter maturities.  At the end of the day much of this is a positive for our investors because shorter maturities carry less interest rate risk.

Curve inversions are typically quite brief in nature with the longest period of inversion on record for 2/10s being 21 months from August 1978 until April 1980.vi  The current 2/10 curve inversion began on July 5 2022 and was at its most deeply inverted point of -84 bps on December 7 2022 relative to -56 bps at year end 2022.

A New Year Brings Opportunity but Same Old Risks Remain

It is time to move on from the bond market rout of 2022 and focus on the opportunities that the drawdown has created.  We have already gone over those points and will not rehash them here; we will only remind investors that change can come quickly.  We would also like to remind investors that bonds sold off for a reason and risks remain.  The Federal Reserve has not yet completed its tightening cycle and we would caution investors from even beginning to think about easing financial conditions.  A recession in the U.S. could be imminent and in the Euro Zone it feels as though the odds of dodging a recession are infinitesimal.  Geopolitical risk remains at the forefront of investor concern as China attempts to successfully navigate its economic reopening and the war in Ukraine rages on.  These risks are balanced against an opportunity set for longer term investors that is compelling due to the risk/reward afforded by IG credit.

2022 was a difficult year for all bond investors.  We appreciate the trust you have placed in us as a manger and we look forward to doing our best to provide you with better returns in 2023.  We welcome any comments or concerns and look forward to an ongoing productive dialogue in the year ahead.

This information is intended solely to report on investment strategies identified by Cincinnati Asset Management. Opinions and estimates offered constitute our judgment and are subject to change without notice, as are statements of financial market trends, which are based on current market conditions. This material is not intended as an offer or solicitation to buy, hold or sell any financial instrument.  Fixed income securities may be sensitive to prevailing interest rates.  When rates rise the value generally declines.  Past performance is not a guarantee of future results.  Gross of advisory fee performance does not reflect the deduction of investment advisory fees.  Our advisory fees are disclosed in Form ADV Part 2A.  Accounts managed through brokerage firm programs usually will include additional fees.  Returns are calculated monthly in U.S. dollars and include reinvestment of dividends and interest. The index is unmanaged and does not take into account fees, expenses, and transaction costs.  It is shown for comparative purposes and is based on information generally available to the public from sources believed to be reliable.  No representation is made to its accuracy or completeness.  Additional disclosures on the material risks and potential benefits of investing in corporate bonds are available on our website: https://www.cambonds.com/disclosure-statements/.


The information provided in this report should not be considered a recommendation to purchase or sell any particular security.  There is no assurance that any securities discussed herein will remain in an account’s portfolio at the time you receive this report or that securities sold have not been repurchased.  The securities discussed do not represent an account’s entire portfolio and in the aggregate may represent only a small percentage of an account’s portfolio holdings.  It should not be assumed that any of the securities transactions or holdings discussed were or will prove to be profitable, or that the investment decisions we make in the future will be profitable or will equal the investment performance of the securities discussed herein.

i Bloomberg, January 3 2023 “The Most-Anticipated Downturn Ever”
ii The Wall Street Journal, December 7 2022 “What’s Going On With the Housing Market?”
iii Credit Suisse, December 7 2022 “CS Credit Strategy Daily (2023 US Cash Outlook)”
iv Credit Suisse, December 7 2022 “CS Credit Strategy Daily (2023 US Cash Outlook)”
v Barclays, December 13 2022 “US Investment Grade Credit Metrics Q3 22 Update”
vi St. Louis Fed, 2022, “10-Year Treasury Constant Maturity Minus 2-Year Treasury Constant Maturity”

12 Oct 2022

2022 Q3 Investment Grade Quarterly

Negative performance continued to plague the investment grade credit market during the third quarter and 2022 built on its record as the most difficult year of performance that the market has ever experienced. It was a hopeful start to the quarter, as investment grade bonds posted sharply positive returns for the month of July, but August and September were ugly, as Treasury yields climbed higher, creating a major headwind for performance. Credit spreads finished the quarter modestly wider but behaved reasonably well for most of the period and the spread performance of IG‐credit was relatively strong compared to other risk assets, but the magnitude of the sell‐off in Treasuries during the quarter and during the first 9 months of 2022 has led to historically poor performance across fixed income. The option adjusted spread (OAS) on the Bloomberg US Corporate Bond Index widened by 4 basis points during the quarter to 159 after having opened the quarter at an OAS of 155. The 10yr Treasury opened the quarter at 3.01% and finished 82 basis points higher, at 3.83%. The 5yr Treasury opened the quarter at 3.04% and finished 105 basis points higher, at 4.09%. The 2yr Treasury opened the quarter at 2.95% and finished 133 basis points higher, at 4.28%. The very front end of the yield curve has experienced the most dramatic movement year‐to‐date and the 2yr has now climbed 355 basis points during 2022 through the end of the third quarter.

The Corporate Index posted a third quarter total return of –5.06%. CAM’s Investment Grade portfolio net of fees total return for the third quarter was –4.12%.

The drawdown in credit has continued.  We cannot predict when the tide will turn but we are confident that it will do so eventually, and it is only a matter of time.  An increasing amount of hawkishness has been priced into the Treasury markets as the year has worn on.  Eventually, the economic data on inflation will break, whether it is this year, in 2023, or even beyond that.  The valuations and compensation afforded from high quality investment grade credit are as high as they have been in a very long time.  The process of getting to these yields has been painful to endure but the market is now trading at levels that set up well for investors with longer time horizons.  The market could cheapen further but higher Treasury rates and wider credit spreads have given investors a larger margin of safety and increased the likelihood of positive returns in the future.

Cash Alternatives Are Back, Finally

 We are a bond manager and are not in the business of giving investment advice, but this is a topic that has started to come up frequently in our conversations so we thought it would be helpful to discuss.  The rise in short term Treasury rates has given investors the option to generate higher levels of income without taking much duration risk for the first time in a long time.  For example, the 2-year Treasury has not offered yields this high since 2007.  This is a great cash alternative for many investors in our opinion.  Some may prefer to park their short term funds while for others it may make sense to allocate a larger portion of their portfolio.

We have received questions asking why we have not changed our intermediate investment grade strategy, putting all of our investments into short duration assets or even short term Treasuries.  What investors need to understand is that a portfolio that is entirely reliant on short duration securities introduces a risk for those that have medium or longer term time horizons: reinvestment risk.  When the time comes to sell or, for example, when the 2-year Treasury matures, the landscape could look totally different.  Credit spreads could have raced tighter or intermediate Treasury yields could have decreased – or both of these things could have occurred, meaning the investor missed out on larger returns and now they find themselves in a position where they need to redeploy capital into a market with richer valuations.  So we would caution investors from making wholesale tactical changes to their fixed income portfolios.  A Strategic approach may yield better results, because like all risk assets, fixed income benefits an overall portfolio by being diverse in its exposure.  Having different maturities, credit exposures and asset classes within fixed income is in our opinion the best way to build a portfolio with a longer term view.   We do offer a variety of short duration strategies at CAM, but for most investors with longer time horizons a combination of short and intermediate duration strategies will typically be the best fit.

What Now for Low Dollar Bonds?

We have officially exited the longstanding regime of ultralow interest rates.  As rates have rapidly increased, some of our holdings have incurred significant price declines.  This is particularly the case with bonds that we purchased in 2020-2021 that were newly issued at the time.  This was a time period when interest rates were much lower and credit spreads were tighter than they are today. As a result, many of these bonds have coupons that are lower than Treasuries are today, thus they have seen significant price declines, with dollar prices in the high 70s or low 80s (price declines of more than 15-20% since issuance).  In almost all of these cases, our ongoing analysis has shown that the company that issued the bonds is operating well from the standpoint of creditworthiness.  In other words, the price declines have not stemmed from concerns over credit risk but rather the declines have been all about duration and higher interest rates.  We have received questions from investors about our expectation for price recoveries in these bonds.

Ultimately, the prices of these bonds stand to benefit the most from the passage of time and a reversal of the currently inverted yield curve.  There are two curves that we deal with as a bond manager: the corporate credit curve and the Treasury curve.  The corporate credit curve represents the extra spread that an investor receives for purchasing a corporate bond instead of a Treasury –it is the spread on top of the underlying Treasury.  The corporate credit curve remains steep at the moment, as it almost always is.  For A-rated credit at the end of the third quarter it was not uncommon for us to observe a 5/10 curve of 50 basis points for many A-rated credits.  That is, you could sell a 5yr bond of a company at a spread of 50 basis points over the 5yr Treasury and then use those proceeds to buy the 10 year bond of the same company at a spread of 100 basis points over the 10yr Treasury. The corporate credit curve is even steeper for BAA-rated credits because riskier credits require steeper curves as investors demand more compensation to own the bonds of a lower quality credit. The problem with doing an extension trade at the moment is that at the end of the quarter the 5/10 Treasury curve was inverted to the tune of -26 basis points, which takes a big bite out of the compensation afforded by an extension trade because we are selling off of a higher 5-year Treasury (4.09%) and purchasing a bond that trades off a lower 10-year Treasury (3.83%). We would still be increasing yield by doing this trade, because of the steepness of the corporate credit curve, it is just much less of a yield increase than we would get in a typical environment where we have an upward sloping Treasury curve and an upward sloping credit curve. Thus, in order for these deeply discounted bonds to recover value it requires Treasury yield curve normalization. Historically, yield curve inversions have been brief in nature. The longest period of inversion was 21 months, beginning August 1978 until April 1980 . We don’t know when the yield curve will normalize but we expect that it will over time.

The best prospect for value recovery in a deeply discounted bond that still has good credit metrics is to trust the bond math and to embrace the passage of time as our friend. With each passing day, a bond gets shorter and closer to its maturity and the credit spread gets tighter, all else being equal. The passage of time will also allow the Treasury curve to normalize and give investors a chance to recover principal and to execute more favorable extension trades where both the value of selling and buying are maximized. Finally, as the bond is held, the investor receives coupon payments which serve to help offset the decline in price.

How Are We Responding?

We will always stay true to our mandate as a manager of intermediate maturities, but we will also adapt to market conditions and we have responded to 2022’s market volatility in a number of ways.  The single biggest dislocation we have observed in our portion of the market is that bonds that mature in 7.5-8.5 years have consistently offered exceptional value relative to other portions of the yield curve.  We are still buying 9-10 year maturities when it makes sense to do so but we have been able to consistently find value in shorter maturities which has allowed us to take less duration risk while increasing yield.   For example, it has become commonplace for the ~8yr bond of a company to trade at a wider spread than the ~10yr bond of the same company, which is something that should not happen with a high degree of frequency.  This type of dislocation is something that has always occasionally occurred in the market but it is typically idiosyncratic in nature and quickly arbitraged away by market participants.  What we are observing in 2022 is that this has become widespread which has presented an opportunity for an investor like us because when we buy an 8-year maturity we have a 3 to 4 year time horizon before we are looking to sell.  10-year bonds are trading rich to 8-year bonds usually because of some type of market technical.  We believe that it is most likely occurring because the 10-year bond is being bid-up by short term investors that are primarily concerned with short term liquidity.  These investors believe that the 10-year bond is more liquid and could be easier to sell a week or a month from now if needed.  We are longer term investors and we are not concerned about liquidity a week or a month from now, we care more about liquidity 3 or 4 years from now.  When our 8-year bond rolls down the yield curve and becomes a 5-year bond we are highly confident that we will have plenty of liquidity when the time comes to sell our bonds.  Thus we will happily take advantage of this dislocation for our client accounts.

Not only have we been able to buy shorter maturities, but we have also become more patient when evaluating the sale of existing holdings.  Much of this patience is borne out of necessity as a result of the currently inverted yield curve but some of it is also related to fund flows and technical factors at play in the market.  Traditionally, we would look to exit most securities right around the time that they have 5 years left to maturity.  For extremely high quality A-rated paper you could see us sell with 5.5 years left to maturity while some lower quality BAA-rated paper may need to roll down to 4-4.5 years in order to maximize value.  What we are seeing in the current environment is that there is simply too much “juice” left in many of our 5 year holdings so we are continuing to hold them beyond the typical 5-year time period.  We are willing to wait; allowing that bond to roll down to 3 or 4 years to maturity–it is entirely about being opportunistic and maximizing value for our investors.  As the Treasury yield curve normalizes, we would expect that the market will revert to an environment where it makes more sense to sell nearer the 5-year mark.

We have also been able to take even less credit risk than we typically would.  To be clear, we already position our investment grade strategy as “up-in-quality” relative to its benchmark and that high quality bias comes from the fact that we cap our BAA-rated exposure at 30% while the Corporate Index was 48.93% BAA-rated at the end of the 3rd quarter.  Even though we have a meaningful underweight in BAA-rated credit, we maintain a focus of adding value for our investors through credit research and identification of those BAA-rated credits that are mispriced or that are poised to improve their credit metrics.  Traditionally, we have not necessarily shied away from risk taking in lower quality credit so long as it was for the right reasons and that the compensation was appropriate for the risk incurred.  We always intend to stick to our cap of a 30% weighting for this portion of the market but we have always been willing to take credit risk based on thorough research.  What we are finding in the current environment, however, is that we simply do not need to take much risk in order to find compelling value.  There are plenty of very solid BAA-rated credits that offer spreads that are quite attractive in our view.  We are positioning the portfolio for a recessionary period and shying away from those credits that are most exposed and we are in a position where we are able to dial-back risk without giving up yield.

Fed Fait Accompli

The Federal Reserve has been active in 2022, to say the least. Six rate hikes in six months is unprecedented, and the market has never experienced so many hikes in such a short period of time. The Fed has been clear in its communication in recent weeks. It is fully committed and will not stop until inflation shows signs of slowing. Our only prediction about where the Fed goes from here is that we continue to expect tightening through further increases in Fed Funds until the data on inflation and labor shows signs of cooling. This data is entirely backward looking in nature. This could be problematic for the economy because rate hikes take time to work their way through the economy. With the Fed focused on backward looking data, it introduces a risk that financial conditions will tighten too much and the potential for overtightening diminishes the probability of a soft landing. At the very least, it appears likely that the economy will slow throughout 2023. Growth may even turn negative, thrusting the economy into recession. If there is any good news that investors can take from the Fed’s quick action to this point is that we are likely closer to the end of tightening conditions than we were just a short six months ago.

Slipping Into Darkness

The economy is still reasonably strong by many measures but cracks are starting to form in the foundation, and housing could be leading the way. Housing is an important sector for the economy and it makes up 15-18% of GDP on average. Recently released data showed that during July housing prices experienced their first monthly decline since January 2019. It should come as no surprise that housing has shown signs of slowing as mortgage rates have climbed throughout 2022 and this his had a severe impact on home affordability. According to the US NAR Homebuyer Affordabilty Index, the monthly payment on a median priced single family home ($410,600) went from $1,011 in January of 2021 to $1,933 at the end of June 2022. Mortage rates were up another 1% from June through September so this payment will be even higher when the August and September data is released, with the montly payment on a median home having more than doubled in less than two years. Builders have started to report increasing cancellations and inventory has risen . It is only a matter of time until this data starts to filter through to lower home prices and ultimately to lower GDP.

We have also begun to see earnings revisions in other cyclically sensitive portions of the economy with companies in the chemical and semiconductor industries pointing to slowing demand, especially out of Europe. Retailers like Nike have reported bloated inventories and aggressive promotions. Large stalwart companies like Walmart and Amazon are slowing or altogether pausing hiring. It is too early to tell for sure but the negative data points are piling up, and we do not view these as the signs of a soft landing. We do not necessarily believe a severe recession is the base case but it is becoming more likely that the economy will slip into a recession at some point in 2023 or 2024.

What’s Ahead for Credit?

The good news is that the vast majority of the investment grade universe has balance sheets that will hold up reasonably well in a scenario where the economy experiences a modest recession. Investment grade companies were busy in 2020 and 2021, issuing debt at record low interest rates, decreasing their interest expense burdens and pushing out maturity walls. Most companies do not need to issue new debt to fund capital budgeting projects or to refinance existing debt balances. Cash balances have declined from their 2021 peak but remain elevated by historical standards. Interest coverage ratios are near a 13-year high. We are seeing some deterioration: revenue and earnings are slowing and for some companies profit margins are deteriorating, but these are coming off of very high levels.  Many investment grade companies have multiple levers to pull in the face of a slowing economy and they have shown a willingness to make conservative choices with regard to capital budgeting and share buybacks.  Credit fundamentals remain strong and point to our aforementioned narrative that the selloff in credit during 2022 has been much more about interest rates than it has been about creditworthiness.

As far as spreads are concerned, the OAS on the index recently hit a year-to-date wide of 164 on September 29. If there is a modest recession then spreads could trade out to 200 and they could temporarily trade even wider in a severe recession or in the event that we get an exogenous shock to the markets but investors are being reasonably well compensated from a yield perspective. The yield on the Corporate Bond Index finished the quarter at 5.69%, which provides some cushion against the potential for wider spreads.

Keep on Trucking

The volatility in the market has presented a real opportunity for investors. Yields have risen and investors do not need to be nearly as creative in their quest to generate income. Investment grade credit is a straightforward, easily understood, asset class. Due diligence and credit research are required to identify the companies that have the best creditworthiness and from there a manager can determine opportunities in the market based on their own measure of risk and reward. We are no longer in an environment of ultralow interest rates and tight credit spreads where investors may feel compelled to consider increasingly complex asset classes or products in order to generate income. Investment grade companies, by and large, will not have difficulty navigating a recessionary environment. Spreads could go wider and Treasury yields could even retest the high end of their range but the market has cheapened so much in such a short period of time that it is hard to ignore the level of compensation that is offered by the asset class. We think that investors that stay the course will be rewarded over a longer time horizon.

We thank you for your business and your continued interest. We look forward to hearing from you to discuss the credit markets and to help with any questions you may have.

This information is intended solely to report on investment strategies identified by Cincinnati Asset Management. Opinions and estimates offered constitute our judgment and are subject to change without notice, as are statements of financial market trends, which are based on current market conditions. This material is not intended as an offer or solicitation to buy, hold or sell any financial instrument. Fixed income securities may be sensitive to prevailing interest rates. When rates rise the value generally declines. Past performance is not a guarantee of future results. Gross of advisory fee performance does not reflect the deduction of investment advisory fees. Our advisory fees are disclosed in Form ADV Part 2A. Accounts managed through brokerage firm programs usually will include additional fees. Returns are calculated monthly in U.S. dollars and include reinvestment of dividends and interest. The index is unmanaged and does not take into account fees, expenses, and transaction costs. It is shown for comparative purposes and is based on information generally available to the public from sources believed to be reliable. No representation is made to its accuracy or completeness.

The information provided in this report should not be considered a recommendation to purchase or sell any particular security. There is no assurance that any securities discussed herein will remain in an account’s portfolio at the time you receive this report or that securities sold have not been repurchased. The securities discussed do not represent an account’s entire portfolio and in the aggregate may represent only a small percentage of an account’s portfolio holdings. It should not be assumed that any of the securities transactions or holdings discussed were or will prove to be profitable, or that the investment decisions we make in the future will be profitable or will equal the investment performance of the securities discussed herein.

i St. Louis Fed, 2022, “10‐Year Treasury Constant Maturity Minus 2‐Year Treasury Constant Maturity”
ii National Association of Homebuilders, 2022, “Housing’s Contribution to Gross Domestic Product” https://www.nahb.org/newsand‐
economics/housing‐economics/housings‐economic‐impact/housings‐contribution‐to‐gross‐domestic‐product
iii The Wall Street Journal, September 27 2022, “Home Pries Suffer First Monthly Decline in Years”
iv Bloomberg, August 9 2022, “Builders Are Stuck With Too Many Houses as US Buyers Pull Back”
v The Wall Street Journal, September 29 2022, “Micron Issues Another Muted Outlook After Missing Expected Sales Results”
vi Barron’s, September 16 2022, “Huntsman Falls Sharply After Cutting Profit Forecast”
vii Charged Retail Tech News, October 4 2022, “Nike is Aggressively Offloading Inventory Before the Holiday Season”
viii The Wall Street Journal, September 22 2022, “Walmart to Slow Holiday Hiring”
ix The New York Times, October 4 2022, “Amazon Freezes Corporate Hiring in Its Retail Business”
x J.P. Morgan North America Corporate Research , September 8, 2022, “HG Credit Fundamentals: 2Q 2022 Review”

09 Jul 2022

2022 Q2 Investment Grade Quarterly

The second quarter was another extraordinarily difficult period of performance for investment grade corporate credit. Treasury yields continued to march higher and credit spreads moved wider. The option adjusted spread (OAS) on the Bloomberg US Corporate Bond Index widened by 39 basis points to 155 after having opened the quarter at an OAS of 116. The 10yr Treasury opened the quarter at 2.34% and finished 67 basis points higher, at 3.01%. The 5yr Treasury opened the quarter at 2.46% and finished 58 basis points higher, at 3.04%. The 2yr Treasury opened the quarter at 2.33% and finished 62 basis points higher, at 2.95%. Some sections of the Treasury curve were inverted throughout the quarter which historically has been one of the leading indicators of a recession.

The Corporate Index posted a second quarter total return of –7.26%. CAM’s Investment Grade portfolio net of fees total return for the second quarter was –6.02%.

As much as it pains us and our investors to experience consecutive quarters of negative performance, not all hope is lost for investment grade returns in the future. The asset class has seen a meaningful drawdown and overwhelming negative sentiment has been priced into current valuations in our view. Higher Treasury yields and wider spreads have left investors with a much larger margin of safety in the asset class than there has been at any point in the past decade. We will discuss our views on where the market could go from here in the ensuing sections of this letter.

Is The Worst Over?

We have just endured a historically poor period of performance. The past two quarters were 2 of the 3 worst quarters in the history of the investment grade credit market and represent the worst 6 month performance period for the asset class. Looking at the bigger picture–we are talking about a brief time period of only six months. This asset class is not one that lends itself to tactical positioning and is more appropriate to view through the lens of a longer time horizon. That is why we tell our investors that a minimum time horizon of 3 to 5 years is needed to give our strategy the best chance of success. This is because the lynchpin of our strategy involves the intermediate Treasury and corporate credit curves. We typically purchase securities that mature in 8-10 years and look to sell those securities when they have 4-5 years left to maturity, redeploying those proceeds into attractive opportunities back further out the curve in the 8-10yr space. As bonds “roll down the curve” the bond math acts like water, finding its lowest level. All else being equal with rates and spreads, the price of a bond will move closer to par with each passing day of its existence. Bonds that have declined in value will start to recover with the passage of time as the time to maturity shortens.

As we mentioned in the opening section of this letter, the compensation afforded for credit spread and the underlying Treasury is much more than it has been in recent history. The index closed the second quarter at a spread of 155 relative to the 10yr average spread of 126. To provide some context on the rate of change over the course of the past year, on June 30 2021, the index closed at a spread of 80, which was its lowest level at any point in the past decade. As far as yield to maturity is concerned, the yield on the index was 4.71% at the end of the second quarter while the 10yr average was 3.09%. The index recently closed with its highest yield at any point in the past decade on June 14 2022, when it finished the day at 4.99%.

Now, we often caution against market timing and quite frankly we were wrong about valuations at the end of the first quarter because we thought they were relatively attractive at that point in time. Our valuation thesis crumbled throughout the second quarter while we watched rates continue to move higher and spreads traded wider due to macroeconomic concerns. This brings us to the question–can things get worse from here with higher rates and wider spreads? Absolutely, it could happen, and of course the opposite could come true as well and the market could see positive performance. What will happen over the short term is merely a guess. From a longer term point of view what we do know is that there is no denying that there is substantially more room for error for investors in investment grade corporate credit than there has been in a long time. We believe the Band-Aid has been ripped off at this point and that going forward we are much less likely to see a repeat of the eye watering negative returns that we saw in the first two quarters. Instead, we think the level of compensation afforded today sets up well for the potential to drive positive total returns for IG credit in the future over the medium and longer term.

Credit Conditions

Credit conditions for the investment grade universe remain strong, especially for the mostly highly rated companies, but conditions have declined so far this year and at this point it is clear that year-end-2021 was the peak for credit conditions in this cycle. Major factors that have led to the decline are higher borrowing costs due to rising interest rates and wider spreads. Inflationary pressures have also started to squeeze profit margins as companies are not able to pass the entirety of rising costs on to their customers. Inventory build and discounting have started to appear in some pockets of retail. Consumer confidence has slipped which historically has been a leading indicator of a slowdown in consumer spending.

Credit investors have begun to tread with caution as the majority of economists now expect a recession by the end of 2023.i The new issue market has slowed substantially in recent weeks amid volatility across risk assets. The market remains open for borrowers but investors are now demanding larger new issue concessions. This can present opportunities for bond investors as even very strongly capitalized highly rated companies will be forced to pay attractive new issue concessions in the current environment. This means higher coupons for investors. The key for a bond investor is to resist the temptation of the optically high yields offered by those companies that don’t have good balance sheets or those that trade at levels that do not offer adequate compensation for the risk. We are at a fairly interesting crossroads in the market where the prudently capitalized companies in the IG universe do not find themselves in a position where they “need” to borrow and we believe many of the companies that we follow would have likely issued new debt recently but simply decided not to because they don’t need the capital and more expensive borrowing costs have made raising new debt less attractive. On the other side of the coin are those companies that engaged in M&A or debt funded capital projects or shareholder rewards prior to the increase in borrowing costs. These CFOs and treasurers find themselves in the unenviable position of needing to borrow in a volatile market and trying to best gauge when to issue bonds. Some of these companies will be required to pay outsized new issue concessions in order to complete their bond offerings. Again, this could mean opportunity in select credits but some of the new deals simply won’t be cheap enough to offer adequate compensation for the risk. So what we find ourselves with today is a market that is highly bifurcated. For the vast majority of IG-rated companies, liquidity and cash on balance sheet remains near all-time highs and leverage is at very reasonable levels. For some other companies, they might have too much debt and the business and balance sheet are subsequently poorly positioned for an economic slowdown. In a recession scenario, many of the well capitalized companies will see margins contract and could see sales decline–but their balance sheets are in good shape and they are not over-levered so they will navigate a downturn just fine and easily make good on their commitment to pay bondholders while keeping their current credit ratings. For those companies that have too much debt and are also faced with declining revenues and profits –it could be a bumpy road during an economic slowdown and there will likely be some companies that see their bonds downgraded to junk. It is our job to manage the credit risk of the portfolio and avoid companies that are at risk of seeing their credit metrics decline precipitously. In a recession scenario, due to the strength of the highly rated, well capitalized portion of the investment grade universe, we believe investment grade credit will perform better than most other asset classes.

Portfolio Positioning

As an active manager we have been able to make what we felt were many opportunistic trades amid the market volatility of the past few weeks. To be clear, we will never make wholesale changes to our strategy but we will always tinker at the margins depending on the environment in our market at any given time. The Holy Grail for bond performance has three tenets –decrease maturity, increase yield and increase or maintain credit quality. If a manager can affect a trade that accomplishes all three, then it is likely to be successful over time. Currently, the biggest change to our management style is that the dislocation in the market has created opportunities for us to buy shorter maturities than we typically would. Intermediate Treasury curves were flat or inverted throughout most of the second quarter, depending on the day. The corporate credit curve still has a level of steepness but due to the nature of the way that the bond market trades–over the counter, price discovery and no exchange like equities, it can create attractive scenarios where a manager is able to buy shorter duration bonds of an issuer at levels that are more attractive than the longer bonds–a situation that should not exist in an efficient market–but the bond market is not always efficient. We have been able to populate investor portfolios with many more bonds that mature in 7 or 8 years (or even less in some cases) whereas in more normalized periods with steeper Treasury and corporate credit curves the math would favor 9-10 year bonds. All else being equal, a shorter maturity means less interest rate and credit risk for our investors. Note that we will always stick to our mandate of intermediate maturities.

In addition to being able to position more conservatively from a duration standpoint, we are also being cautious with credit risk. Credit health is still quite good for many issuers even if some companies have begun to experience a slight decline in margins and profitability. At the moment we are avoiding more cyclical credits in favor of stability. As investors have started to factor in the increasing probability of a recession, the spread gap between lower rated and higher rated credit has grown, and lower rated has performed relatively worse. We see select opportunities in BAA-rated credit but continue to limit our exposure to 30% of investor portfolios while the index was 49.53% BAA-rated at the end of the second quarter. We will not be increasing our weighting to riskier credit and our preference for lower rated credits at the moment is limited to those companies that have stable or improving credit metrics or those that are in the process of deleveraging. As far as A-rated companies are concerned, they will continue to make up approximately 70% of investor portfolios and we are favoring industries like utilities and highly rated energy companies. We also like non-discretionary healthcare and technology companies that will continue to grow earnings regardless of the economic environment. We believe that the risk of recession has increased substantially and are looking to populate portfolios with companies that can navigate an environment of negative growth with little impact to credit worthiness.

Hawks & Doves

During the second quarter the Federal Reserve made it abundantly clear that they were focused on conquering inflation as they delivered a 50bps hike in May followed by a 75bps hike in June. The next FOMC rate decision is July 27 and Chairman Powell has messaged that 50-75bps will be on the menu, depending on the economic data over the course of the next few weeks. Recent economic data has indicated an increasing possibility of a slowing economy and traders are now pricing in 50bps of rate cuts in 2023. Current projections foresee a peak for Fed Funds of ~3.3% in early 2023 up from 1.75% today with a prediction that the benchmark rate will be 2.7% at year-end 2023.ii What this means is that traders are predicting a recession by mid-2023 as that would be the catalyst for a rate cut in the second half of next year. Inflation is not a problem unique to the U.S. and a myriad of central banks have joined the Fed in the quest to quell rising prices. Australia, Canada, New Zealand and Switzerland have raised their policy rates in recent weeks and even the reticent ECB has signaled a series of rate hikes that will begin in July.iii As a result, the amount of global negative yielding debt has tumbled from nearly $17 trillion in August of 2021 to just over $2 trillion at the end of the second quarter. The Bank of Japan is the only major central bank that has resisted tightening financial conditions.

Our job is to manage credit risk, not to speculate on rates or try and predict the Fed’s next move. That doesn’t mean we don’t care, just that our time is better spent on studying individual companies and their creditworthiness and not trying to predict the next move of a central bank as it is very much a game of chance. What we do know is that the economic data that the Fed uses to guide its policy decisions is backward looking in nature, not forward looking. Regardless of how much the Fed raises its policy rate, it seems likely that it will do so until it overshoots, finding itself in a situation where it raises the policy rate during the early stages of a U.S. recession. In other words, the Fed will be hawkish until it isn’t, and it will continue to tighten financial conditions until inflation is no longer a problem. What does this mean for credit? If there is a recession it could mean wider credit spreads. We plan to position the portfolio accordingly and with the type of companies that can weather an economic downturn.

Making the Turn

We are more than halfway through 2022 and there are more risks for credit today than when we started the year. The good news is that much of this bad news has been priced into valuations. This has created opportunity in our view but we will continue to be diligent and screen each of our investments carefully. Now is not the time to reach for yield, but to invest in the bonds of those companies that are well positioned and allocate capital in a creditor-friendly manner. We will be doing our very best to pick those investments that have the best chance to generate positive returns for our investors. We thank you for your patience during this turbulent time. As always we encourage you to contact us with questions. Thank you for your interest and partnership.

This information is intended solely to report on investment strategies identified by Cincinnati Asset Management. Opinions and estimates offered constitute our judgment and are subject to change without notice, as are statements of financial market trends, which are based on current market conditions. This material is not intended as an offer or solicitation to buy, hold or sell any financial instrument. Fixed income securities may be sensitive to prevailing interest rates. When rates rise the value generally declines. Past performance is not a guarantee of future results. Gross of advisory fee performance does not reflect the deduction of investment advisory fees. Our advisory fees are disclosed in Form ADV Part 2A. Accounts managed through brokerage firm programs usually will include additional fees. Returns are calculated monthly in U.S. dollars and include reinvestment of dividends and interest. The index is unmanaged and does not take into account fees, expenses, and transaction costs. It is shown for comparative purposes and is based on information generally available to the public from sources believed to be reliable. No representation is made to its accuracy or completeness.
The information provided in this report should not be considered a recommendation to purchase or sell any particular security. There is no assurance that any securities discussed herein will remain in an account’s portfolio at the time you receive this report or that securities sold have not been repurchased. The securities discussed do not represent an account’s entire portfolio and in the aggregate may represent only a small percentage of an account’s portfolio holdings. It should not be assumed that any of the securities transactions or holdings discussed were or will prove to be profitable, or that the investment decisions we make in the future will be profitable or will equal the investment performance of the securities discussed herein.

i Fortune, June 13 2022, “Over two thirds of economists believe a recession is likely to hit in 2023”
ii Bloomberg, July 5 2022, “Traders looking to get ahead of Fed again foresee rate cuts”
iii Reuters, June 10 2022, “Central banks double down in fight against ‘galloping’ inflation”

11 Apr 2022

2022 Q1 Investment Grade Quarterly

It was an extremely painful start to the year for credit markets as performance suffered due to wider spreads and higher interest rates. During the first quarter, the option adjusted spread (OAS) on the Bloomberg US Corporate Bond Index widened by 24 basis points to 116 after having opened the year at an OAS of 92. Interest rates finished the first quarter higher across the board. The 10yr Treasury opened the quarter at 1.51% and closed 83 basis points higher, at 2.34%. The move in the 5yr Treasury was even more dramatic as it rocketed higher by 120 basis points, from 1.26% to 2.46%. The 2yr Treasury saw the most movement of all with a 160 basis point increase from 0.73% to 2.33%. The extreme move higher in interest rates led to negative returns for fixed income products across the board. The Corporate Index posted a quarterly total return of ‐7.69%, its second worst quarterly return in history. The only quarter that was worse than this one was the 3rd quarter of 2008 in the midst of the Great Recession when the index posted a quarterly return of ‐7.80%. CAM’s net of fees 1st quarter total return was ‐6.75%.

You own bonds, now what?

 Is now the time to panic? While we are certainly disappointed with short term negative performance we believe investors that are committed to the asset class will be rewarded over a longer time horizon. The thesis for owning investment grade credit as part of an overall diversified portfolio has not changed. Investors look to highly rated corporate bonds for diversification, income, and to decrease the volatility of their overall portfolio. While higher Treasury yields have led to negative performance for the past quarter it has also led to opportunity with investment grade yields that are now at their highest levels since the spring of 2019. Higher yields mean that newly issued corporate bonds will have larger coupons and more income generation.

For those who may view recent returns as a signal to either enter or exit certain asset classes, we would caution against such an attempt at market timing that currently might lead one to exit the investment grade corporate bond market. This is especially true when credit conditions are strong and the loss of value that occurred during the quarter was almost entirely driven by interest rates and not by the general creditworthiness of the investment grade universe. It is important to remember that bonds are a contractual obligation by the issuer – the bonds will continue to inch closer to maturity and pay coupons along the way. An investor who has seen a bond decrease in value will recapture some portion of that value over time in the form of coupon payments and an increase in principal value as the bond rolls down the yield curve toward maturity and its price converges toward par.

During the first quarter we experienced dramatically higher Treasury rates along with wider credit spreads. To put it into historical context, it was the second worst quarter for the Corporate Index since its inception in 1973. It is not easy to step in and buy here amid negative sentiment regarding the Fed and interest rates but we believe that is precisely what investors should be doing.

Credit Conditions

 The investment grade credit markets were in very good health at the end of the first quarter. The secondary market has been liquid and the primary market was fully functioning, even during the volatile period for risk assets that coincided with early days of Russia’s invasion of Ukraine. Cash on investment grade non‐financial firms’ balance sheets was at all‐time highs at the end of 2020 and 2021.i Leverage ratios for IG‐rated issuers spiked during the early innings of the pandemic but leverage has since come down substantially and is now below pre‐pandemic levels.ii In 2020, due to the early severity of the pandemic, there were $186bln in downgrades from investment grade to high yield. That trend reversed sharply in 2021 with just $7bln in downgrades during the entire year while there were $35bln in upgrades from HY to IG. 2022 will go down in history as the “year of the upgrade” and there were $31bln in upgrades during the first quarter of 2022 alone.

J.P. Morgan has identified an additional $230bln of HY‐rated debt that could make its way to investment grade by the end of 2022. There is a high probability that 2022 will shatter records for the most upgrades during a calendar year. As far as the new issue market is concerned, the numbers have been very strong. March was the 4th busiest month on record for the primary market with $229.9bln in volume. There was $453.4bln of new issuance through the end of the first quarter, which was 4% ahead of the pace set in 2021.iii In aggregate, the investment grade universe is strongly positioned from the standpoint of credit worthiness and access to capital. We believe this is supportive of credit spreads.

Inflation, Interest Rates, the Fed: Impact on Credit

 Inflation and interest rates are understandably a hot topic in our discussions with investors. Inflation is a problem, and headline PCE, which is the Fed’s preferred inflation gauge showed a year‐over‐year increase of

+6.4% for its February reading.iv Chairman Powell has responded with forceful rhetoric that the FOMC will do everything in its control to reign in price increases and the market has bought in. The consensus view is that inflation will slow throughout 2022. Along those same lines, it is widely anticipated that economic growth will slow throughout 2022 as well. At this point it seems likely that the Fed will raise its target rate by 50 basis points at its May and June meetings and then it could raise by 25 basis points in July, September, November and December. This is largely priced in at this point.v The risk with the Fed’s stance on inflation is that it could start to aggressively tighten monetary policy just as consumer spending begins to decline thus lighting the fire for a recession. History shows that it is very difficult for monetary policy to fight inflation and avoid a recession at the same time, thus the odds of a recession at some point over the next two years has increased substantially. Note that a recession simply means the economy has had two consecutive quarters of negative GDP growth –it is not a good thing, but a modest shallow recession does not necessarily mean economic disaster.

For credit, slower or negative growth likely means wider spreads but we would expect investment grade to outperform other risk assets in such a scenario. Investment grade balance sheet fundamentals are very strong and margins had been expanding until very recently and are near their peak. At some point, inflation will start to take a bite out of margins for some industries but in aggregate corporate credit is in very good health and well positioned to weather a storm. If the Fed manages to achieve its goal of a soft landing then that would be a scenario where risk assets perform reasonably well, but it could be accompanied by interest rates that inch higher from here, which would be a headwind for longer duration credit. An additional risk is that neither inflation nor economic growth decline in line with expectations throughout the rest of 2022; although we believe that this is the less likely of the two scenarios, it does remain a possibility that this path comes to fruition. If this happens then the Fed will have to become uber‐hawkish and may have no choice but to force the economy into recession to cool inflation.

What Does an Inverted Yield Curve Mean for Credit?

 As a reminder, at CAM we position client portfolios in intermediate maturities. We typically purchase bonds that mature in 8‐10 years and then allow those bonds to roll down the yield curve, holding them for 3‐5 years before we sell and redeploy the proceeds into another bond investment. We do this because the 5/10 portion of both the Treasury curve and the corporate credit curve have been historically typically steep relative to the other portions of both of those curves. We prefer a steep 5/10 Treasury curve but at the end of the 1st quarter that curve was ‐12 basis points. Our strategy still works when there is an inverted Treasury curve because there is a corporate credit curve that trades on top of the Treasury curve that classically steepens when the Treasury curve flattens resulting in extra compensation for incremental duration. See the below chart that compares the Treasury curve at quarter end against the corporate credit curves of two bond issuers:

Note that the curve for Charter is steeper than Progressive. This is typical given that Charter is a lower quality credit than Progressive; the curve should be steeper for incremental credit risk. Curves are moving all the time and change by the day or even by the hour. To provide some recent historical context, the 5/10 Treasury curve was 80+ basis points just one year ago, which was its steepest level at any time in the previous 5 years –things can change quickly. Corporate curves also vary by industry with fast changing industries like technology typically having steeper curves than stable more predictable industries. It is the constant monitoring of these curves and the subsequent implementation of trades where an active manager adds value to the bond investment management process.

There are a variety of reasons that Treasury curves invert but the main reason comes down to Federal Reserve policy and its impact on the front end of the Treasury curve. Increasing the Federal Funds Rate has a disproportionate impact on Treasuries that mature in 5 years or less and especially those that mature in 2 years. Longer term Treasuries like the 10yr are much more levered to investor expectations for economic growth and longer term inflation expectations. We would note that this Treasury curve inversion is still very fresh and corporate credit curves have steepened moderately in the meantime. Over time, if Treasuries remain inverted, we expect to see more steeping of corporate credit curves.

Looking Ahead

 It has been a tough start to the year but it is only April and there is still much to be written before we close the book on 2022. There are significant unknowns and risk factors that loom large as we navigate the rest of the year. The largest geopolitical uncertainty is the Russo‐Ukrainian War but China’s “zero‐Covid” policies are another risk that may not be fully appreciated by the markets as a slow‐down in China could have significant ramifications for global economic growth. Domestically, Federal Reserve policy is at the forefront and there are also mid‐term elections in the fall.

We believe higher Treasury yields and reasonable valuations for credit spreads along with healthy credit conditions for investment grade issuers have made the investment grade asset class as attractive as it has been in several years. The risk to our view is that Treasury yields could go even higher from here creating additional performance headwinds for credit.

We will be doing our best to navigate the credit markets in a successful manner the rest of this year and we appreciate the trust you have placed in us as a manager. Thank you for your business and please do not hesitate to contact us with any questions or comments.

This information is intended solely to report on investment strategies identified by Cincinnati Asset Management. Opinions and estimates offered constitute our judgment and are subject to change without notice, as are statements of financial market trends, which are based on current market conditions. This material is not intended as an offer or solicitation to buy, hold or sell any financial instrument. Fixed income securities may be sensitive to prevailing interest rates. When rates rise the value generally declines. Past performance is not a guarantee of future results. Gross of advisory fee performance does not reflect the deduction of investment advisory fees. Our advisory fees are disclosed in Form ADV Part 2A. Accounts managed through brokerage firm programs usually will include additional fees. Returns are calculated monthly in U.S. dollars and include reinvestment of dividends and interest. The index is unmanaged and does not take into account fees, expenses, and transaction costs. It is shown for comparative purposes and is based on information generally available to the public from sources believed to be reliable. No representation is made to its accuracy or completeness.

 The information provided in this report should not be considered a recommendation to purchase or sell any particular security. There is no assurance that any securities discussed herein will remain in an account’s portfolio at the time you receive this report or that securities sold have not been repurchased. The securities discussed do not represent an account’s entire portfolio and in the aggregate may represent only a small percentage of an account’s portfolio holdings. It should not be assumed that any of the securities transactions or holdings discussed were or will prove to be profitable, or that the investment decisions we make in the future will be profitable or will equal the investment performance of the securities discussed herein

i Goldman Sachs Global Investment Research, March 28 2022, “IG capital management: Deleveraging is the exception, not the rule”

ii Bloomberg, Factset, Goldman Sachs Global Investment Research

iii Bloomberg, March 31 2022, “IG ANALYSIS: Corebridge Debut Closes Out Record $230bln Month”

iv CNBC, April 1 2022, “The Fed’s preferred inflation gauge rose 5.4% in February, the highest since 1983”

v Bloomberg, March 14 2022, “Fed Traders Now Fully Pricing In Seven Standard Hikes for 2022”

11 Jan 2022

2021 Q4 Investment Grade Quarterly

Investment grade corporate credit spreads finished the year little changed. For the full year 2021, the option adjusted spread (OAS) on the Bloomberg US Corporate Bond Index tightened by 4 basis points to 92 after having opened the year at an OAS of 96. The 4th quarter saw more movement, with the spread on the index moving wider, opening the quarter at 84 and closing at 92.

Treasuries finished the 4th quarter nearly unchanged. The 10yr Treasury opened the 4th quarter at 1.49% and closed at 1.51%. There was much more movement within the full year number with the benchmark 10yr opening 2021 at 0.91% and closing as high as 1.74% at the end of the first quarter before receding into the close of the second quarter and then trading higher from there, closing the full year 60 basis points higher at 1.51%.

The Corporate Index eked out a positive return during the fourth quarter, posting a total return of +0.23%. This compares to CAM’s net 4th quarter total return of -0.30%.

For the full year 2021, although spreads were slightly tighter, it was not enough to offset the move higher in interest rates. The Corporate Index posted a full year total return of -1.04%. This compares to CAM’s net full year total return of -1.38%.

Few Things Worked in 2021
Broadly speaking it was a tough year for investment grade credit. The Long portion (10+ years to maturity) of the US Corporate Index underperformed the Intermediate portion by 13 basis points on the back of higher Treasury rates. The “risk-on” trade has been in full effect since mid-2020 and that theme continued in 2021 with lower quality IG credit outperforming higher quality during 2021.

Recall that CAM has a structural underweight in Baa-credit and targets a ceiling of 30% exposure to this riskier segment of the market while the index is >50% Baa-rated. CAM also targets an A rating for its client portfolios
while the index is rated A3/Baa1.

As far as individual sectors go, there were a couple winners. At the sector level, only Energy and the Other Industrial sectors posted positive total returns on the year, of +1.39% and +0.88%, respectively. While Energy represented a major sector with a 7.72% index weighting, Other Industrial is quite small and represented just 0.48% of the Corporate Index. As far as individual industries were concerned, those industries under the Energy umbrella led the way with Independent Energy, Oil Field Services, Refining and Midstream posting total returns of +1.60%, +2.45%, +2.48% and +2.46%, respectively. The best performing individual industry was Airlines with a +4.48% total return.

The sectors that posted the biggest losses were Utilities, Technology and Consumer Noncyclical with returns of -2.15%, -1.98% and -1.30%, respectively. It may seem counterintuitive but while these industries are some of the most stable, high quality was not in favor during 2021 and instead risk taking ruled the day. Outside of the various utility sub-industries, the worst performing individual industries were Tobacco and Cable & Satellite with returns of -2.32% and -2.12%, respectively.

A Year of Little Change
2021 was one of the least volatile years for IG credit—the index OAS traded in a range of just 21 basis points. To find a less volatile year we have to go all the way back to 2006 when the range was just 12 basis points.

Ironically, the low volatility of 2006 continued well into 2007, just prior to the two most chaotic years in the history of investment grade credit. Please note that we do not expect a repeat performance of this in 2022 given the exogenous factors that were in play back in 2008-2009. In fact we predict quite the opposite, and our opinion is that 2022 will be a year of spread stability similar to 2021. There have been sustained periods of time in the history of our market where spreads have traded at levels beneath or near 100, and barring a geopolitical crisis or unexpected shock to the global economy, we see little reason that spreads should move meaningfully over the course of the next year. They may move wider or they may move tighter but we feel pretty comfortable pegging a spread of 100 +/- 20bps type of valuation target for the end of 2022.

Predicting fund flows is always a difficult but, even after $323.8 billion of inflows during 2021 into IG credit, making it the second largest year on record, we expect demand to remain positive going into 2022i. After such a strong performance for equities in 2021, pension funds will continue to look to rebalance and demand from institutional investors both domestic and foreign should remain strong. Additionally, IG credit will likely benefit from “flattish” gross new issuance supply and most Wall Street prognosticators are predicting substantially less net new issue supply as the amount of debt that matures in 2022 is larger than what we have experienced in recent years. Less supply of new bonds creates a more supportive environment for credit spreads in the secondary market and for the market as a whole. One factor that could make a difference at the margin is the amount of high yield debt that is upgraded to investment grade during the course of the year. Current expectations are calling for a robust upgrade cycle in 2022 and these companies will often issue new debt when they achieve investment grade status. Past experience tells us that much of this debt ends up being “leverage neutral” as lower interest rate investment grade debt is used to retire higher interest rate legacy high yield debt. However, the debt is still net new for the investment grade market since these companies were previously part of the high yield market. If we experience even more upgrades than the upper limit of the rosiest predictions then that could make for higher new issue supply numbers within the IG market.

In our view, the biggest potential driver of benign spread volatility during 2022 is that the economy is likely to continue to grow at above average levels and that the typical investment grade company is in good health from a balance sheet perspective. The median real GDP forecast is predicting growth of +3.9% in 2022 which is solidly above trendii. Companies are still sitting on elevated cash balances but as we have written about in past commentaries this will not last forever. As we move into 2022, it becomes increasingly likely that this cash will start being deployed for shareholder returns and M&A will move to the forefront. 2022 is shaping up to be much more of a credit pickers market instead of a market that generically rewards all risk-taking.

The Return of Dispersion

We have seen erosion in the quality of the investment grade universe, especially over the course of the last dozen years. That data set below is representative of just the past 10 years but the trend really started to manifest itself at the end of 2008, when the Corporate Index was just 33.15% Baa-rated compared to today when it is north of 50%.

Since 2008, the proportion of Baa-rated credit has crept higher with each passing year. There is some noise in these numbers, given the wave of downgrades from investment grade to high yield that occurred in 2020 and that is precisely why the percentage of Baa-rated debt decreased from 2019-2020 –those companies exited the investment grade universe entirely and joined the high yield universe. So the IG universe increased its quality by subtraction, not by improving its credit metrics. Many of these companies that were downgraded to junk have since repaired their balance sheets and some will earn upgrades and will be returning to investment grade in 2022, boosting the number of lower rated IG companies by the end of the year. Additionally, there are a relatively large number of rising stars within the high yield ranks currently that were not previously rated IG, many of which will be earning upgrades throughout the year. Taking it altogether, there is a good chance that year end 2022 will mark a new high for the proportion of Baa-rated credit within the Corporate Bond Index.

The purpose of this example is not to show that all Baa-risk is bad, because that is not the case. Consistently, the worst performers in IG credit are those companies that move from Aa or A rated down to Baa. On the other hand, some of the best performing credits are those companies that are currently high yield or split rated (half high yield, half investment grade) with the potential to improve their credit metrics and earn a full investment grade rating. We believe that 2022 will offer opportunity, both in the form of identifying such companies and by avoiding those weakly positioned A-rated credits that will join the ranks of the growing Baa-rated cohort. This is one of the reasons that you will see us occasionally invest in companies with just one IG rating and up to 1 or 2 HY ratings. It is usually because we expect the company to become fully IG-rated and we want to take advantage of associated spread compression for our clients. We also do not hamper ourselves with “automatic sale” rules in the event that a current portfolio holding loses IG ratings by getting downgraded to HY. Instead we will rely on our credit research to determine if it makes sense to continue to hold the bonds of a downgraded company and if it has a chance to regain IG status over our investment time horizon. The Baa-universe is chock full companies with bonds that trade at unattractive valuations from a risk reward standpoint. We are looking to provide our clients with a return that is equal to or greater than the Corporate Index but we want to do so by incurring less volatility –hence our structural underweight of Baa-rated credit versus the index. At the end of the day the only way an investor can identify these opportunities is by blocking and tackling and good old fashioned credit work which is one of the cornerstones of our investment grade program and but one of the ways we will look to add value for our clients in the year ahead.

The Federal Reserve & The “I” Word

At its November meeting, the Fed signaled its intent to complete the tapering of its asset purchases by the end of June. However, the landscape had changed by the time the December 15 meeting came around, and in a move to combat rising inflation, the Fed accelerated its tapering timeline. The Fed now expects to finish its taper by the end of March which would create the potential for a Fed Funds rate hike as soon as its March 16 2022 meetingiii. With the end of tapering occurring in the near term, it will be quite interesting to hear the Fed’s plans for the central bank’s $8.76 trillion asset portfolio. Discussions are ongoing and will continue at the January 2022 FOMC meeting but Chairman Powell and other Fed officials have hinted that shrinking the asset portfolio could be another arrow in the quiver that it may use to rein in inflationiv. It could be that the Fed elects to play it very slow with increases in the Fed Funds Rate, instead relying on balance sheet reduction to slow the economy and cool inflation toward its long term target level of 2%. The Fed believes that inflation will slow in the second half of 2022 and this is in line with the consensus view of most economists. In short, we believe the Fed will use all the tools at its disposal to make this a reality even if it means they must use some measures to slow economic growth.

Wrap It Up
2022 is poised to be an interesting year for the credit markets. Although we don’t expect wild swings in the level of credit spreads there could be some pockets of rate-driven volatility at times throughout the year as the Fed embarks on its first tightening cycle since 2018. Inflation will remain at the forefront and time will tell if those pressures ease in the second half of the year. The pandemic enters its third year and geopolitical uncertainty looms as it pertains to Russian and the Ukraine, both of which could impact risk assets or spark a flight to quality. The case for Investment Grade as an asset class today is for its downside protection, diversification and income generation. The time will come when total returns move back to the forefront but it is hard to make an argument for more than coupon-like returns in the current environment. Investors with strategic goals and medium to long time horizons have recognized the benefits of a permanent allocation to IG credit.

We wish you a happy and healthy 2022. We will be doing our best to navigate the credit markets in a successful manner and we appreciate the trust you have placed in us as a manager of your hard earned capital. As always, thank you for your business and please do not hesitate to reach out to us with any questions or comments.

i Wells Fargo Securities, January 3 2022 “Credit Flows | Special FY 2021 Edition”
ii Bloomberg, January 3 2022 “US GDP Economic Forecast Real GDP (YoY%) (78 responses)
iii Federal Reserve Open Market Committee, December 15 2021 “Statement Release”
iv The Wall Street Journal, January 4 2022 “Fed Weights Proposals for Eventual Reduction in Bond Holding”

This information is intended solely to report on investment strategies identified by Cincinnati Asset Management. Opinions and estimates offered constitute our judgment and are subject to change without notice, as are statements of financial market trends, which are based on current market conditions. This material is not intended as an offer or solicitation to buy, hold or sell any financial instrument. Fixed income securities may be sensitive to prevailing interest rates. When rates rise the value generally declines. Past performance is not a guarantee of future results. Gross of advisory fee performance does not reflect the deduction of investment advisory fees. Our advisory fees are disclosed in Form ADV Part 2A. Accounts managed through brokerage firm programs usually will include additional fees. Returns are calculated monthly in U.S. dollars and include reinvestment of dividends and interest. The index is unmanaged and does not take into account fees, expenses, and transaction costs. It is shown for comparative purposes and is based on information generally available to the public from sources believed to be reliable. No representation is made to its accuracy or completeness.

15 Oct 2021

2021 Q3 Investment Grade Quarterly

Investment grade corporate credit finished the third quarter little changed from where it began the period. The option adjusted spread (OAS) on the Bloomberg Barclays US Corporate Bond Index ended the third quarter at 84 just modestly wider from where it started at a spread of 80.

Treasuries finished the quarter nearly unchanged as well. The 10yr Treasury opened the 3rd quarter at 1.47% and closed at 1.49%. There was some volatility along the way, as the benchmark rate closed as low as 1.17% near the beginning of August with much of its move higher coming in the last week of September.

It has been a relatively low volatility year for investment grade credit spreads with the Corporate Index having traded so far this year within its narrowest band since 2006, with a spread range of just 20 basis points. The index saw its tightest level when it closed at 80 the last day of June and its widest level of 100 in early March. For context, during the volatile year of 2020, the index saw a range of 280 basis points. The index traded in a range of 64 and 68 basis points in 2019 and 2020, respectively.

There are several reasons why we believe volatility has been subdued thus far in 2021. First, demand for investment grade credit as an asset class has been very strong which can be supportive of lower volatility and tighter credit spreads. According to data compiled by Wells Fargo Securities, there has been over $300bln in fund flows into investment grade credit through September 29.i A second reason we believe there has been less volatility is due to low net new issue supply. Gross supply has exceeded $1.1 trillion in 2021, the second busiest year on record.ii However, a closer examination of the numbers reveals that much of 2021’s supply has been for the replacement of existing higher cost debt. After subtracting tenders, refinancing and maturities, that $1.1 trillion gross supply figure gets whittled down to less than $300bln in net new issue supply through the end of the third quarter.iii Simply put, demand for credit has overwhelmed available supply. Finally, investment grade companies have strong balance sheets and high cash balances. Combining this strength with a yield starved environment and a “risk-on” sentiment has created a feeling among some investors that there is very little risk at the moment in IG credit and we believe this is the largest factor that has contributed to low volatility

Although most companies in IG credit are well positioned, this is an environment where investors need to tread especially lightly and do their homework on each individual company. Yes IG credit is generally in good or even great condition. Many companies issued debt during the worst of the pandemic because they wanted to shore up liquidity in the face of uncertainty. As a result, gross leverage is still elevated from pre-pandemic levels. Much of the cash that was borrowed is sitting idle on company balance sheets. As an additional consequence of the pandemic, there are scores of companies that paused share buybacks in 2020 or even dividends and have yet to resume them. There will be pressure from shareholders to resume these activities as well as additional shareholder remuneration. Management teams and boards have stockpiles of cash and may be tempted by ample M&A opportunities at some of the richest valuations the market has ever seen. It is important for a bond manager to identify those companies that are committed to maintaining or repairing the health of their balance sheets and to avoid those that will use excess liquidity for pursuits that are negative for bondholders. Shareholder rewards and M&A are fine as long as they are done within the confines of the balance sheet. It is when these activities rise to excess levels resulting in downgrades from A to BAA or from BAA to junk that it starts to impair total return potential for bondholders.

In a move that was largely expected at its September meeting the Federal Reserve said that it could start to reduce its $120 billion in monthly asset purchases as soon as its next scheduled meeting in early November. The tapering messaging has been deliberate and carefully crafted, and although there has not yet been a formal decision, Chairman Powell said that it would be a gradual process “that concludes around the middle of next year is likely to be appropriate.”iv
It has received much less press coverage but we would argue that the Fed began the tapering process back in July when it started selling down its corporate credit facilities. Recall that during the height of the crisis in March of 2020, the Fed went to extraordinary measures and began to purchase corporate bond ETFs as well as individual corporate bonds. The maximum size of the facility was $750bln, but at its peak the facility only grew to $14bln. The Fed quietly exited all of these positions by September 1 with no discernible market impact.v Clearly, the program was a success and it did much to reinstall confidence in the credit markets at a time when it was desperately needed.
As far as the federal funds rate is concerned, the September meeting was slightly more hawkish than expectations but again the message was clear that tapering will come first and any rate hikes will come thereafter. The committee was split on the timing of the first rate hike, with half of 18 Fed officials expecting at least one increase by the end of 2022 with additional increases forthcoming during 2023. We also expect that this will be a slow and steady process. The Fed Funds rate is a very short term interest rate and its impact is limited to the front end of the yield curve, while maturities further out the curve, like the 10yr and 30yr Treasury are much more impacted by the overall direction of the economy and inflation expectations. We think incremental increases in the Fed Funds rate are entirely manageable for corporate credit so long as the Fed keeps a watchful eye on the economy to prevent it from overheating.

We often receive questions from clients about our intermediate positioning, as our portfolios are typically invested in bonds that range from 5-10 years until maturity. A bond portfolio is generally seeking to accomplish four goals: income generation, preservation of capital, inflation protection and diversification. We believe positioning the portfolio within an intermediate maturity range helps to accomplish all of these goals but it is especially useful in limiting downside and preserving purchasing power. Intermediate maturities give the portfolio a chance to benefit if Treasury rates go lower but it also provides much more protection from rising interest rates than if the portfolio were invested in longer maturities 20 to 30 years out the curve. More importantly, it gives the portfolio a chance to generate a positive total return in environments where rates exhibit little movement, even if absolute yields are low like they are currently. The 5/10 curve is one of the most reliably steep portions of both the Treasury curve and the corporate credit curve, which is the spread that one is afforded for owning a corporate bond on top of a Treasury.

As you can see from the chart, the steepness afforded from the 5/10 portion of these curves is attractive relative to the longer portions. Take the corporate yield curve as an example (green). We get 91 basis points of additional yield by selling a bond at 5yrs and using the proceeds to buy a bond that matures in 10yrs. The way that bond math works, all else being equal, in a static rate and spread environment, we would collect 91 basis points of roll down from holding a generic investment grade corporate bond from 10yrs selling it at 5yrs. The mere 68 basis points of compensation afforded from extending from 10yrs to 30yrs pales in comparison to the intermediate positioning. The extension from 10/30 is also accompanied by substantially more interest rate risk.

Now let’s take a look at duration to provide some more context to this discussion. At September 30 2021, the modified duration of the Bloomberg Barclays US Corporate 5-10yr index was 6.47 and the OAS was 80. The modified duration of the US Corporate 10+yr index was 15.19 and the OAS was 122. One very basic measure of risk/reward we like to use is yield per unit of duration. In this instance we are receiving 12.4 basis points per year of duration if we invest in the 5-10yr index but only 8 basis points per year of duration if we invest in the 10+ portion of the index. Given the way that we at CAM view the world, by investing in the 10+ year portion of the index, we would be receiving significantly less compensation in exchange for more interest rate risk.

The big themes that will carry us into year-end are the ongoing pandemic, the domestic economy, China and the FOMC; on these topics there are more questions than answers at this point. Will the economy continue to recover or will new variants take the wind out of its sails? Will policy makers be able to offer targeted relief to those sectors of the economy that have not come close to recovering lost earnings without offering relief that is so broad that it leads to overheating? Will problems with China’s domestic economy lead to systemic issues for the global economy – for the record we think not –but could there be ramifications for certain industries? And finally, the FOMC’s November meeting looms large with the potential for an announcement on tapering asset purchases.
As we stated earlier in this missive, corporate credit is generally in solid shape but this is not a risk free asset class. Mistakes will be made by some management teams that become too aggressive amid an environment that is still rife with uncertainty and it is our job to do our best to avoid those issues for our client portfolios. We are still positioning our portfolio in a more defensive manner than the market as a whole and we do not see that changing in the near term. Please feel free to contact us with any comments, questions or concerns. Thank you for your business and continued interest.

This information is intended solely to report on investment strategies identified by Cincinnati Asset Management. Opinions and estimates offered constitute our judgment and are subject to change without notice, as are statements of financial market trends, which are based on current market conditions. This material is not intended as an offer or solicitation to buy, hold or sell any financial instrument. Fixed income securities may be sensitive to prevailing interest rates. When rates rise the value generally declines. Past performance is not a guarantee of future results. Gross of advisory fee performance does not reflect the deduction of investment advisory fees. Our advisory fees are disclosed in Form ADV Part 2A. Accounts managed through brokerage firm programs usually will include additional fees. Returns are calculated monthly in U.S. dollars and include reinvestment of dividends and interest. The index is unmanaged and does not take into account fees, expenses, and transaction costs. It is shown for comparative purposes and is based on information generally available to the public from sources believed to be reliable. No representation is made to its accuracy or completeness.

i Wells Fargo Securities, September 30 2021 “Credit Flows | Supply & Demand: 9/23-9/29”
ii Bloomberg, September 30 2021 “IG ANALYSIS: CNO FABN Debut Leads Docket; $90-$100bn October”
iii Credit Suisse, September 13 2021 “CS Credit Strategy Daily Comment”
iv The Wall Street Journal, September 22 2021 “Fed Tees Up taper and Signals Rate Rises Possible Next Year”
v Federal Reserve Statistical Release, September 2 2021 “H. 4. 1 statistical release”