Category: Investment Grade Quarterly

14 Jan 2025

Q4 COMMENTARY & 2025 OUTLOOK

January 2025

It was a solid year for investment grade credit as most companies were able to expand revenues while maintaining healthy balance sheets. These feats were accomplished largely thanks to a U.S. economy that continued to grow. Investment grade posted positive returns during the full year 2024, but the 4th quarter of the year was underwhelming as Treasury yields moved higher which weighed on returns.

2024 Year in Review

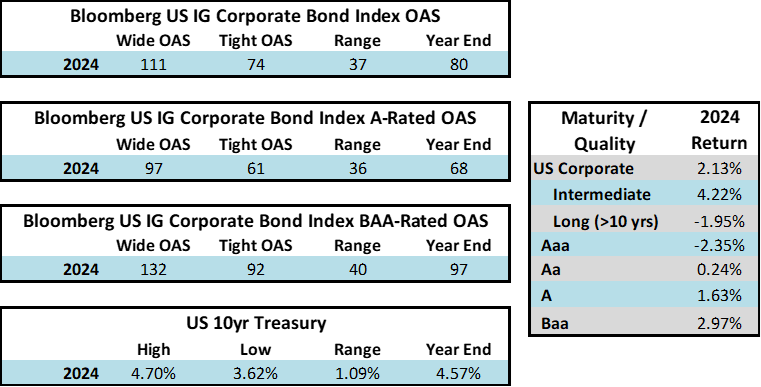
During 2024, the option adjusted spread (OAS) on the Bloomberg US Corporate Bond Index tightened by 19 basis points to 80 after it opened the year at a spread of 99. Lower quality portions of the investment grade universe outperformed higher quality, as investors reached for yield amid a historic level of spread tightening. Intermediate credit outperformed longer duration credit due to Treasury yields moving higher throughout the year.

Spread and coupon performance carried the day for corporate bonds in 2024. As bond investors we measure “excess return” as the total return of a corporate bond minus the total return of the underlying government bond. Excess return for the Corporate Index was +2.46% for the full year 2024, more than the total return for that Index of +2.13%. This means that the underlying Treasury performance was negative (due to Treasury yields moving higher) and that corporate bonds were able to overcome this and post positive total returns thanks to spread tightening and the higher coupon income that is available in corporate bonds relative to Treasuries. Suitability is unique to each investor but for investors than can tolerate a modest amount of credit risk, 2024’s performance shows that portfolios can benefit by placing a preference on actively managed IG corporate bonds relative to just Treasuries alone.

The best performing industries in 2024 were Airlines and Finance Companies. Railroads and Other Industrial were the two biggest underperformers relative to the Index. The majority of industries posted positive total returns for the full year with just a handful of negative performers.

Interest rates were volatile during 2024, particularly in the intermediate and shorter portions of the yield curve. The 10yr Treasury ended 2024 at 4.57% after opening the year at 3.88%. Looking at the front end of the curve, the 2yr Treasury finished the year at 4.24%, which was just one basis point lower than where it ended 2023; but that does not tell the whole story of just how volatile this security was during 2024. The 2yr traded above 5% at the end of April and then as low as 3.54% in the days following the Fed’s first rate cut in the latter half of September. The 2yr then climbed to 4.24% at year-end as traders began to acquiesce to the Fed’s messaging about a more cautious path of its easing cycle and the belief that rate cuts may play out over a longer time than initially anticipated. The 5yr Treasury finished the year 53bps higher than where it began, but it traded within a range of a whopping 132bps. The 5yr traded near its low of 3.40% just prior to the September Fed meeting before moving higher during the final 3 months of the year, finishing at 4.38%.

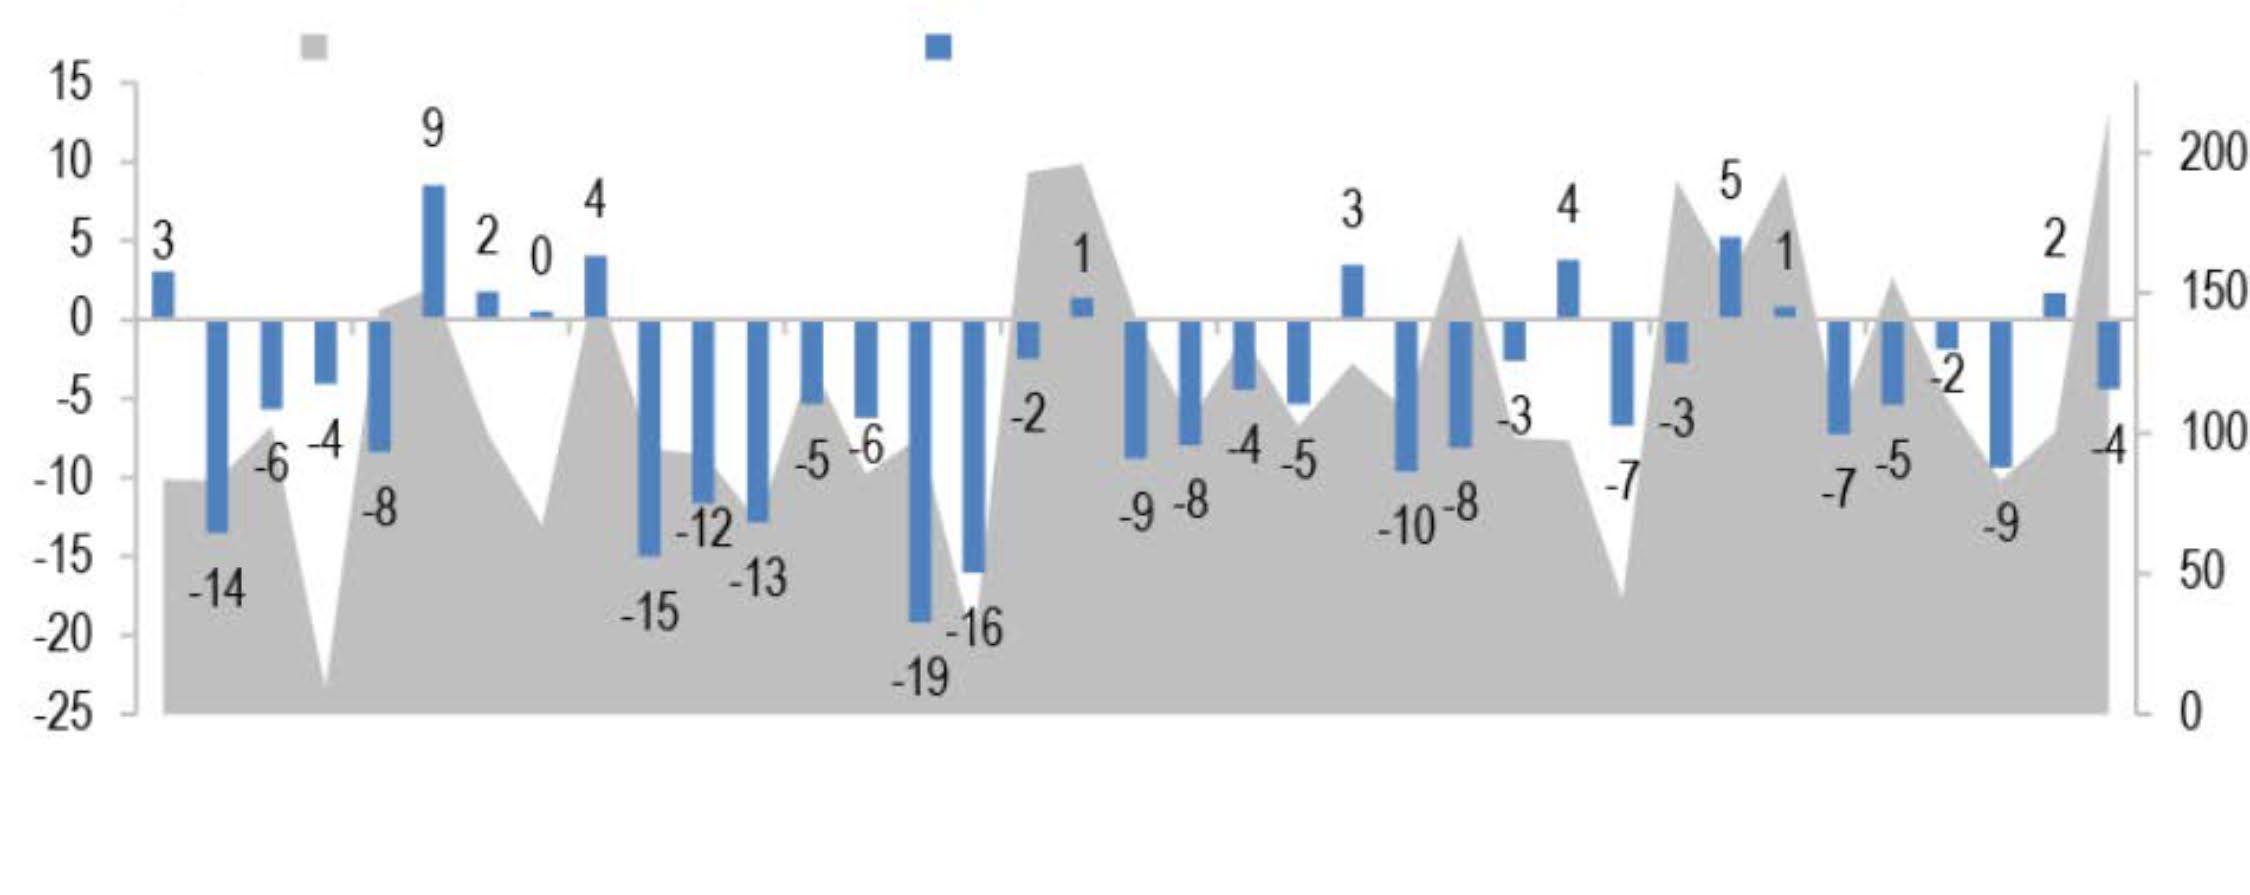
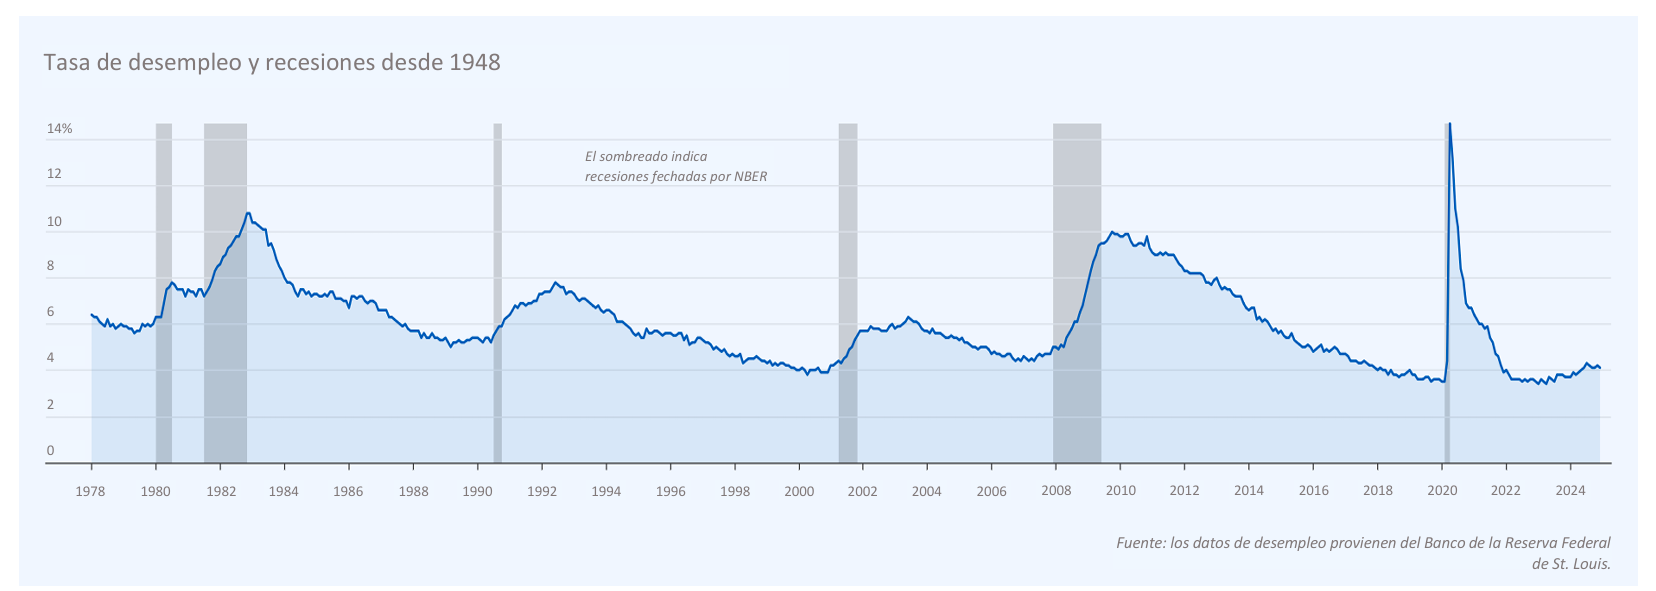
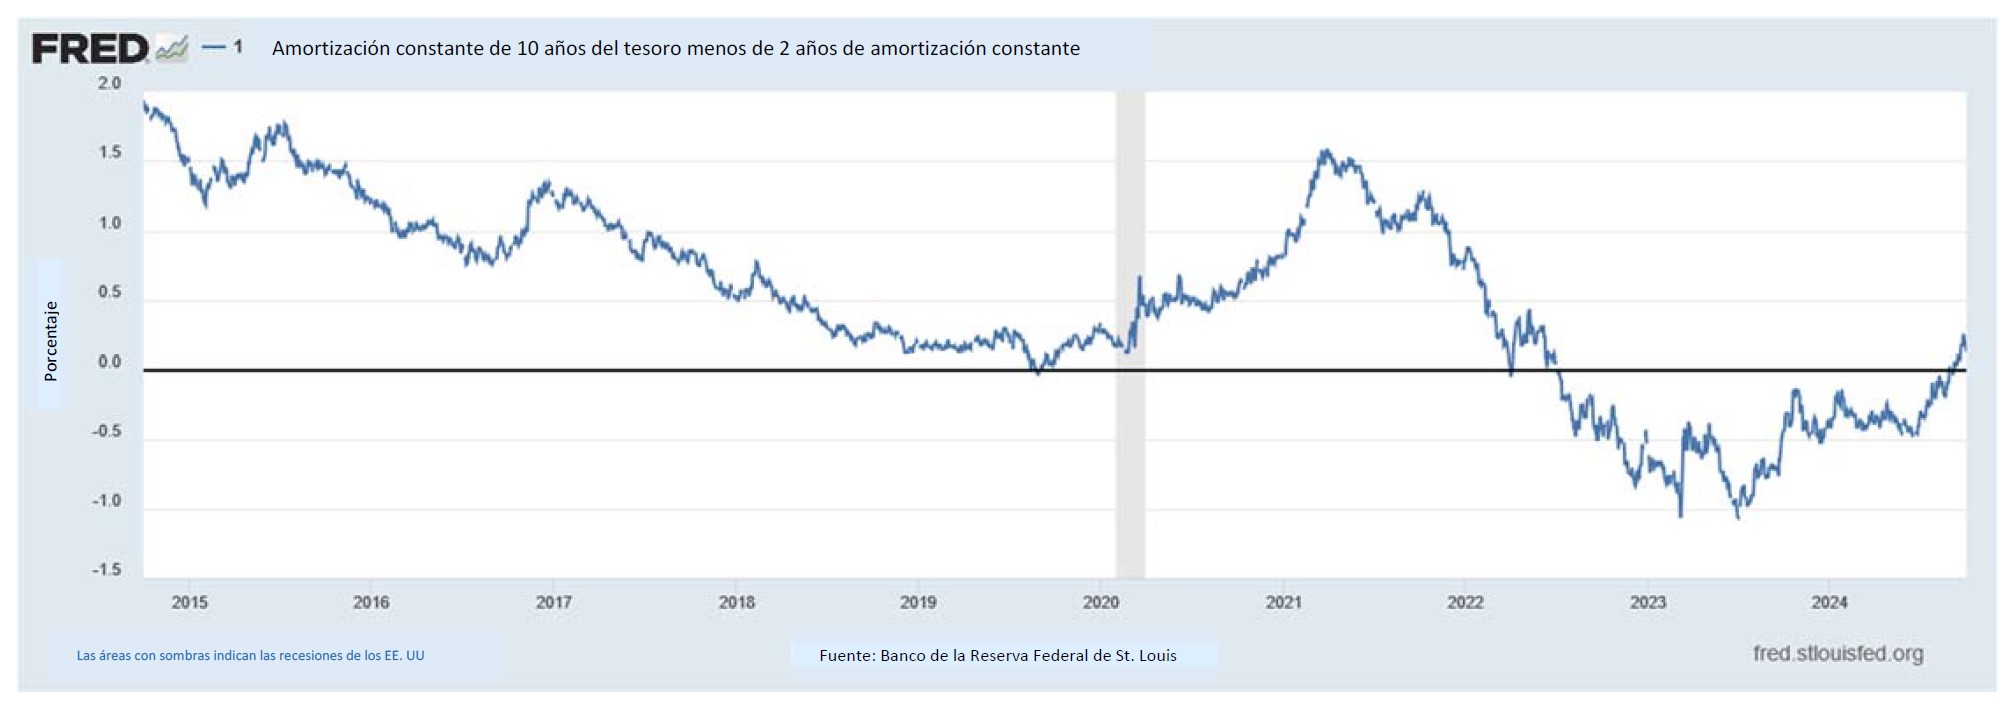
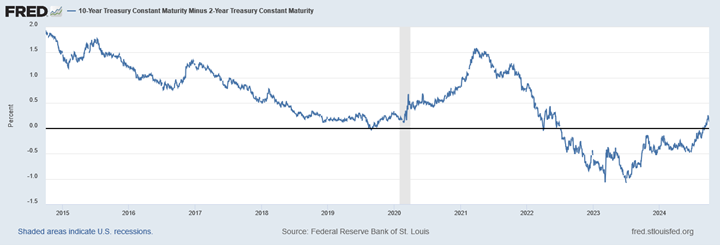
Looking at the two charts pictured above, the most important takeaway for investors and active bond mangers is the fact that the 2/10 Treasury curve ended its 793-day inversion streak in early September. The curve had been inverted since July of 2022 and this was the longest period of inversion on record. While 2/10 inversion has typically been a harbinger of recession, thus far the U.S. economy has managed to stay on solid footing. Only once previously has an inverted yield curve failed to precede a recession, during the brief period of inversions surrounding the Russian ruble crisis in 1998. A steep curve is helpful to active managers allowing them to effect economic sale-and-extension trades while also exposing investors to the power of curve rolldown and its ability to magnify returns.

2025 Outlook

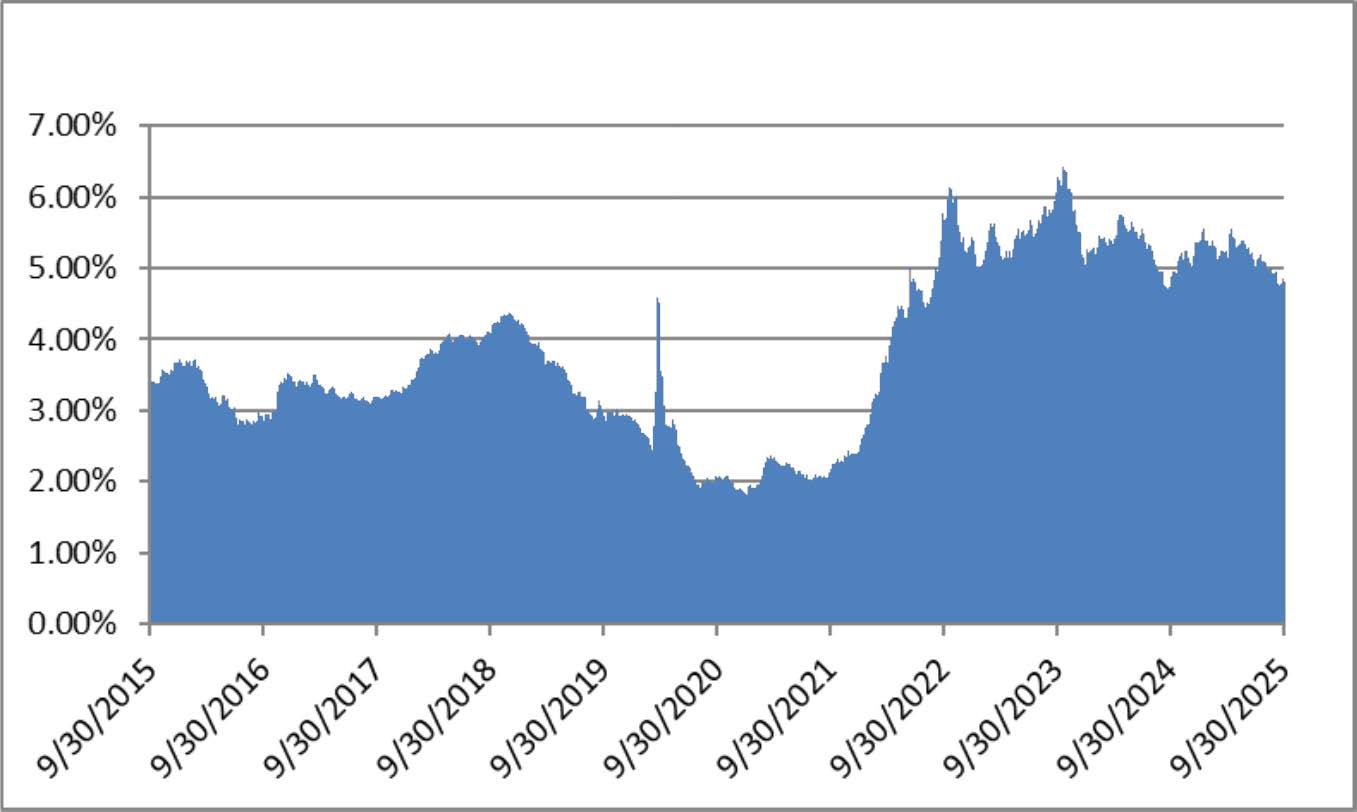
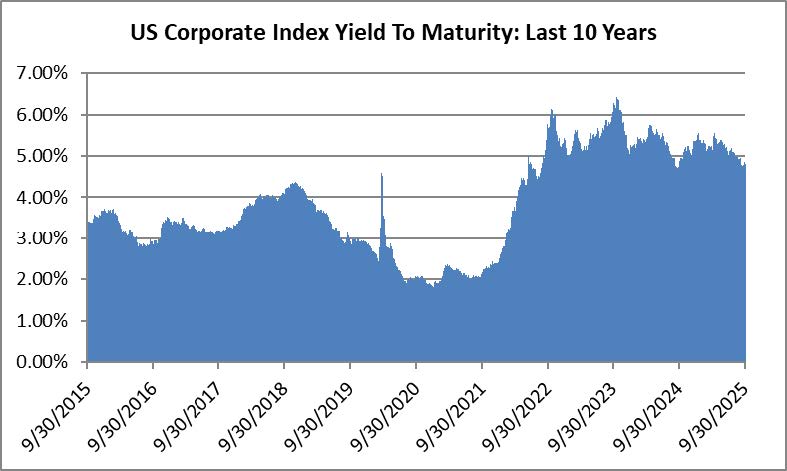
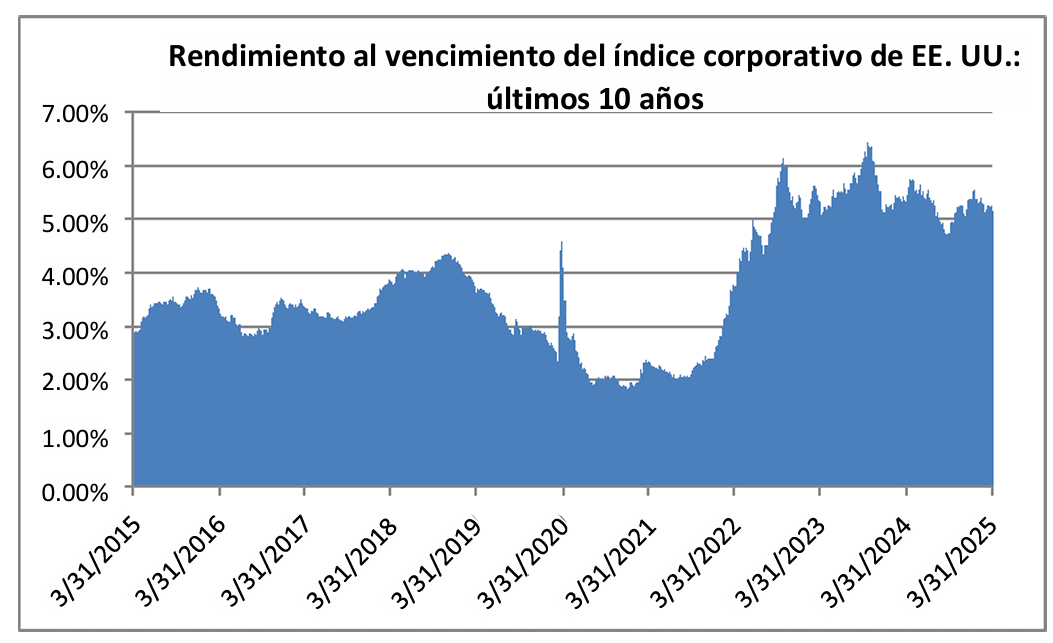
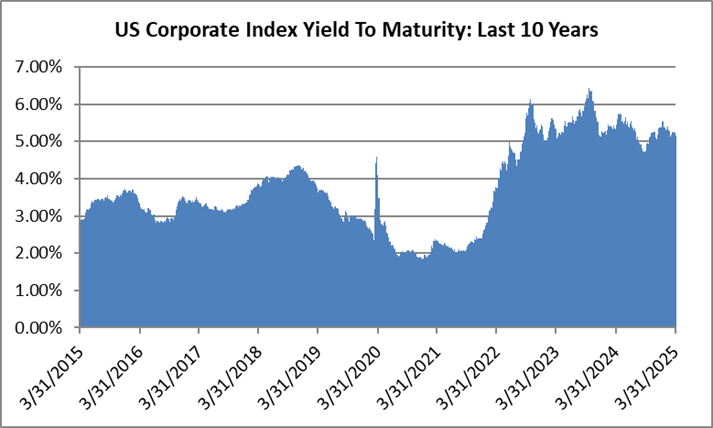
We have a favorable view of the potential for investment grade to generate attractive returns in the year ahead. The likelihood of additional spread compression is probably limited given the market is trading near the tight end of historical valuations. For us, much like we wrote at the end of 2023 and every quarter thereafter, it is the all-in yield that currently makes the asset class compelling on both an absolute and relative basis. The average yield on the Index over the past 10 years was 3.67% and it finished 2024 at 5.34%, which is higher from the end of 2023 when it was 5.06%.

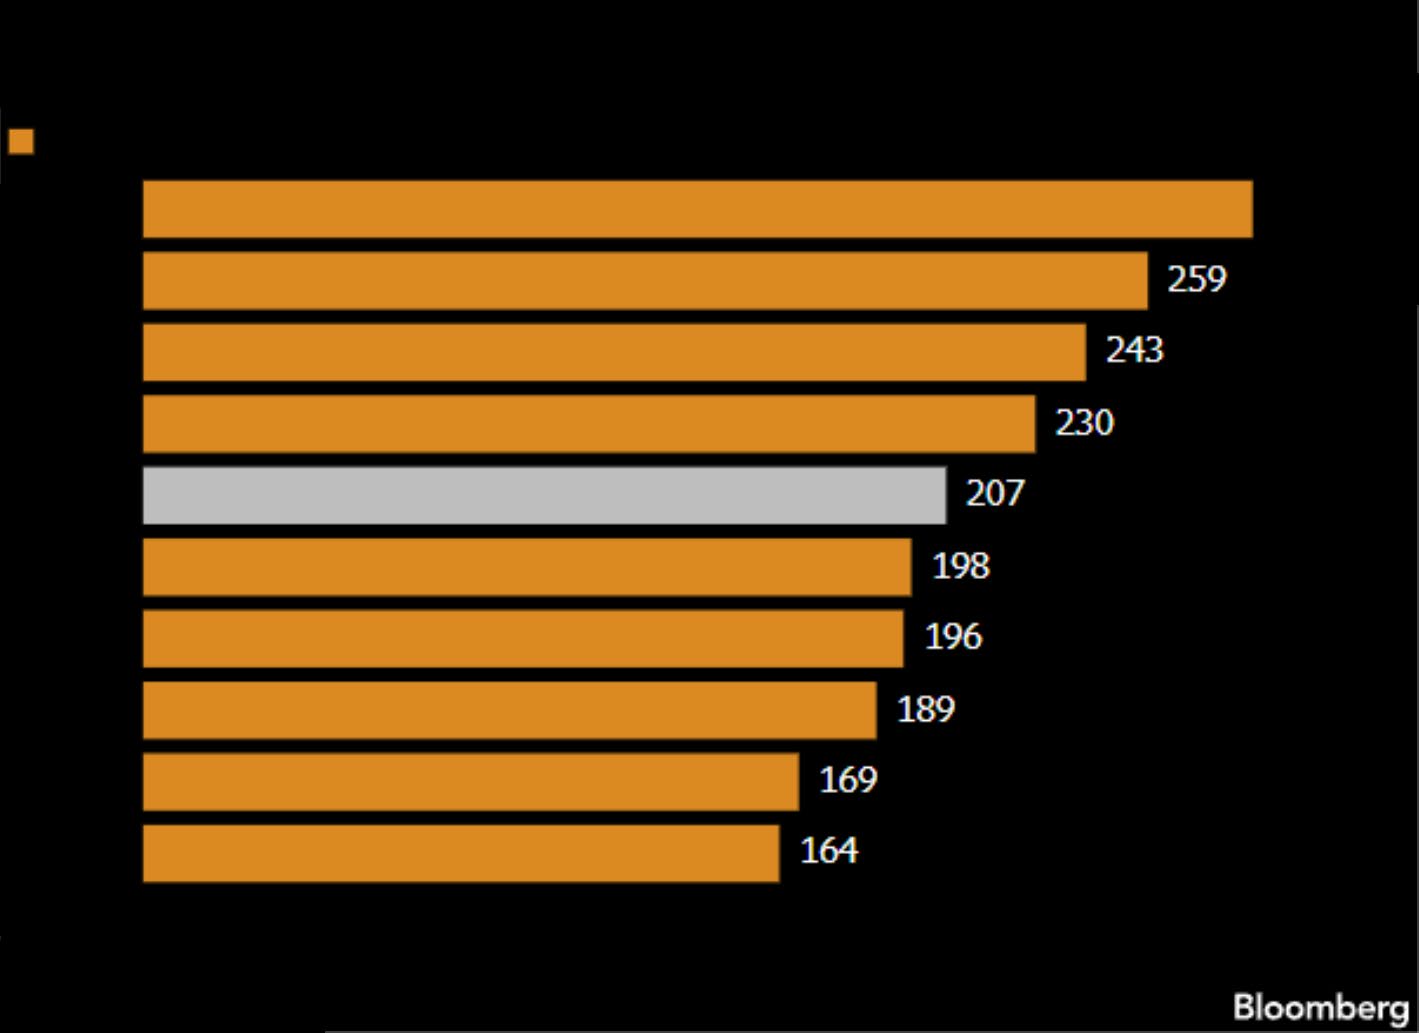
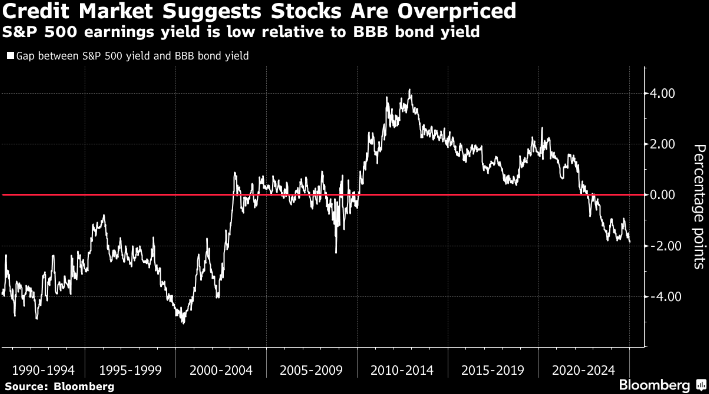
On a relative basis, by one metric, equities are at their most overvalued versus corporate credit and Treasuries since 2008. A recent Bloomberg study compared the earnings yield on S&P 500 shares (3.7%) to the yield to worst of the Bloomberg BAA Corporate Index (5.6%), finding a gap of 190 basis points as of January 6, 2025.1

The S&P 500 earnings yield is typically greater than the yield for corporate bonds to compensate investors for the additional risk associated with equities. It is worth noting that this is just one data point and this metric was negative for the entirety of the 1990s before turning positive in 2003. Still, we think that investors should take note of this development –high quality bonds screen cheap to other risk assets on a relative basis which suggests they may deserve a larger slice of an investor’s overall asset allocation.

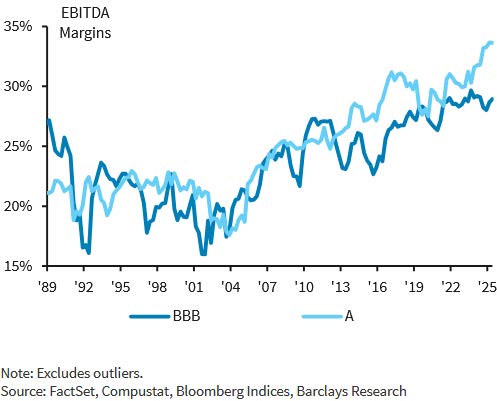
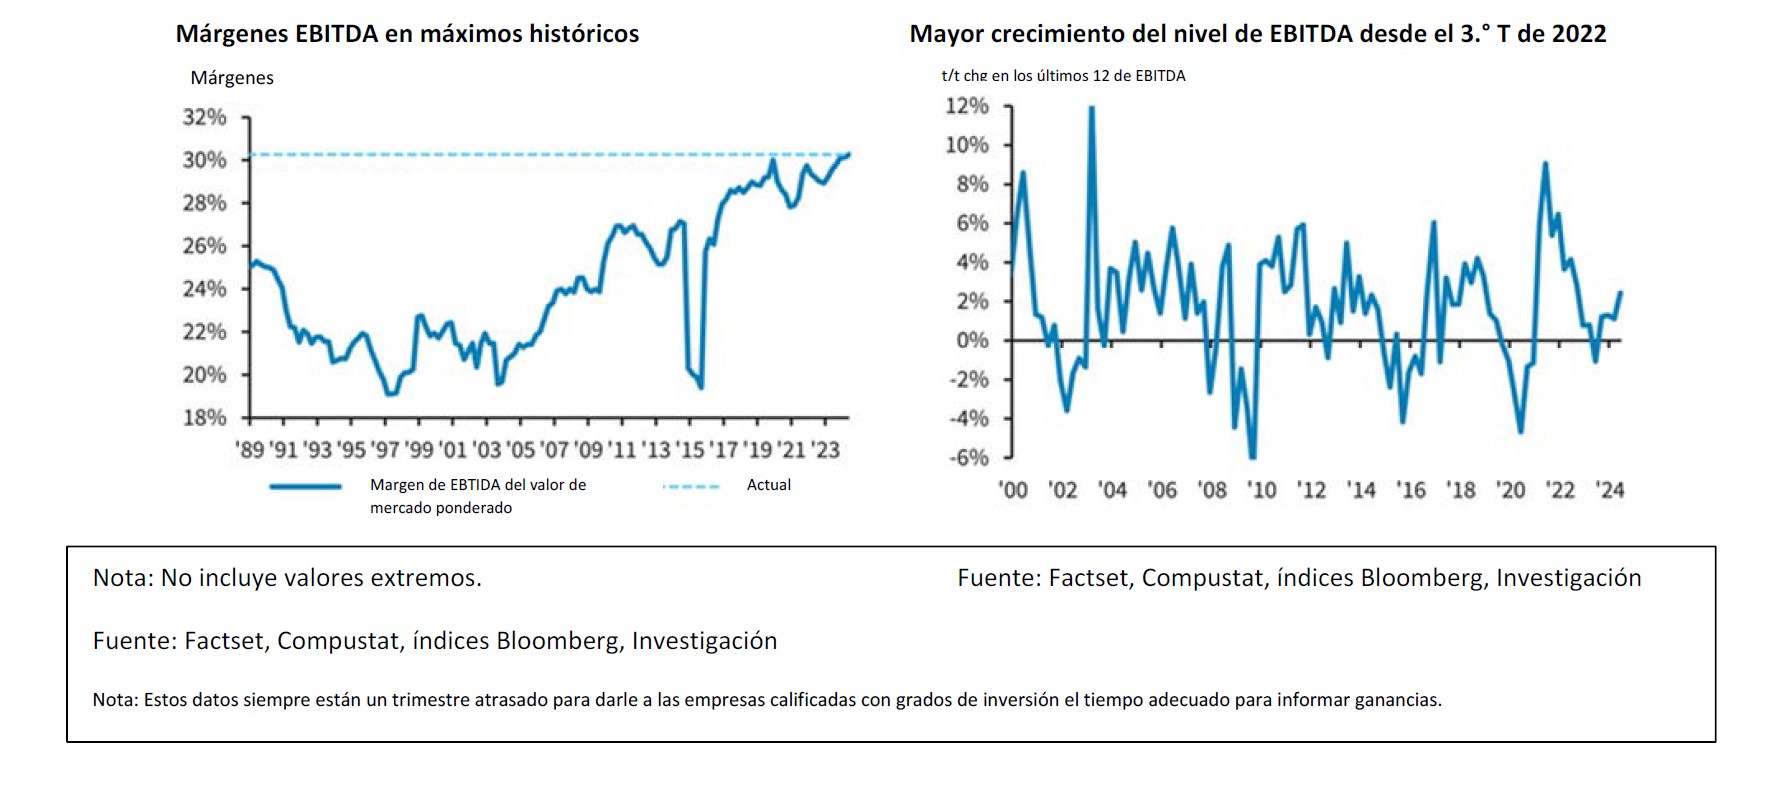
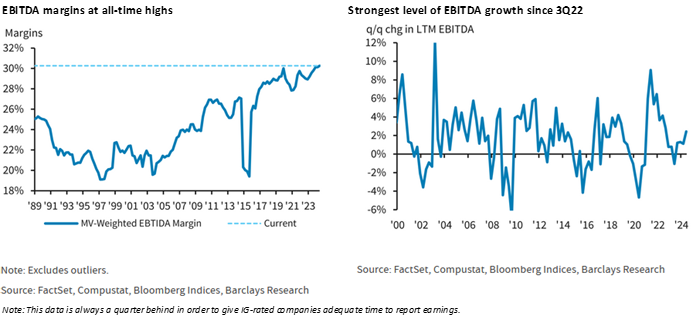
Overall, investment grade credit metrics remained healthy in 2024 and are poised to follow a similar path in 2025. According to research compiled by Barclays, at the end of the third quarter 2024, net leverage for the Index was 3.0x, up 0.2x year over year and interest coverage was 11.7x, a deterioration of 1.3x from the prior year. Meanwhile, EBITDA growth was positive through the first three quarters of 2024 and EBITDA margins moved up a full percentage point over the past year to 30.6%, a new all-time high.2 The best way to describe credit metrics as we head into 2025 is “stable” which is what we like to see. As an active manager with a relatively concentrated portfolio, we are less concerned with the overall universe and instead focus on a relatively small number of issuers that populate our investor portfolios.

Portfolio Positioning

We are consistent in our approach to portfolio management which means that we are not making wholesale changes to our strategy from one year or quarter to the next. We provide value to our investors by assembling customized separately managed accounts consisting of thoroughly-researched individual bonds. There are several tenets that our investors can count on with CAM’s Investment Grade Strategy:

Diversification: Each individual account is initially populated with approximately 20-25 positions. This results in a portfolio that is concentrated relative to the Index but still achieves sufficient diversification at the sector/industry levels. Each account is populated with our best ideas during an invest-up period that takes 6-8 weeks to complete which we refer to as an abbreviated economic cycle.

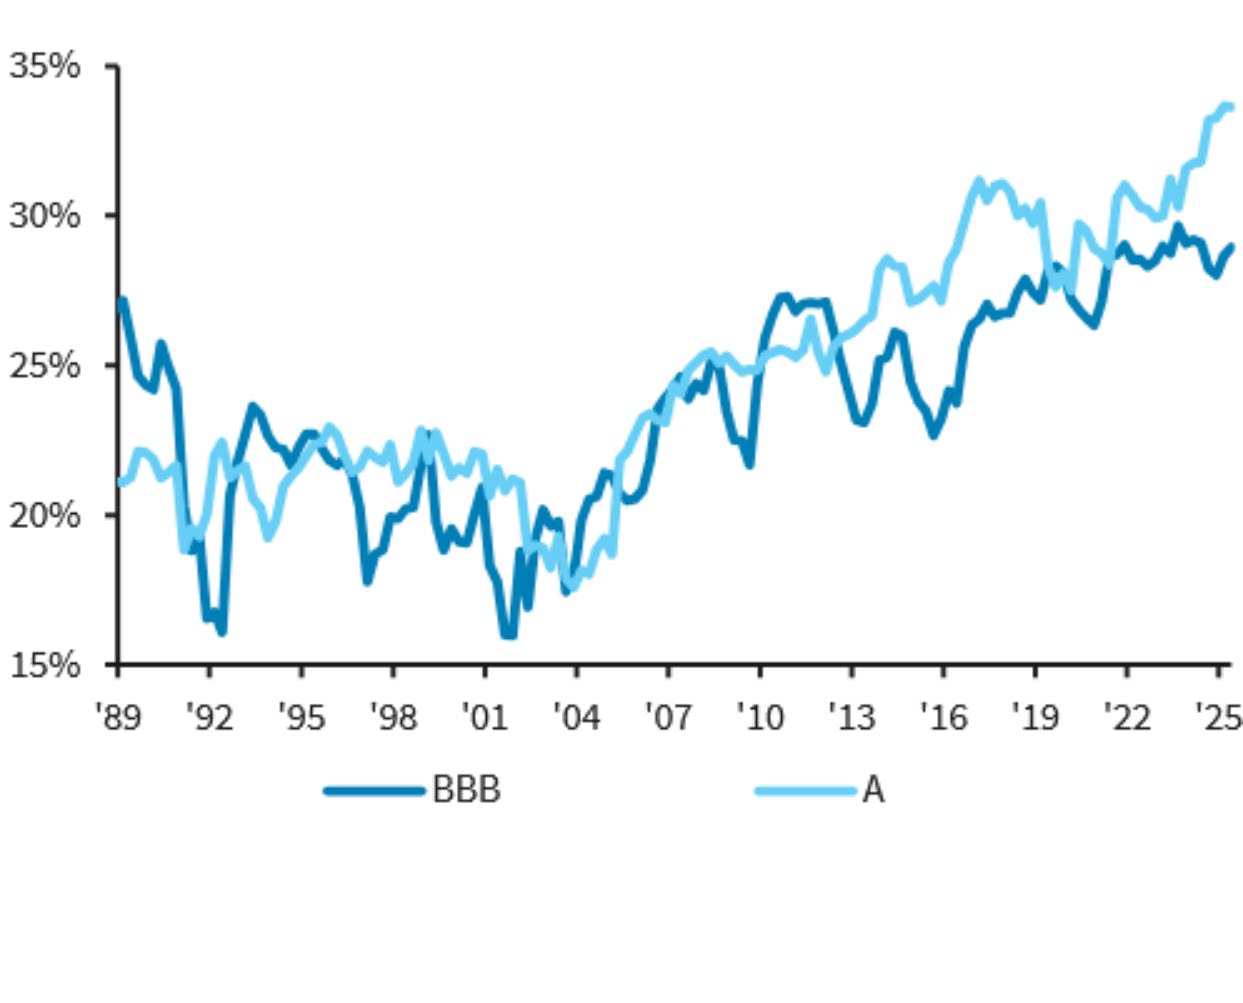
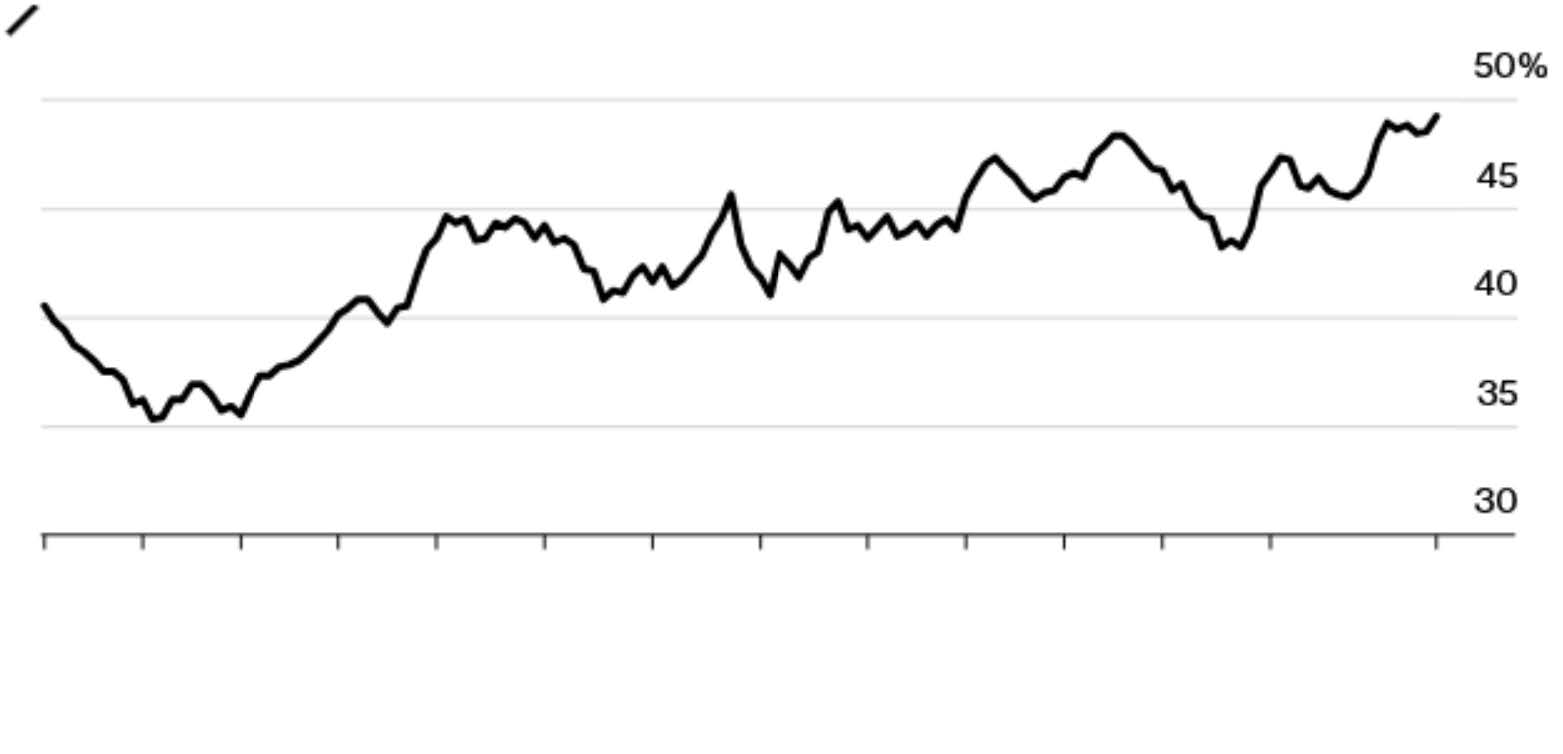
Overweight High Quality: CAM targets a cap for each account at a 30% exposure to BAA-rated bonds, which represent the riskier portion of investment grade universe. The Index had a 47.66% weighting in BAA-rated credit at the end of 2024.

Intermediate Maturity: We will always seek to position the portfolio within an intermediate maturity band that ranges from 5-10 years, although we may occasionally hold bonds shorter than this if warranted by market conditions. At year end 2024 our composite had a modified duration of 5.49 relative to the Index duration of 6.98.

The above framework helps us achieve the goal of our process which is to provide a customized portfolio with a return that is as good or better than the Index while incurring less volatility and prioritizing preservation of capital.

The biggest “change” of note in 2024 was more of a normalization than a pivot in strategy. We have benefited from the aforementioned re-steepening of the yield curve and its impact on our ability to engage in economic sale-and-extension trades. Simply put, it has been much more attractive for us to execute these trades thus allowing our portfolio turnover to rebound to levels more consistent with historical averages. Those investors that have been with us for a number of years have likely noticed this activity; those that have been with us for 2 or 3 years are likely to see an increase in sale activity in 2025 if market conditions remain copacetic.

As we look ahead to 2025, we are actively avoiding individual companies with exposure to geopolitical destabilization and we continue to have no exposure to leisure, lodging, restaurants or gaming. We also have a significant underweight on retailers.

FOMC Taking a Deliberate Approach

The Fed delivered 100bps of rate cuts in 2024, occurring across 3 meetings in the final 3.5 months of the year. The overarching theme of the moment is forward expectations for the path of easing, as the Fed has been careful to dial back its stance on future cuts amid sticky inflation, strong consumer spending and a resilient labor market. With the December FOMC meeting came the quarterly update of the Fed’s ballyhooed “Dot Plot” showing a median estimate of two rate cuts in 2025, down from the four previously projected in the September release. The December FOMC meeting minutes were released on January 8, showing the nuts and bolts of the Fed’s cautious view of the year ahead:
“In discussing the outlook for monetary policy, participants indicated that the Committee was at or near the point at which it would be appropriate to slow the pace of policy easing” and “In addition, many participants suggested that a variety of factors underlined the need for a careful approach to momentary policy decisions over coming quarters.”3
We think that the Fed is taking a prudent approach, especially with the amount of uncertainty from the incoming Trump administration on trade, tariffs, immigration, taxes and foreign policy. The Fed always has the option to reverse course and cut its policy rate more aggressively if the economy slows.

A Year of Opportunity

As we have written before, when it comes to interest rates, “higher for longer” is not negative for bond investors. Clipping coupons in excess of 5% for healthy IG-rated companies is an attractive value proposition. However, we believe that higher rates will continue to weigh on certain sectors of the economy such as housing and have an outsize impact on small businesses which are critical to the health of the U.S. economy. At the end of 2023 we wrote that we thought a recession was likely in 2024 or sometime in 2025. Obviously, that has not come to fruition and while sticking with that call would be deeply out of consensus, we continue to forecast a reasonable chance of recession. One scenario that could land us there is if the economic backdrop deteriorates and the Fed is too slow to react. Other recession scenarios could be borne out by geopolitical issues or by the unintended consequences of political policies or the growing U.S. deficit. We are inherently cautious in the face of these uncertainties. Preservation of capital is at the forefront of our investment grade strategy so we are always positioning the portfolio to mitigate the impact of economic downturns. At the end of the day, investing is always about being appropriately compensated for risk –in the current environment we view the modest compensation for incremental risk to be insufficient. We will continue to focus on blocking and tackling while populating investor portfolios with companies that can persevere in a variety of economic environments.

Thank you for your continued interest and support. We wish you all the best in 2025 and look forward to a successful year.

This information is intended solely to report on investment strategies identified by Cincinnati Asset Management. Opinions and estimates offered constitute our judgment and are subject to change without notice, as are statements of financial market trends, which are based on current market conditions. This material is not intended as an offer or solicitation to buy, hold or sell any financial instrument. Fixed income securities may be sensitive to prevailing interest rates. When rates rise the value generally declines. Past performance is not a guarantee of future results. Gross of advisory fee performance does not reflect the deduction of investment advisory fees. Our advisory fees are disclosed in Form ADV Part 2A. Accounts managed through brokerage firm programs usually will include additional fees. Returns are calculated monthly in U.S. dollars and include reinvestment of dividends and interest. The Index is unmanaged and does not take into account fees, expenses, and transaction costs. It is shown for comparative purposes and is based on information generally available to the public from sources believed to be reliable. No representation is made to its accuracy or completeness.
The information provided in this report should not be considered a recommendation to purchase or sell any particular security. There is no assurance that any securities discussed herein will remain in an account’s portfolio at the time you receive this report or that securities sold have not been repurchased. The securities discussed do not represent an account’s entire portfolio and in the aggregate may represent only a small percentage of an account’s portfolio holdings. It should not be assumed that any of the securities transactions or holdings discussed were or will prove to be profitable, or that the investment decisions we make in the future will be profitable or will equal the investment performance of the securities discussed herein.

Additional disclosures on the material risks and potential benefits of investing in corporate bonds are available on our website: https://www.cambonds.com/disclosure-statements/

Footnotes

Bloomberg News, January 7 2025 “Credit Markets Signal Warning for a Relentless Equity Rally”

Barclays Bank PLC, December 16 2024 “US Investment Grade Credit Metrics, Q3 24 Update: Likely Peaked”

FOMC Federal Reserve System, January 8 2025 “Minutes of the Federal Open Market Committee: December 17-18, 2024”

23 Oct 2024

2024 COMENTARIO DEL TERCER TRIMESTRE

El crédito con grado de inversión registró un sólido desempeño durante el tercer trimestre, ya que los tenedores de bonos se beneficiaron de diferenciales de crédito más ajustados y rendimientos de los bonos del Tesoro más bajos. La Reserva Federal finalmente dio inicio al tan esperado ciclo de flexibilización al reducir su tasa de referencia por primera vez desde marzo de 2020. Seguimos siendo constructivos respecto del mercado de bonos con grado de inversión en el corto y mediano plazo.

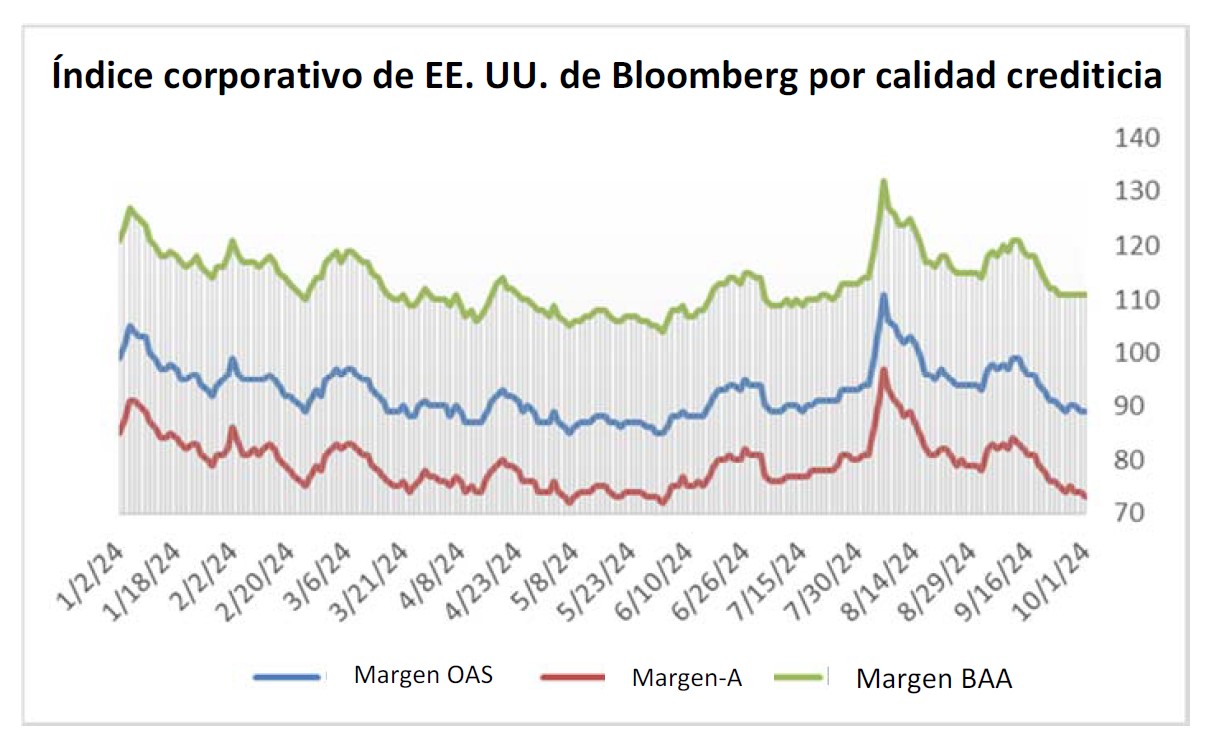
El diferencial ajustado por opciones (OAS) en el Índice de bonos corporativos de EE. UU. de Bloomberg abrió el tercer trimestre en 94 y cotizó en un amplio 111 a principios de agosto antes de terminar el trimestre con un diferencial de 89. Agosto trajo consigo algunos días hábiles volátiles, algo que aún no habíamos experimentado en 2024. La debilidad de los datos sobre manufactura y empleo perjudicaron el ánimo de los inversores y los índices bursátiles se desplomaron, lo que repercutió en los diferenciales de crédito. La debilidad en los diferenciales duró poco. El índice IG cerró en 111 el 5 de agosto antes de retroceder gradualmente hasta los 100 puntos el 14 de agosto. A partir de ahí, los diferenciales continuaron reduciéndose hacia el final del trimestre.

Los rendimientos de los bonos del Tesoro bajaron significativamente durante el trimestre, lo que supuso un viento a favor para los rendimientos totales. Esto contrasta con el segundo trimestre, en el que las tasas aumentaron en general. El extremo inicial de la curva de rendimiento fue especialmente más bajo en el tercer trimestre, con el Tesoro a 2 años registrando un enorme movimiento intertrimestral a la baja de -111 puntos básicos. Consideramos este repunte en la parte inicial de la curva como una respuesta clásica al recorte de la Reserva Federal, ya que históricamente las tasas a corto plazo suelen verse mucho más afectadas que las tasas más alejadas de la curva.

La emisión corporativa con grados de inversión continuó a su ritmo vertiginoso. Tanto julio como septiembre establecieron récords históricos por el mayor volumen jamás llevado al mercado en cada uno de esos meses. Se emitieron 1,264 billones de dólares de nueva deuda con grado de inversión durante el tercer trimestre, lo que supone una ventaja del 29% con respecto al ritmo de 2023 – y 2023 no se quedó atrás. Como hemos escrito en notas anteriores, el mercado de nuevas emisiones de 2024 ha estado en una zona privilegiada. Los prestatarios con calificación IG se han sentido cómodos con las tasas que están pagando, y los inversores han estado satisfechos con la compensación brindada. Los flujos de fondos han sido muy positivos y han apoyado la demanda de los inversores, y las concesiones por nuevas emisiones han sido razonables para la mayoría de las operaciones. La economía ha estado en una situación sólida y las empresas han necesitado capital para hacer crecer sus negocios. Queda por ver si este entorno persistirá o si tal vez se adelantó algún endeudamiento antes de las elecciones presidenciales de noviembre. En resumen, el mercado de nuevas emisiones ha estado increíblemente activo y ha funcionado a un alto nivel durante los primeros tres trimestres de 2024.

Los indicadores crediticios con grado de inversión continuaron mostrando resiliencia al final del segundo trimestre, beneficiándose de una economía que ha seguido creciendo. Los márgenes de EBITDA fueron del 30.3% al final del segundo trimestre, un nuevo máximo histórico, mientras que el crecimiento del EBITDA estuvo en su nivel más alto en dos años.  La cobertura de intereses también mejoró gradualmente durante el trimestre, pero esto fue contrarrestado por un apalancamiento ligeramente mayor en todo el universo IG.  En resumen, creemos que el crédito IG ofrece muchas oportunidades para invertir en empresas adecuadamente capitalizadas con buenos negocios y diferenciales atractivos.

Un año puede marcar una gran diferencia

La Reserva Federal aplicó un recorte de 50 puntos básicos en su reunión de septiembre.  Esto ocurrió después de haber elegido mantener constante su tasa de referencia en la reunión de julio y no haber habido reunión en agosto.  El “gráfico de puntos” de la Reserva Federal que se publicó coincidiendo con la reunión mostró que la mediana de los puntos de vista de los 19 miembros del Comité Federal del Mercado Abierto (FOMC) eran las siguientes: 50 puntos básicos de recortes adicionales en 2024, 100 puntos básicos de recortes en 2025 y otros 50 puntos básicos de recortes en 2026. Los participantes del mercado adoptaron un punto de vista más moderado que la proyección de la Reserva Federal para el resto de 2024, y los futuros de los fondos de la Reserva Federal desestimaron recortes de 71 puntos básicos antes de fin de año al 1 de octubre. Creemos que este ciclo de flexibilización será deliberado y se desarrollará a lo largo de varios años.  La Reserva Federal no puede darse el lujo de actuar demasiado apresuradamente debido al riesgo de reavivar las presiones inflacionarias.  El comodín es que la Reserva Federal podría recortar su tasa más rápida y agresivamente si el mercado laboral se deteriora rápidamente respecto de los niveles actuales, ya que históricamente ese ha sido un indicador adelantado de recesión.

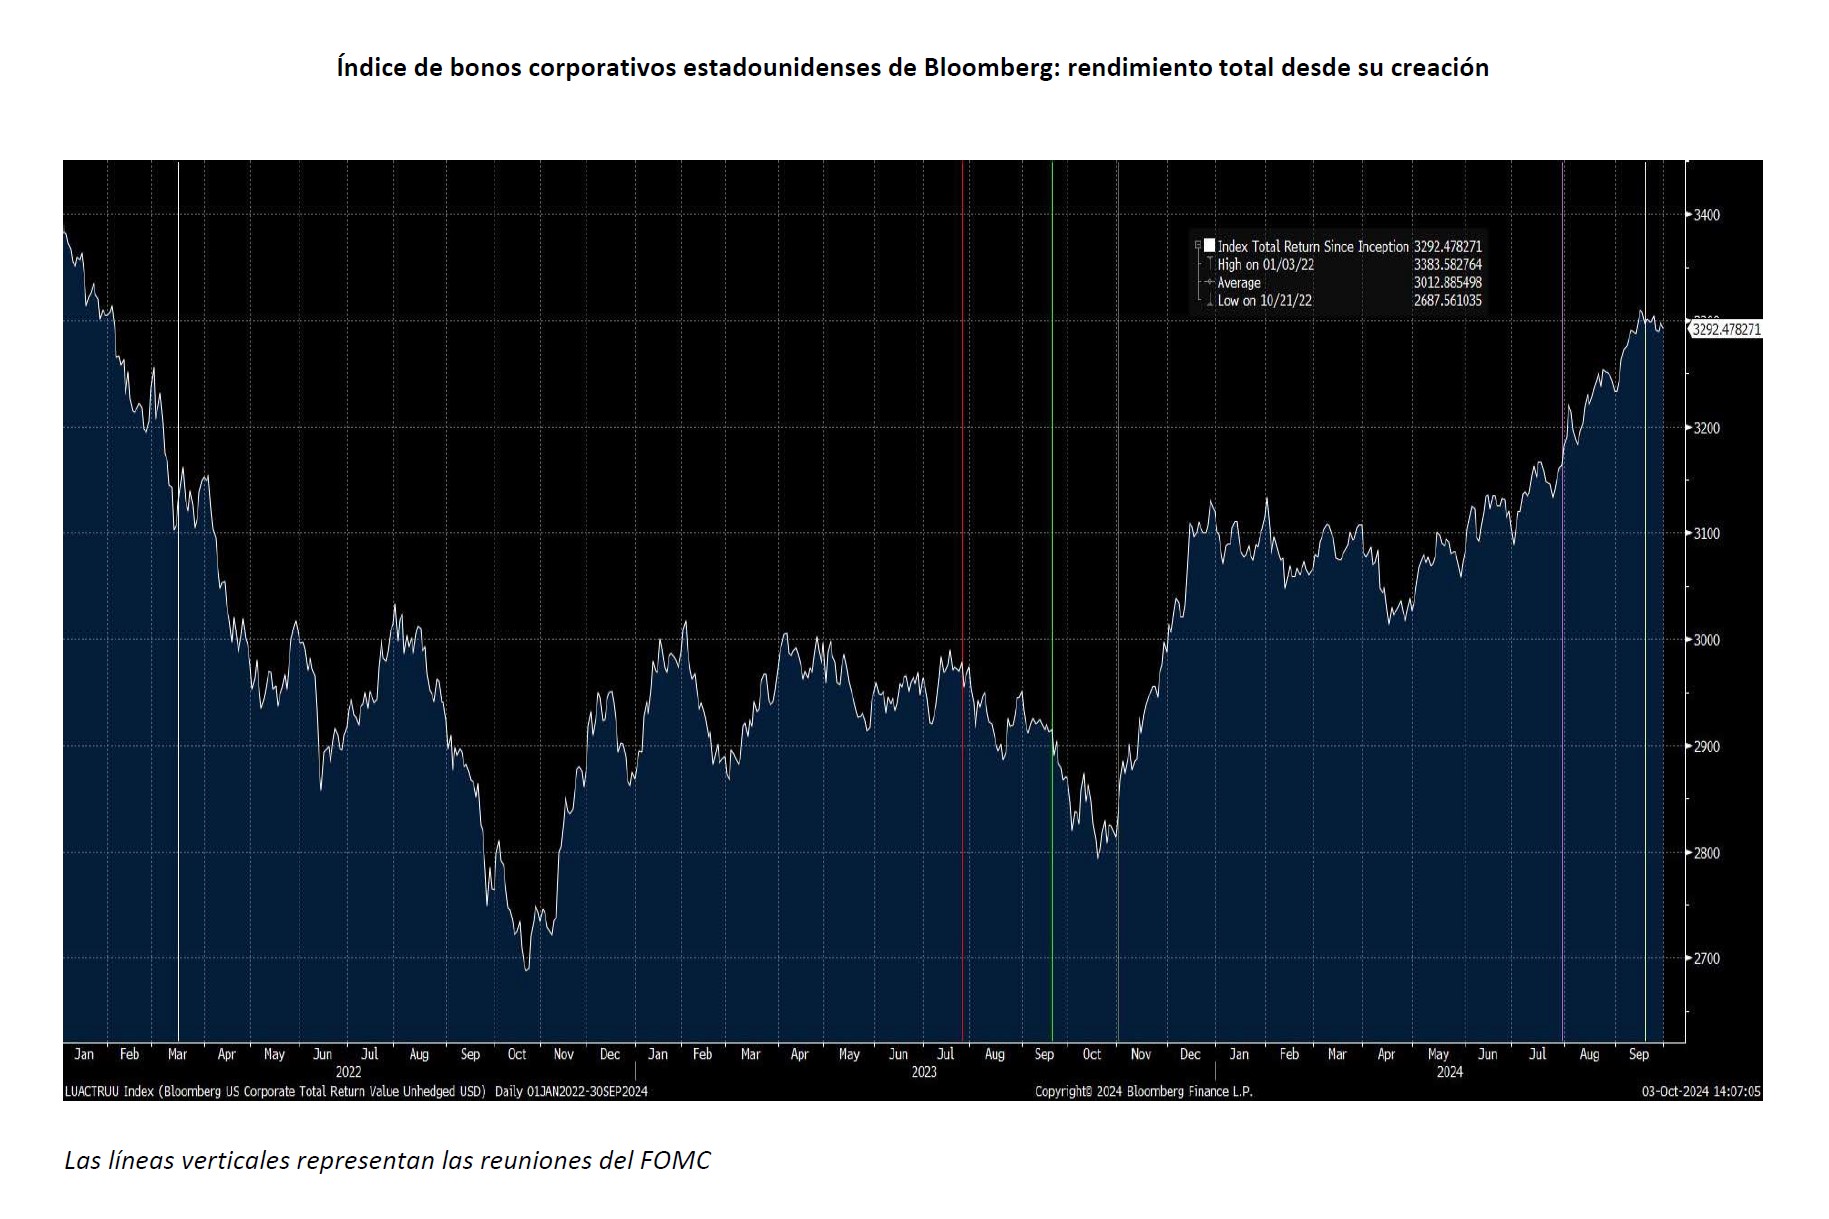
Pensamos que sería instructivo ilustrar la progresión de los rendimientos de grado de inversión a lo largo del ciclo de ajuste que desde entonces se ha convertido en un ciclo de flexibilización. El gráfico de la página siguiente muestra el rendimiento total del índice IG desde su inicio, pero hemos recortado los datos para mostrar el ciclo actual desde principios de 2022 hasta el tercer trimestre de 2024.  El mercado alcanzó su mínimo del ciclo actual en octubre de 2022 antes de recuperarse en 2023, operando de forma lateral antes de volver a caer en octubre de 2023.  Hubo un poderoso aumento durante el cuarto trimestre de 2023 antes de que el mercado se mantuviera estancado durante la mayor parte de este año hasta el último trimestre, donde una vez más ha tendido en una dirección positiva.

Las líneas verticales del gráfico representan reuniones cruciales de la Reserva Federal que han tenido lugar desde principios de 2022, las cuales exploraremos más adelante.  A modo de aclaración, seríamos negligentes si no dijéramos que este análisis es mucho más fácil con el beneficio de la retrospectiva, pero creemos que, no obstante, es un ejercicio interesante.

3/16/2022: El primer aumento de la tasa de referencia del ciclo de ajuste.  Esto fue bien anunciado y anticipado por los inversores y muchos pensaron que la Reserva Federal debería haber actuado incluso antes para combatir la inflación.

7/26/2023: El último aumento de la tasa del ciclo de ajuste.  Esto llevó la tasa de referencia a su nivel más alto en 22 años.  Recordemos que, en ese momento, no estaba del todo claro si la Reserva Federal había concluido con los aumentos.  Después de todo, la Reserva Federal ya hizo una pausa en junio para luego volver a aumentar las tasas en esta reunión.  En la conferencia de prensa posterior a la decisión del FOMC, el presidente Powell dijo: “Ciertamente es posible que volvamos a aumentar las tasas en la reunión de septiembre”. “Y yo también diría que es posible que optemos por mantenernos firmes en esa reunión”.

9/20/2023: La Reserva Federal vuelve a hacer una pausa por primera vez desde junio, pero no se compromete a realizar más alzas.

11/1/2023: La Reserva Federal hace una tercera pausa en el ciclo y los comentarios de Powell indican que la vara está más alta para un mayor ajuste a través de ajustes a la tasa de referencia.  ¿Es coincidencia que el mercado haya subido mucho a finales de año?

7/31/2024: La Reserva Federal mantiene estables las tasas, pero indica que se vislumbran recortes a corto plazo.

9/18/2024: La Reserva Federal aplica su primer recorte de tasas del ciclo actual.  Al final del tercer trimestre, el índice IG había recuperado casi la totalidad del valor que perdió durante el ciclo de ajuste.  El índice ha registrado un rendimiento total del +14.28% desde el final del tercer trimestre de 2023 hasta el final del tercer trimestre de 2024.

¿Qué ha cambiado en nuestra cartera?

El mayor cambio que hemos podido implementar en 2024 es que las ventas y ampliaciones han vuelto a ser económicas.  Gran parte de lo que intentamos lograr para nuestros clientes se deriva de nuestro posicionamiento intermedio.  Generalmente poblamos las cuentas nuevas con bonos que vencen en 8 a 10 años.  Luego permitiremos que esos bonos desciendan por la curva de rendimiento, con el objetivo de comprimir los diferenciales a medida que los bonos se acerquen a la marca de los 5 años.  Cuando falten unos 5 años para el vencimiento, empezaremos a vender bonos y a ampliar la curva.  Esto nos permite mitigar el riesgo de tasa de interés y captar la inclinación de la curva de 5/10 del Tesoro, así como la curva de crédito corporativo.  ¡Todo esto es cierto en tiempos normalizados, pero los últimos dos años han sido todo lo contrario!  La curva de bonos 2/10 del Tesoro se invirtió durante un récord de 25 meses consecutivos (consulte el gráfico a continuación de la Reserva Federal de St. Louis).[i] Esto hizo que nuestras operaciones de venta y extensión fueran antieconómicas: las matemáticas simplemente dictaban que a nuestros clientes, en muchos casos, les convenía mantener sus bonos existentes durante más tiempo del habitual, para permitir que pasara el ciclo de ajuste y ganar tiempo para que la curva recuperara su inclinación.  Durante este tiempo, seguíamos ocupados investigando y supervisando los créditos y realizando cambios en los márgenes, pero nuestra actividad de venta de cuentas totalmente invertidas durante el punto máximo de la inversión de la curva se vio gravemente disminuida.  Esto cambió de manera importante en 2024, ya que las curvas comenzaron a normalizarse y estamos encontrando oportunidades comerciales mucho más atractivas que hemos utilizado para agregar valor para nuestros clientes.  Nuestro volumen se duplicó durante el último año y ahora se acerca a una cifra mucho más acorde con los promedios históricos.

¿El crédito IG es caro o barato?

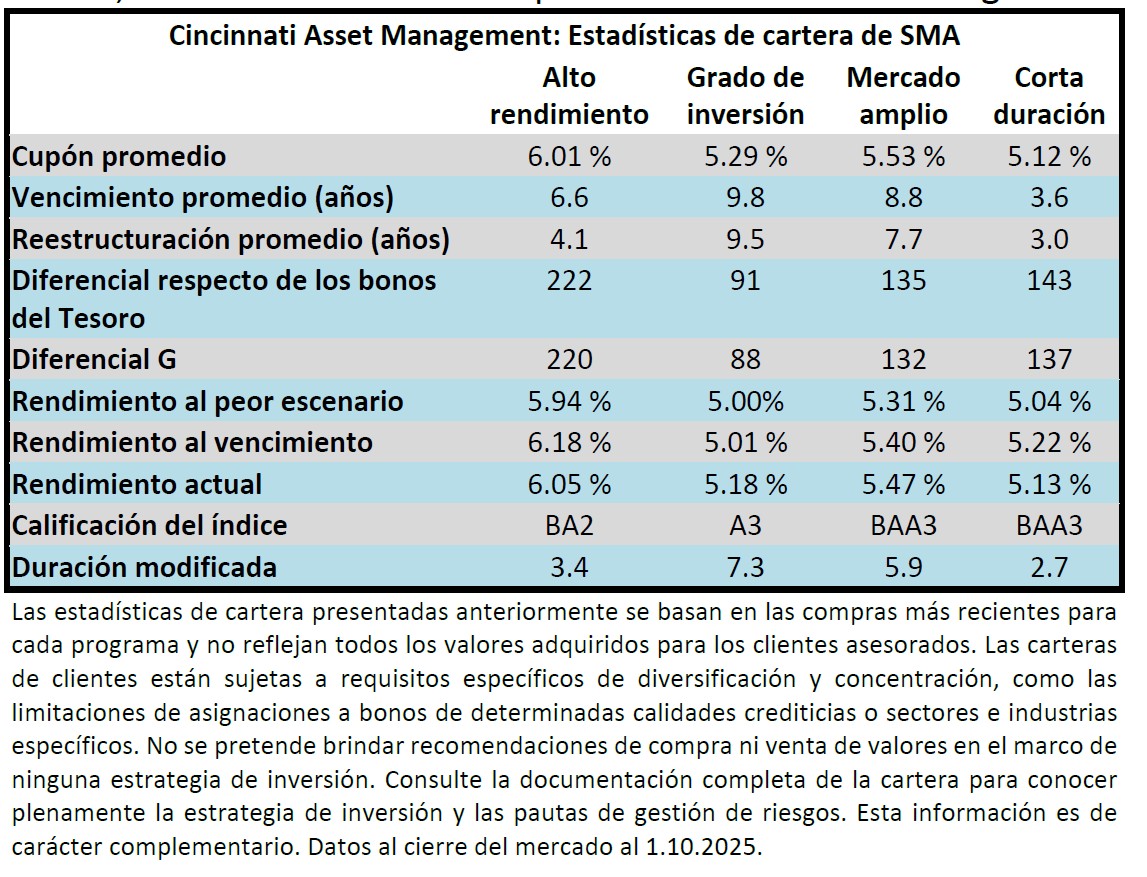
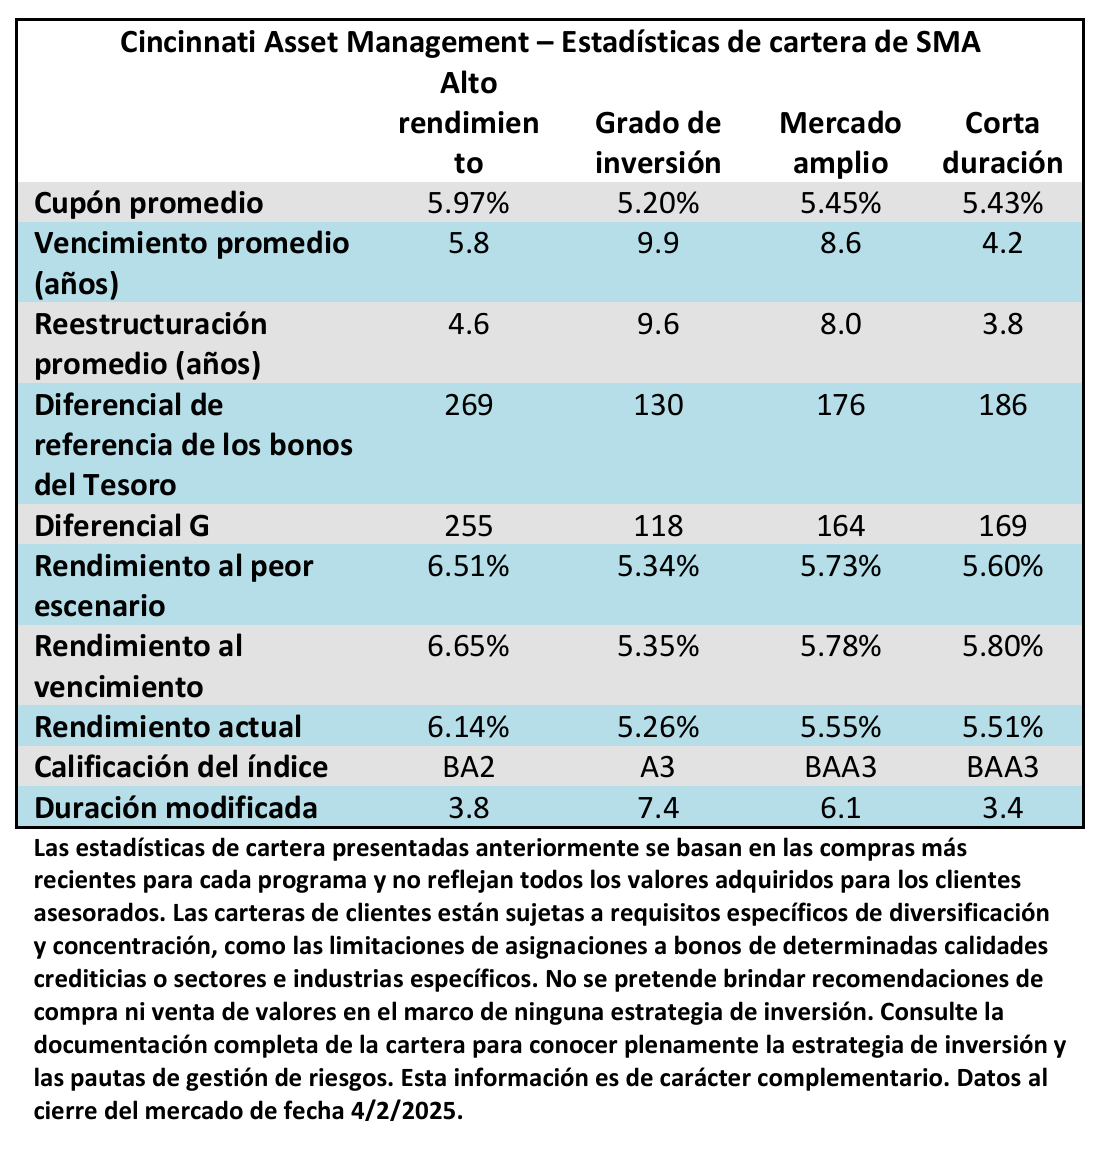
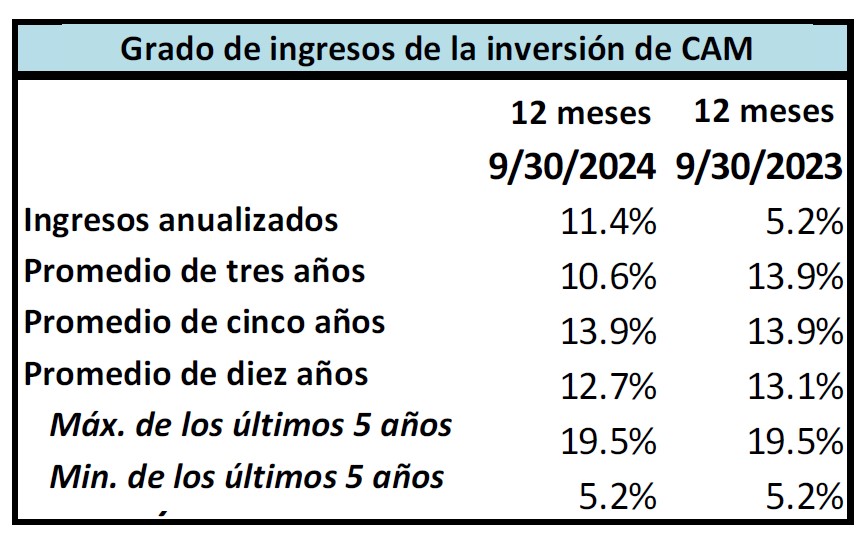
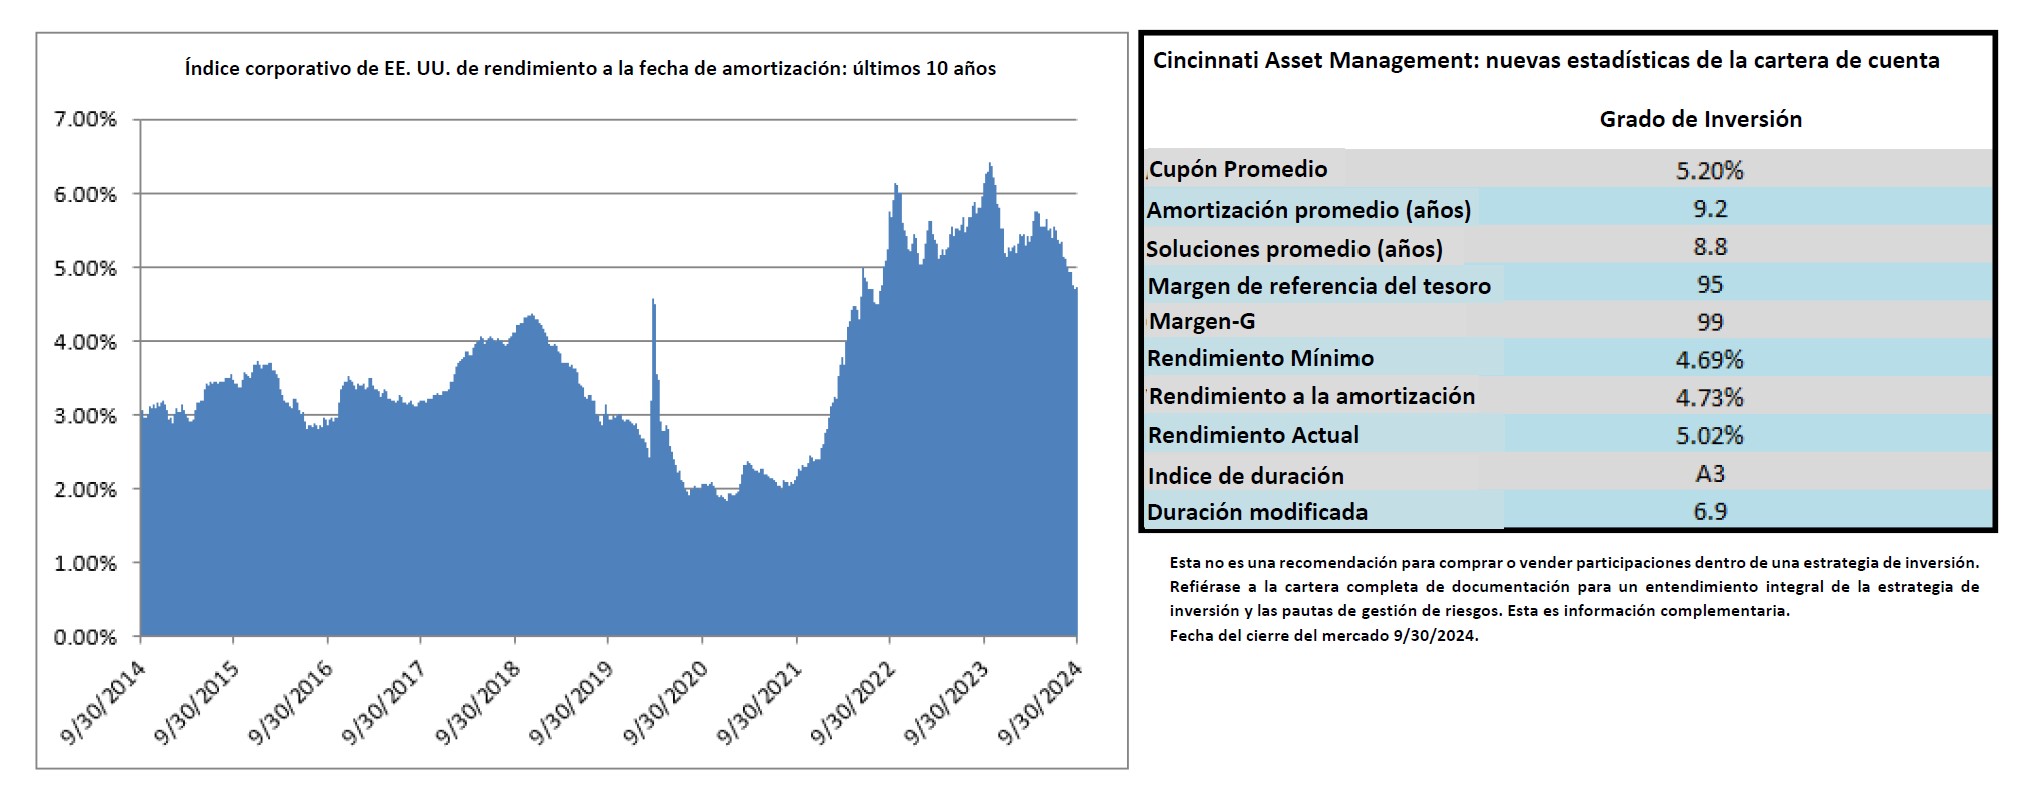
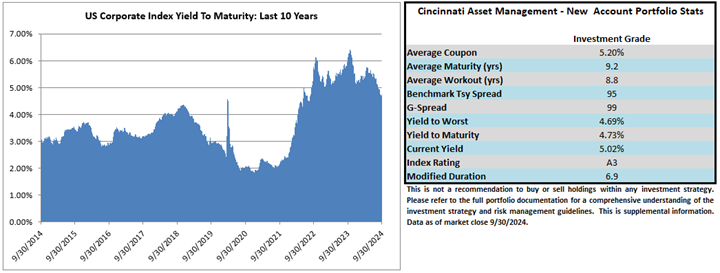
En lo que se refiere a la valoración, los diferenciales de crédito de IG se encuentran en el extremo ajustado de los rangos históricos.    Creemos que los diferenciales están bastante valorados dada la solidez de las métricas crediticias en todo el universo IG y la resiliencia de la economía estadounidense.  Los diferenciales de crédito incorporan en los precios muy pocas probabilidades de una recesión, pero creemos que los inversores cuentan con cierta protección frente a una desaceleración económica debido a que los rendimientos de los bonos del Tesoro aún son elevados en relación con los promedios de mediano plazo.  El rendimiento al vencimiento del índice de grado de inversión al final del tercer trimestre fue del 4.73%, mientras que el promedio de 10 años fue del 3.62%.  El gráfico de la derecha muestra una imagen aproximada de lo que una nueva cuenta en el programa de Grado de Inversión de Cincinnati Asset Management, Inc. (CAM) podría esperar al final del trimestre.

Entrando en la recta final

A medida que entramos en los últimos meses del año, no podemos evitar la sensación de que los participantes del mercado están casi demasiado cómodos.  La probabilidad media de una recesión durante el próximo año calendario, según una encuesta de economistas de Bloomberg, ha caído al 30% frente al 55% de hace un año. Se han logrado grandes avances en materia de inflación, pero aún queda trabajo por hacer y hay riesgos a la baja si la Reserva Federal es demasiado agresiva al flexibilizar su tasa de referencia.  Existen numerosos problemas geopolíticos y graves conflictos en curso en todo el mundo.  Las elecciones presidenciales en Estados Unidos se celebrarán en menos de un mes.  A pesar de estos riesgos, los índices bursátiles nacionales se encuentran en máximos históricos y los diferenciales de crédito se mantienen ajustados.  Si bien es cierto que la probabilidad de un impacto controlado ha aumentado, todavía hay motivos para ser cautelosos.

Seguimos siendo meticulosos a la hora de completar nuestras carteras de inversores.  Estamos en la búsqueda de empresas duraderas con un fuerte flujo de caja libre y métricas crediticias que sean lo suficientemente sólidas como para resistir una recesión.  Contáctenos si tiene alguna pregunta o desea hablar sobre algún tema.  Agradecemos su interés y colaboración.

Esta información solo tiene el propósito de dar a conocer las estrategias de inversión identificadas por Cincinnati Asset Management. Las opiniones y estimaciones ofrecidas están basadas en nuestro criterio y están sujetas a cambios sin previo aviso, al igual que las declaraciones sobre las tendencias del mercado financiero, que dependen de las condiciones actuales del mercado. Este material no tiene como objetivo ser una oferta ni una solicitud para comprar, mantener ni vender instrumentos financieros.  Los valores de renta fija pueden ser vulnerables a las tasas de interés vigentes.  Cuando las tasas aumentan, el valor suele disminuir.  El rendimiento pasado no es garantía de resultados futuros.  El rendimiento bruto de la tarifa de asesoramiento no refleja la deducción de las tarifas de asesoramiento de inversión.  Nuestras tarifas de asesoramiento se comunican en el Formulario ADV Parte 2A.  En general, las cuentas administradas mediante programas de firmas de corretaje incluyen tarifas adicionales.  Los rendimientos se calculan mensualmente en dólares estadounidenses e incluyen la reinversión de dividendos e intereses. El índice no está administrado y no considera las tarifas de la cuenta, los gastos y los costos de transacción.  Se muestra con fines comparativos y se basa en información generalmente disponible al público tomada de fuentes que se consideran confiables.  No se hace ninguna afirmación sobre su precisión o integridad. 


La información suministrada en este informe no debe considerarse una recomendación para comprar o vender ningún valor en particular.  No hay garantía de que los valores que se tratan en este documento permanecerán en la cartera de una cuenta en el momento en que reciba este informe o que los valores vendidos no se hayan vuelto a comprar.  Los valores de los que se habla no representan la cartera completa de una cuenta y, en conjunto, pueden representar solo un pequeño porcentaje de las tenencias de cartera de una cuenta.  No debe suponerse que las transacciones de valores o participaciones analizadas fueron o demostrarán ser rentables, o que las decisiones de inversión que tomemos en el futuro serán rentables o igualarán el rendimiento de la inversión de los valores discutidos en este documento.    Como parte de la educación de los clientes sobre la estrategia de CAM, podemos proporcionar información de vez en cuando que incluya referencias a tasas y diferenciales históricos.  Los ejemplos hipotéticos que hacen referencia al nivel o cambios en las tasas y diferenciales tienen únicamente fines ilustrativos y educativos.  No pretenden representar el desempeño de ninguna cartera o valor en particular, ni incluyen el impacto de las tarifas y gastos.  Tampoco toman en consideración todas las condiciones económicas y de mercado que habrían influido en nuestra toma de decisiones.  Por lo tanto, las cuentas de los clientes pueden experimentar o no escenarios similares a los mencionados en este documento.

En nuestro sitio web se encuentran disponibles las divulgaciones adicionales sobre los riesgos materiales y los posibles beneficios de invertir en bonos corporativos: https://www.cambonds.com/disclosure-statements/

i Bloomberg, 1 de octubre de 2024 “IG PIPELINE: Comienzo tranquilo del cuarto trimestre tras un septiembre récord”

ii Investigación de Barclays FICC, 9 de septiembre de 2024 “Métricas de crédito con grado de inversión de EE. UU., actualización del segundo trimestre de 2024: mantenimiento a flote”

iii Junta de la Reserva Federal, 19 de septiembre de 2024 “Resumen de proyecciones económicas”

iv Bloomberg, 1 de octubre de 2024 “Probabilidad de la tasa de interés mundial”

v AP News, 26 de julio de 2023 “La Reserva Federal aumenta las tasas por undécima vez para combatir la inflación, pero no da señales claras de su próximo movimiento”

vi Thomson Reuters, 5 de agosto de 2024 “La curva de rendimiento de los bonos clave de EE. UU. se vuelve positiva por temores de recesión”

vii Bloomberg, 3 de octubre de 2024, “Pronóstico de probabilidad de recesión en Estados Unidos”

14 Oct 2024

2024 Q3 Investment Grade Quarterly

Investment grade credit enjoyed solid performance during the third quarter as bondholders benefited from tighter credit spreads and lower Treasury yields. The Fed finally kicked things off with its much-anticipated easing cycle by lowering its policy rate for the first time since March 2020. We remain constructive on the investment grade bond market over the near and medium term.

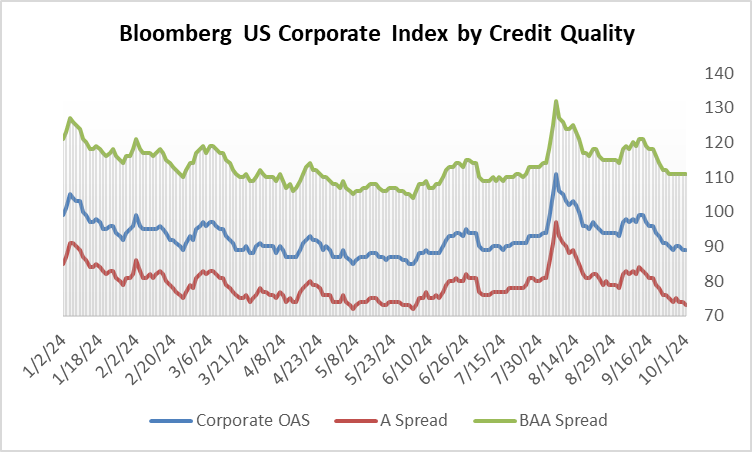
The option-adjusted spread (OAS) on the Bloomberg US Corporate Bond Index opened the third quarter at 94 and traded as wide as 111 in early August before finishing the quarter at a spread of 89. August brought with it a few volatile trading days, something we had yet to experience in 2024. Weak manufacturing and employment data soured investor sentiment, and equity indices collapsed, which spilled over into credit spreads. The weakness in spreads was short-lived. The IG index closed as wide as 111 on August 5th before incrementally moving back to 100 on August 14th. From there, spreads continued to grind tighter into quarter-end.

Treasury yields moved meaningfully lower during the quarter, which was a tailwind for total returns. This was in contrast to the 2nd quarter, which saw rates move higher throughout. The front end of the yield curve was especially lower in the 3rd quarter, with the 2-year Treasury posting an inter-quarter move lower of -111 basis points. We view this rally in the front end of the curve as a classical response to the Fed’s cut, as short rates historically are typically much more impacted than rates further out the curve.

Investment-grade corporate issuance continued at its sizzling pace. Both July and September set historical records for the most volume ever brought to market in each of those months. $1.264 trillion of new investment-grade debt was issued through the third quarter, which was +29% ahead of 2023’s pace – and 2023 was no slouch. As we have written in previous notes, the 2024 new issue market has been in a goldilocks zone. IG-rated borrowers have been comfortable with the rates they are paying, and investors have been pleased with the compensation afforded. Fund flows have been soundly positive and supportive of investor demand, and new issue concessions have been reasonable for most deals. The economy has been on sound footing, and companies have required capital to grow their businesses. It remains to be seen if this environment will persist or if perhaps some borrowing was pulled forward ahead of the November presidential election. Bottom line, the new issue market has been incredibly busy and has functioned at a high level throughout the first three quarters of 2024.

Investment-grade credit metrics continued to display resilience at the end of the second quarter, benefiting from an economy that has continued to grow. EBITDA margins were 30.3% at the end of 2Q, a new all-time high, while EBITDA growth was at its highest level in two years. Interest coverage also improved incrementally during the quarter, but this was offset by slightly higher leverage across the IG universe. Putting it all together, we believe that IG credit offers plenty of opportunities to invest in appropriately capitalized companies with good businesses at attractive spreads.

What a Difference a Year Makes

The Fed delivered a 50bp cut at its September meeting. This was after electing to hold its policy rate constant at the July meeting, and there was no meeting in the month of August. The Fed “Dot Plot” that was released coincident with the meeting showed that the median views of the 19 FOMC members were as follows: 50bps of additional cuts in 2024, 100bps of cuts in 2025, and a further 50bps of cuts in 2026. Market participants were taking a more dovish view than the Fed’s projection for the balance of 2024, with Fed Funds futures pricing 71bps of cuts before year-end as of October 1. We believe that this easing cycle will be a deliberate one that plays out over the course of several years. The Fed cannot afford to move too hastily due to the risk of reigniting inflationary pressures. The wildcard is that the Fed could cut its rate more quickly and aggressively if the labor market deteriorates rapidly from current levels, as that has historically been a leading indicator of recession.

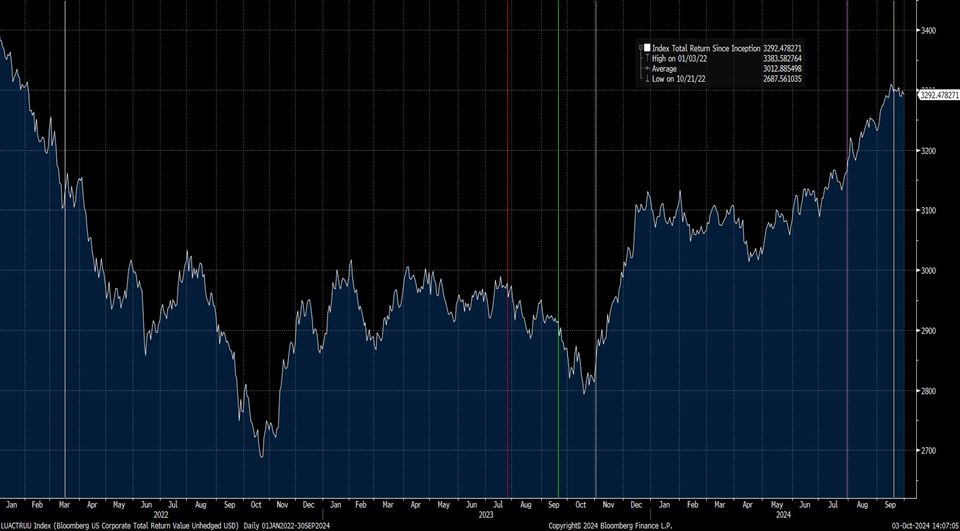
We thought it would be instructive to illustrate the progression of investment grade returns over the course of the tightening cycle that has since turned into an easing cycle. The chart on the ensuing page depicts the total return for the IG index since inception but we have snipped the data to show the current cycle from the beginning of 2022 through the third quarter of 2024.  The market hit its low for the current cycle in October 2022 before it recovered into 2023 as it traded sideways before taking another leg lower in October 2023.  There was a powerful move higher during the fourth quarter of 2023 before the market treaded water for most of this year until the recent quarter where it has once again trended in a positive direction.

The vertical lines on the chart represent pivotal Fed meetings that have occurred since the beginning of 2022, which we will explore further below.  As a disclaimer, we would be remiss if we did not say that this analysis is far easier with the benefit of hindsight but we believe it is an interesting exercise nonetheless.

3/16/2022 – The first policy rate hike of the tightening cycle.  This was well telegraphed and anticipated by investors and many thought that the Fed should have moved even sooner in order to combat inflation.

7/26/2023 – The last rate hike of the tightening cycle.  This pushed the policy rate to a 22-year high.  Recall that, at the time, it was quite unclear if the Fed was done hiking.  After all, the Fed already paused once in June only to hike again at this meeting.  To quote Chairman Powell at the news conference following the FOMC decision “It is certainly possible that we will raise rates again at the September meeting,” he said. “And I would also say it’s possible that we would choose to hold steady at that meeting.”

9/20/2023 – The Fed pauses again for the first time since June but is non-committal about further hikes.

11/1/2023 – The Fed pauses for a third time in the cycle and Powell’s remarks indicate that the bar is higher for further tightening through adjustments to the policy rate.  Is it any coincidence that the market ripped higher through year end?

7/31/2024 – The Fed holds rates steady but indicates that near-term cuts are on the horizon.

9/18/2024 – The Fed delivers its first rate cut of the current cycle.  Through the end of the third quarter, the IG index had recovered nearly the entirety of the value it lost during the tightening cycle.  The index has posted a +14.28% total return from the end of the third quarter 2023 to the end of the third quarter 2024.

What has Changed for Our Portfolio?
The biggest change we have been able to implement in 2024 is that sales and extensions have once again become economic. A large portion of what we are trying to accomplish for our clients is derived from our intermediate positioning. We generally populate new accounts with bonds that mature in 8-10 years. We will then allow those bonds to roll down the yield curve, with the goal of spread compression as the bonds move toward the 5yr mark. With about 5yrs to maturity, you will start to see us sell bonds and extend further back out the curve. This allows us to mitigate interest rate risk and capture the steepness of the 5/10 Treasury curve as well as the corporate credit curve. This all holds true in normalized times but the last two years have been anything but that!  The 2/10 Treasury curve was inverted for a record consecutive 25 months (see below chart from St. Louis Fed). This made our sale and extension trades uneconomic –the math simply dictated that our clients were, in many cases, better off holding their existing bonds longer than they would typically, allowing the tightening cycle to pass and buying time for the curve to regain steepness.  We were still busy during this time researching and monitoring credits and making changes at the margins but our sale activity for fully invested accounts during the peak of the curve inversion was severely diminished.  This has changed in a big way in 2024 as curves have begun to normalize and we are finding many more attractive trading opportunities which we have used to add value for our clients.  Our turnover has doubled over the past year and is now approaching a figure that is much more in-line with historical averages.

As far as valuation is concerned, IG credit spreads are at the tight end of historical ranges. We believe spreads are fairly valued given the strength of credit metrics across the IG universe and the resilience of the U.S. economy. Credit spreads are pricing in very little chance of a recession, but we feel that investors are afforded some downside protection from an economic slowdown due to Treasury yields that are still elevated relative to medium-term averages. The yield to maturity for the investment-grade index at the end of the third quarter was 4.73% while the 10yr average was 3.62%. The chart paints an approximate picture of what a new account in CAM’s Investment Grade program could expect at quarter end.

Entering The Homestretch
As we enter the final few months of the year, we can’t help but feel that market participants are almost too comfortable. The median probability of a recession over the next calendar year according to a Bloomberg survey of economists has fallen to 30%, down from 55% a year ago. There has been great progress with inflation, but there is still work to do and there are risks to the downside if the Fed is too aggressive with easing its policy rate. There are numerous geopolitical issues and serious ongoing conflicts throughout the world. A U.S. presidential election is less than a month away. Despite these risks, domestic equity indices are at all-time highs and credit spreads are snug. While the probability of a soft landing has increased, there is still reason for caution.

We continue to be fastidious when populating our investor portfolios.  We are on the hunt for durable businesses with strong free cash flow and credit metrics that are robust enough to weather a downturn.  Please contact us with any questions or topics for discussion.  We are grateful for your interest and partnership.

This information is intended solely to report on investment strategies identified by Cincinnati Asset Management. Opinions and estimates offered constitute our judgment and are subject to change without notice, as are statements of financial market trends, which are based on current market conditions. This material is not intended as an offer or solicitation to buy, hold or sell any financial instrument. Fixed income securities may be sensitive to prevailing interest rates. When rates rise, the value generally declines. Past performance is not a guarantee of future results. Gross of advisory fee performance does not reflect the deduction of investment advisory fees. Our advisory fees are disclosed in Form ADV Part 2A. Accounts managed through brokerage firm programs usually will include additional fees. Returns are calculated monthly in U.S. dollars and include reinvestment of dividends and interest. The index is unmanaged and does not take into account fees, expenses, and transaction costs. It is shown for comparative purposes and is based on information generally available to the public from sources believed to be reliable. No representation is made to its accuracy or completeness. Additional disclosures on the material risks and potential benefits of investing in corporate bonds are available on our website: https://www.cambonds.com/disclosure-statements/

i Bloomberg, October 1 2024 “IG PIPELINE: Quiet Start to 4Q After Record September”
ii Barclays FICC Research, September 9 2024 “US Investment Grade Credit Metrics, Q2 24 Update: Staying afloat”
iii The Federal Reserve Board, September 19 2024 “Summary of Economic Projections”
iv Bloomberg, October 1 2024 “World Interest Rate Probability”
v AP News, July 26 2023 “Federal Reserve raises rates for 11th time to fight inflation but gives no clear sign of next move”
vi Thomson Reuters, August 5 2024 “Key US bond yield curve turns positive on recession fears”
vii Bloomberg, October 3 2024 “United States Recession Probability Forecast”

19 Jul 2024

COMENTARIO DEL SEGUNDO TRIMESTRE

El segundo trimestre del año fue similar al primero. Los diferenciales de crédito se mantuvieron en un rango ajustado y los rendimientos obstinadamente más altos de los bonos del Tesoro continuaron siendo una pesadilla para los rendimientos totales. Los inversores han comenzado a aceptar que la vara para un ciclo de flexibilización es alta aunque últimamente los datos han sido más cooperativos para ayudar a la Reserva Federal a alcanzar ese objetivo. Seguimos creyendo que el entorno actual es oportunista para los inversores en bonos pero puede requerir paciencia. El crédito IG probablemente será un carry trade hasta que la Reserva Federal comience a bajar la tasa de referencia. Los rendimientos elevados y los cupones más altos podrían ser una ventaja para los inversores que utilizan los bonos como mecanismo para preservar el capital.

Resumen del segundo trimestre

El diferencial ajustado por opciones (OAS) en el Índice de bonos corporativos de EE. UU. de Bloomberg abrió el segundo trimestre en 90 y cotizó en un ajustado 85 a principios de junio antes de terminar el trimestre con un diferencial de 94. Recordemos que el índice comenzó 2024 con un diferencial de 99 y brevemente llegó a cotizar a 105 a principios de enero antes de comenzar su marcha más ajustada. Los diferenciales se negociaron en una banda estrecha durante el segundo trimestre donde el OAS corporativo para el índice estuvo dentro de un rango de solo 10 puntos básicos durante el período.

Los rendimientos de los bonos del Tesoro continuaron subiendo en el segundo trimestre lo que ha sido la razón principal por la que los rendimientos totales del índice IG fueron modestamente negativos en lo que va del año. Los rendimientos fueron mayores durante el primer trimestre y esa tendencia continuó durante el segundo trimestre.

El siguiente gráfico ilustra dónde estaban los rendimientos de los bonos del Tesoro antes y durante la pandemia de coronavirus: significativamente más bajos en aquel entonces en comparación con el presente.

La emisión corporativa se mantuvo sólida durante el segundo trimestre pero no pudo seguir el ritmo récord del primer trimestre. El volumen de nuevas emisiones en lo que va del año fue de 867.000 millones de dólares al final del segundo trimestre. Hay varias razones detrás del entorno sólido para la emisión y el entusiasmo de las empresas por emitir deuda. Por el lado de la demanda las entradas de capitales para la clase de activos con grado de inversión han sido fuertes con más de 200.000 millones de dólares en fondos de bonos sujetos a impuestos hasta finales de mayo (los datos de flujos de junio aún no estaban disponibles al momento de esta publicación). Además las compañías de seguros han sido fuertes compradores de bonos gracias a los aumentos de las tasas de las primas y los fondos de pensiones han estado asignando fondos a una variedad de clases de activos de renta fija mientras buscan reequilibrar sus carteras para dar cuenta del sólido desempeño de las acciones en 2023 y en el primer semestre de 2024. Los compradores extranjeros también han estado participando en el mercado corporativo estadounidense a medida que el BCE y algunos otros bancos centrales de Europa y otros lugares han comenzado a flexibilizar sus tasas de referencia lo que ha hecho que los bonos denominados en dólares sean más atractivos que los bonos de algunas otras monedas. Desde el punto de vista de los prestatarios aunque los rendimientos totales que pagan son elevados en comparación con el pasado reciente los diferenciales son ajustados. La mayoría de los balances con grado de inversión son lo suficientemente saludables como para pedir prestado a las tasas actuales y el costo de la deuda es razonable y está dentro de los marcos de asignación de capital para muchas empresas más fuertes. Otro factor que impulsa la emisión es la incertidumbre futura: muchos equipos de gestión preferirían pedir prestado fondos ahora en un entorno de volatilidad relativamente baja. Una elección presidencial en Estados Unidos, un potencial ciclo de flexibilización de la Reserva Federal y una economía que podría comenzar a mostrar la tensión de tasas más altas podrían hacer que sea más difícil o costoso acceder a capital en la segunda mitad del año.

Los indicadores crediticios de grado de inversión se mantuvieron sólidos al final del primer trimestre. Los márgenes de EBITDA estuvieron muy cerca de los máximos históricos y el crecimiento del EBITDA siguió siendo positivo aunque a un ritmo más lento que el trimestre anterior. Sin embargo no todo fue color de rosa ya que los saldos de efectivo cayeron ligeramente y el apalancamiento neto aumentó lo que tuvo un impacto negativo en la cobertura de intereses. Nos sentimos satisfechos con la salud del crédito corporativo de IG en términos generales pero como gestores activos buscamos invertir en empresas con indicadores crediticios estables o en mejora y evitamos aquellas que tienen dificultades para obtener resultados.

Actualización de la Reserva Federal: todavía en espera

Las opiniones de los inversores han evolucionado y ahora se encuentran en una posición mucho más realista con respecto a un posible ciclo de flexibilización en comparación con el nivel en el que comenzaron el año. Recordemos que en aquel momento los mercados de futuros de tipos de interés implicaban hasta siete recortes de 25 puntos básicos en las tasas. Las propias proyecciones de la Reserva Federal han sido más pragmáticas que las de los inversores. El consenso medio del gráfico de puntos de la Reserva Federal mostró expectativas de tres recortes de tasas en su actualización de diciembre de 2023 y luego nuevamente en su actualización de marzo de 2024. La Reserva Federal moderó sus expectativas en junio de 2024 con un nuevo ajuste de los puntos que mostró una decisión ajustada entre uno o dos recortes en la segunda mitad de 2024. De los 19 miembros del FOMC ocho esperaban dos recortes, siete proyectaban uno y cuatro creen que no habrá ninguno en absoluto. Los inversores han accedido y los futuros de tipos de interés al final del segundo trimestre mostraban una probabilidad del 56% de un recorte en julio y una probabilidad del 75% de un recorte en diciembre. A la Reserva Federal le encantaría unirse a la lista de bancos centrales que han recortado las tasas que incluye al BCE, Canadá, la República Checa, Hungría, Suecia y Suiza pero este es un FOMC que comprende y aprecia los errores del pasado. Seguimos esperando uno o dos recortes en 2024 aunque cabe señalar que solo quedan cuatro oportunidades para que esto suceda porque el FOMC no se reúne en agosto ni en octubre. Seguimos creyendo que cuanto más espere la Reserva Federal para recortar más probable será que se produzca una desaceleración económica y estamos gestionando la cartera teniendo esto en cuenta.

Cupón versus retorno total

Con la Reserva Federal en un patrón de espera ¿qué significa para el crédito con grado de inversión? Creemos que ha creado un entorno en el que la mayor parte de los rendimientos de los inversores en el corto plazo vendrán en forma de cupones mientras se les paga para esperar el probable inicio de un ciclo de flexibilización y la normalización de la curva de rendimiento. El cupón promedio del índice al final del segundo trimestre fue del 4.2% frente al 3.9% y el 3.6% a finales de junio de 2023 y junio de 2022 respectivamente. Pero esto no cuenta toda la historia ya que el cupón para deuda de vencimiento intermedio que se está emitiendo hoy prácticamente tiene garantizado un cupón más alto que el promedio que es artificialmente bajo debido a la cantidad de deuda que se emitió durante la era de tasas de interés ultrabajas. Una mejor manera de observar el cupón disponible para los inversores en el mercado hoy es utilizar el rendimiento promedio al vencimiento (%YTM) del índice como indicador del cupón. El YTM% promedio terminó el segundo trimestre en 5.48% lo que es una buena aproximación de lo que le costaría a una empresa promedio con calificación de grado de inversión emitir deuda hoy.

Hemos seguido insistiendo en este punto durante los últimos trimestres: como ilustra el gráfico anterior durante la última década ha habido oportunidades limitadas para que los inversores desplieguen capital con estos rendimientos y cupones. En un ejemplo simplificado si un inversor tiene una cartera de bonos con un cupón promedio del 5% y los precios de los bonos en esa cartera no cambian en absoluto durante el año entonces ese inversor obtiene un rendimiento total en un año del 5% en forma de ingresos por cupón. En nuestra opinión un cupón superior al 5% para el crédito IG es muy atractivo y brinda al inversor una buena oportunidad de generar rentabilidades totales positivas a lo largo del tiempo así como un mayor grado de protección contra las caídas que no estaba disponible hace unos años cuando las tasas de interés eran mucho más bajas.

Diferenciales frente a rendimientos

Aunque los rendimientos están cerca del extremo superior de su rango histórico, los diferenciales están cerca del extremo ajustado. Los dos gráficos siguientes muestran el nivel de diferenciales para el índice así como el porcentaje de la parte del rendimiento del índice que está representada por el diferencial de crédito. Por ejemplo, si un inversor compra un bono corporativo con grado de inversión con un diferencial de 100 puntos básicos sobre el Tesoro a 10 años al 4.40% entonces el rendimiento de ese bono corporativo es del 5.40% y el 18.5% de ese rendimiento proviene del diferencial crediticio. Los diferenciales ajustados y los rendimientos elevados de los bonos del Tesoro han creado un entorno en el que una porción relativamente pequeña de la compensación general de los inversores se deriva actualmente del diferencial.

El diferencial de crédito es la compensación que recibe un inversor a cambio de asumir el riesgo crediticio de poseer un bono corporativo en lugar de no asumir ningún riesgo crediticio por poseer el Tesoro subyacente (la tasa libre de riesgo). Hay algunas razones por las que los diferenciales son ajustados hoy en día. En primer lugar las condiciones financieras para los prestatarios con calificación de grado de inversión son buenas y analizamos algunas de esas métricas anteriormente en esta nota. En segundo lugar la tasa de incumplimiento de las empresas con calificación de grado de inversión ha sido históricamente demasiado baja por lo que es típico que los diferenciales sean ajustados cuando la economía está creciendo y los balances corporativos son saludables. Por último un entorno de rendimientos elevados de los bonos del Tesoro puede prestarse a diferenciales de crédito ajustados. Esto se debe a que existe una gran base de compradores en el mercado de grado de inversión que se preocupan más por los rendimientos totales que por los diferenciales. Estos inversores pueden tener un rendimiento fantasma o una tasa de rentabilidad que deben liquidar para una inversión lo que los hace agnósticos respecto de los diferenciales pero más sensibles a los rendimientos. Como gestores de bonos profesionales los diferenciales son muy importantes para nosotros porque los utilizamos para evaluar el valor relativo de los bonos individuales cuando los evaluamos para su compra o venta. Ya sea que le importe la distribución el rendimiento o ambos; la conclusión es que actualmente los inversores están siendo bien compensados por poseer crédito IG en forma de cupones y rendimiento incluso si los diferenciales son ajustados.

Previsión para la segunda mitad

La segunda mitad del año podría ser volátil con varios acontecimientos importantes en el horizonte. Por primera vez en mucho tiempo estamos empezando a ver focos de incertidumbre económica legítima. Por un lado la economía ha sido resiliente. Pero persisten dudas sobre la capacidad de perseverancia económica frente a un ciclo prolongado de ajuste financiero que comenzó en marzo de 2022. El consumidor impulsa la economía estadounidense y ha seguido gastando pero ¿cuánto tiempo podrán seguir haciéndolo ahora que se ha agotado el exceso de ahorro y con una tasa de ahorro actual que ha sido constantemente negativa? Los datos del mercado laboral se han debilitado ligeramente en los últimos meses pero la tasa de desempleo todavía está cerca del extremo inferior de su rango histórico. No somos de los que gritan y no creemos que estemos al borde de un malestar económico pero hoy vemos mucho menos margen de error para la economía que en cualquier otro momento desde antes de 2020. Muchos consumidores se encuentran al límite de su capacidad de protección y un retroceso en los salarios y/o el empleo podría llevar a la economía a una recesión. En este contexto estamos poblando las carteras de inversores en consecuencia y tratando de evitar empresas e industrias que sean de naturaleza discrecional. Seguimos asumiendo riesgos apropiados pero sólo si la compensación es proporcional. Gracias por nuestro continuo interés. Esperamos colaborar con usted mientras navegamos juntos por los mercados crediticios. Como siempre comuníquese con cualquier pregunta o tema de discusión.

Esta información solo tiene el propósito de dar a conocer las estrategias de inversión identificadas por Cincinnati Asset Management. Las opiniones y estimaciones ofrecidas están basadas en nuestro criterio y están sujetas a cambios sin previo aviso al igual que las declaraciones sobre las tendencias del mercado financiero que dependen de las condiciones actuales del mercado. Este material no tiene como objetivo ser una oferta ni una solicitud para comprar, mantener ni vender instrumentos financieros. Los valores de renta fija pueden ser vulnerables a las tasas de interés vigentes. Cuando las tasas aumentan el valor suele disminuir. El rendimiento pasado no es garantía de resultados futuros. El rendimiento bruto de la tarifa de asesoramiento no refleja la deducción de las tarifas de asesoramiento de inversión. Nuestras tarifas de asesoramiento se comunican en el Formulario ADV Parte 2A. En general las cuentas administradas mediante programas de firmas de corretaje incluyen tarifas adicionales. Los rendimientos se calculan mensualmente en dólares estadounidenses e incluyen la reinversión de dividendos e intereses. El índice no está administrado y no considera las tarifas de la cuenta, los gastos y los costos de transacción. Se muestra con fines comparativos y se basa en información generalmente disponible al público tomada de fuentes que se consideran confiables. No se hace ninguna afirmación sobre su precisión o integridad.

La información suministrada en este informe no debe considerarse una recomendación para comprar o vender ningún valor en particular. No hay garantía de que los valores que se tratan en este documento permanecerán en la cartera de una cuenta en el momento en que reciba este informe o que los valores vendidos no hayan sido vueltos a comprar. Los valores de los que se habla no representan la cartera completa de una cuenta y en conjunto pueden representar solo un pequeño porcentaje de las tenencias de cartera de una cuenta. No debe suponerse que las transacciones de valores o participaciones analizadas fueron o demostrarán ser rentables o que las decisiones de inversión que tomemos en el futuro serán rentables o igualarán el rendimiento de la inversión de los valores discutidos en este documento. Como parte de la educación de los clientes sobre la estrategia de CAM podemos proporcionar información de vez en cuando que incluya referencias a tasas y diferenciales históricos. Los ejemplos hipotéticos que hacen referencia al nivel o cambios en las tasas y diferenciales tienen únicamente fines ilustrativos y educativos. No pretenden representar el desempeño de ninguna cartera o valor en particular ni incluyen el impacto de las tarifas y gastos. Tampoco toman en consideración todas las condiciones económicas y de mercado que habrían influido en nuestra toma de decisiones. Por lo tanto las cuentas de los clientes pueden experimentar o no escenarios similares a los mencionados en este documento.

En nuestro sitio web se encuentran disponibles las divulgaciones adicionales sobre los riesgos materiales y los posibles beneficios de invertir en bonos corporativos: https://www.cambonds.com/disclosure-statements/

i Bloomberg, junio 28 2024 “High-Grade Bond Sales on Easter Pause After Record First Quarter”

ii Bloomberg WIRP, marzo 29 2024 “Fed Funds Futures”

iii Bloomberg WIRP, junio 29 2024 “Fed Funds Futures”

iv Raymond James & Associates, junio 28 2024 “Fixed Income Spreads”

v Barclays Bank PLC, junio 13 2024 “US Investment Grade Credit Metrics, Q2 2024 Update: No Concerns”

vi J.P. Morgan, julio 3 2024 “US High Grade Corporate Bond Issuance Review”

vii Bloomberg ILM3NAVG Index, junio 28 2024 “Bankrate.com US Home Mortgage 30 Year Fixed National Avg”
viii CNBC, junio 13 2024 “The Federal Reserve’s period of rate hikes may be over. Here’s why consumers are still reeling”

15 Jul 2024

2024 Q2 Investment Grade Quarterly

Spanish version coming soon

The second quarter of the year was similar to the first. Credit spreads remained in a tight range and stubbornly higher Treasury yields continued to be a thorn in the side of total returns. Investors have begun to accept that the bar for an easing cycle is high though the data has been more cooperative lately in helping the Fed to reach that goal. We continue to believe that the current environment is opportunistic for bond investors but it may require patience. IG credit will likely be a carry trade until the Fed starts to move the policy rate lower. Elevated yields and higher coupons could be a boon for investors that use bonds as a mechanism to preserve capital.

Second Quarter Review

The option adjusted spread (OAS) on the Bloomberg US Corporate Bond Index opened the second quarter at 90 and traded as tight as 85 in early June before finishing the quarter at a spread of 94. Recall that the index began 2024 at a spread of 99 and briefly traded as wide as 105 in early January before it started its march tighter. Spreads traded in a narrow band during the second quarter where the corporate OAS for the index was rangebound to the tune of only 10 basis points during the period.

Treasury yields continued to grind higher in the second quarter which has been the principal reason that year-to-date total returns for the IG index were modestly negative. Yields were higher during the first quarter and that theme continued during the second quarter.

The below chart is illustrative of where Treasury yields were prior to and during the coronavirus pandemic –meaningfully lower back then relative to the present.

Corporate issuance remained strong during the second quarter but could not keep up with the record-breaking pace of the first quarter. Year-to-date new issue volume was $867 billion at the end of the second quarter. There are several reasons behind the robust environment for issuance and companies’ eagerness to issue debt. On the demand side inflows for the investment grade asset class have been strong with over $200bln into taxable bond funds through the end of May (June flow data was not yet available at the time of publication). Additionally, insurance companies have been strong buyers of bonds on the back of premium rate increases and pension funds have been allocating to a variety of fixed income asset classes as they look to rebalance their portfolios to account for strong equity performance in 2023 and the first half of 2024. Foreign buyers have also been participating in the US corporate market as the ECB and some other central banks in Europe and elsewhere have started to ease by cutting their policy rates which has made dollar-denominated bonds more attractive than the bonds of some other currencies. From the standpoint of borrowers although the all-in yields that they are paying are elevated compared to the recent past spreads are snug. Most investment grade balance sheets are healthy enough to borrow at current rates and the cost of debt is reasonable and within capital allocation frameworks for many stronger companies. Another factor driving issuance is future uncertainty: many management teams would rather borrow funds now in a relatively low volatility environment. A US presidential election, a potential Fed easing cycle, and an economy that could start to show the strain of higher rates could make it more difficult or expensive to access capital in the second half of the year.

Investment grade credit metrics remained on solid footing at the end of the first quarter. EBITDA margins were very close to all-time highs and EBITDA growth was still positive albeit at a slower pace than the previous quarter. It wasn’t all rosy though as cash balances fell slightly and net leverage increased which had a negative impact on interest coverage. We feel quite good about the health of IG corporate credit broadly speaking but as an active manager we seek to invest in companies with stable or improving credit metrics and eschew those that are struggling to perform.

Fed Update – Still on Hold

Investor views have evolved and they are now in a much more realistic place with regard to a potential easing cycle relative to where they started the year. Recall that back then interest rate futures markets were implying as many as seven 25bp rate cuts. The Fed’s own projections have been more pragmatic than investors. The Fed dot plot median consensus showed expectations for 3 rate cuts at its December 2023 update and then again at its March 2024 update. The Fed tempered its expectations in June 2024 with a further adjustment to the dots that showed a close call between one or two cuts in the second half of 2024. Out of the 19 FOMC members, eight expected two cuts, seven projected one, and four believe that there will be none at all. Investors have acquiesced and interest rate futures at the end of the second quarter showed a 56% probability of a cut in July and a 75% probability of a cut in December. The Fed would love to join the list of central banks that have cut rates that includes the ECB, Canada, Czech Republic, Hungary, Sweden, and Switzerland but this is a FOMC that understands and appreciates the mistakes of the past. We continue to expect one or two cuts in 2024 although we would note that there are only four opportunities left for this to happen because the FOMC does not meet in August or October. We continue to believe that the longer the Fed waits to cut the more likely it will result in an economic slowdown and we are managing the portfolio with this in mind.

Coupon vs. Total Return

With the Fed in a holding pattern what does it mean for investment grade credit? We believe that it has created an environment where the bulk of investor returns in the near term will come in the form of coupon while they are paid to wait for the likely start of an easing cycle and yield curve normalization. The average coupon on the index at the end of the second quarter was 4.2% up from 3.9% and 3.6% at the end of June 2023 and June 2022 respectively. But this does not tell the whole story as the coupon for intermediate maturity debt that is being issued today is virtually guaranteed to have a higher coupon than the average which is artificially low due to the amount of debt that issued during the era of ultra-low interest rates. A better way to look at the coupon available to investors in the market today is to use the average yield to maturity (YTM%) for the index as a proxy for coupon. Average YTM% finished the second quarter at 5.48% which is a good approximation of what it would cost an average investment grade rated company to issue debt today.

We have beaten the drum on this point for the past few quarters: as the above chart illustrates there have been limited opportunities during the past decade for investors to deploy capital at these yields and coupons. In a simplified example if an investor has a bond portfolio with an average coupon of 5% and the prices of the bonds in that portfolio do not change at all during the year then that investor earns a one-year total return of 5% in the form of coupon income. A coupon above 5% for IG credit is very attractive in our view and provides the investor with a good chance to generate positive total returns over time as well as a higher degree of downside protection that was unavailable a few years ago when interest rates were much lower.

Spreads vs. Yields

Although yields are near the high end of their historical range spreads are near the tight end. The following two charts show the level of spreads for the index as well as the percentage of the portion of the index yield that is represented by credit spread. For example if an investor buys an investment grade corporate bond at a spread of 100 basis points over the 10yr Treasury at 4.40% then the yield for that corporate bond is 5.40% and 18.5% of that yield is from credit spread. Tight spreads and elevated Treasury yields have created an environment where a relatively small portion of an investor’s overall compensation is derived from spread today.

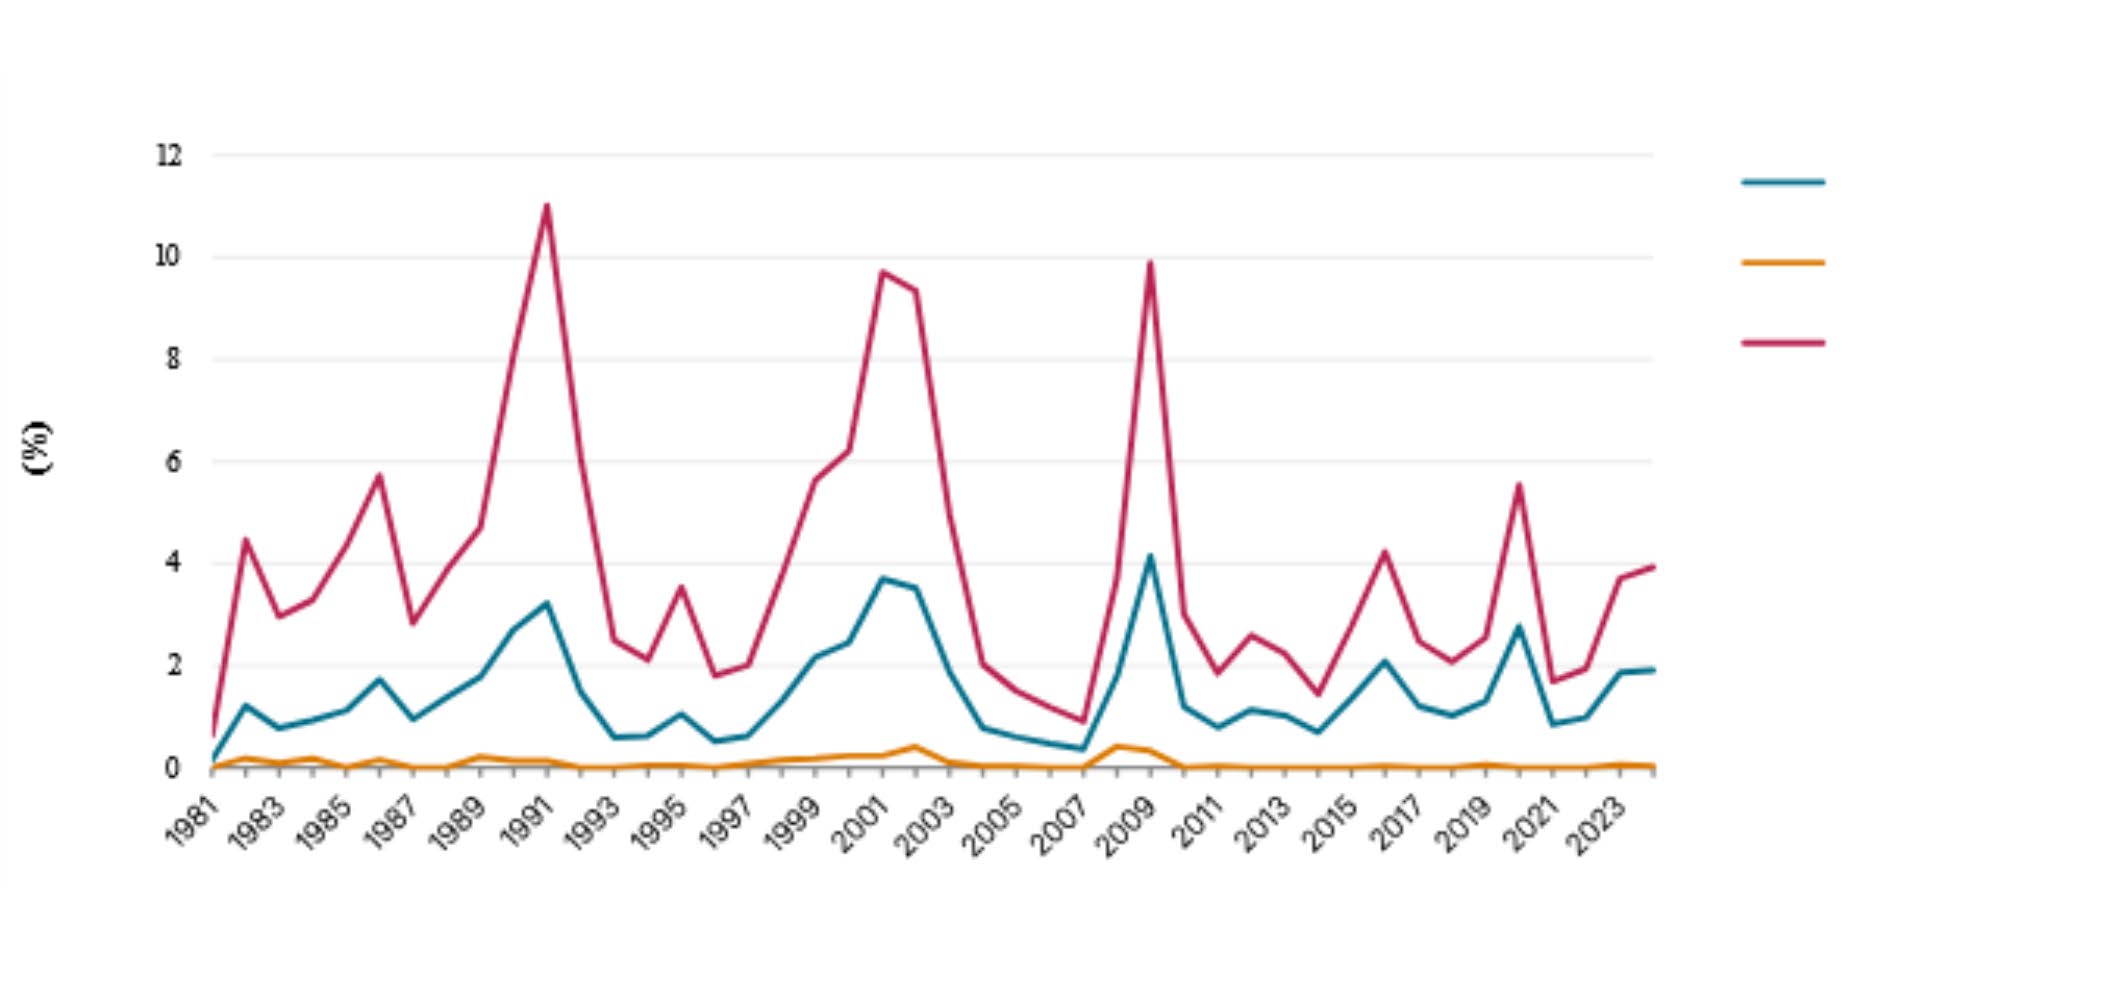
Credit spread is the compensation an investor receives in exchange for taking the credit risk of owning a corporate bond versus taking no credit risk at all for owning the underlying Treasury (the risk-free rate). There are a few reasons that spreads are tight today. First and foremost financial conditions for investment grade rated borrowers are good and we discussed some of those metrics earlier in this note. Secondly, the default rate for investment grade rated companies has historically been exceedingly low so it is typical for spreads to be tight when the economy is growing and corporate balance sheets are healthy. Finally an environment of elevated Treasury yields can lend itself to tight credit spreads. This is because there is a large base of buyers in the investment grade market that care more about all-in yields than they do about spreads. These investors may have a yield bogey or a hurdle rate that they need to clear for an investment making them agnostic about spreads but more sensitive to yields. As professional bond managers spreads are very important to us because we use them to assess the relative value of individual bonds when we evaluate them for purchase or for sale. Whether you care about spread yield or both; the bottom line is that investors are currently being well compensated for owning IG credit in the form of coupon and yield even if spreads are tight.

Second Half Outlook

The second half of the year could be volatile with several big events on the horizon. For the first time in a while we are starting to see pockets of legitimate economic uncertainty. On one hand the economy has been resilient. But questions remain about the ability for economic perseverance in the face of an extended financial tightening cycle that began in March of 2022. The consumer drives the US economy and they have kept spending but how long can they continue to do so now that excess savings have been exhausted and with a current savings rate that has been steadily negative? Labor market data has weakened slightly in recent months but the unemployment rate is still near the low end of its historical range. We are not one to cry wolf and we do not think we are on the brink of economic malaise but we see a lot less room for error today for the economy than at any point since before 2020. Many consumers are stretched with little cushion and a pullback in wages and/or employment could tip the economy into a recession.
Given this backdrop we are populating investor portfolios accordingly and are seeking to avoid companies and industries that are discretionary in nature. We are still taking appropriate risks but only if the compensation is commensurate. Thank you for our continued interest. We look forward to collaborating with you as we navigate the credit markets together. As always please reach out with any questions or topics for discussion.

This information is intended solely to report on investment strategies identified by Cincinnati Asset Management. Opinions and estimates offered constitute our judgment and are subject to change without notice as are statements of financial market trends which are based on current market conditions. This material is not intended as an offer or solicitation to buy hold or sell any financial instrument. Fixed income securities may be sensitive to prevailing interest rates. When rates rise the value generally declines. Past performance is not a guarantee of future results. Gross of advisory fee performance does not reflect the deduction of investment advisory fees. Our advisory fees are disclosed in Form ADV Part 2A. Accounts managed through brokerage firm programs usually will include additional fees. Returns are calculated monthly in U.S. dollars and include reinvestment of dividends and interest. The index is unmanaged and does not take into account fees expenses and transaction costs. It is shown for comparative purposes and is based on information generally available to the public from sources believed to be reliable. No representation is made to its accuracy or completeness.

The information provided in this report should not be considered a recommendation to purchase or sell any particular security. There is no assurance that any securities discussed herein will remain in an account’s portfolio at the time you receive this report or that securities sold have not been repurchased. The securities discussed do not represent an account’s entire portfolio and in the aggregate may represent only a small percentage of an account’s portfolio holdings. It should not be assumed that any of the securities transactions or holdings discussed were or will prove to be profitable or that the investment decisions we make in the future will be profitable or will equal the investment performance of the securities discussed herein. As part of educating clients about CAM’s strategy we may include references to historical rates and spreads. Hypothetical examples referencing the level of, or changes to, rates and spreads are for illustrative and educational purposes only. They are not intended to represent the performance of any particular portfolio or security, nor do they include the impact of fees and expenses. They also do not take into consideration all market and economic conditions that influence our decision-making. Therefore, client accounts may or may not experience scenarios similar to those referenced herein.

Additional disclosures on the material risks and potential benefits of investing in corporate bonds are available on our website: https://www.cambonds.com/disclosure-statements/

i Bloomberg, June 28 2024 “High-Grade Bond Sales on Easter Pause After Record First Quarter”

ii Bloomberg WIRP, March 29 2024 “Fed Funds Futures”

iii Bloomberg WIRP, June 29 2024 “Fed Funds Futures”

iv Raymond James & Associates, June 28 2024 “Fixed Income Spreads”

v Barclays Bank PLC, June 13 2024 “US Investment Grade Credit Metrics, Q2 2024 Update: No Concerns”

vi J.P. Morgan, July 3 2024 “US High Grade Corporate Bond Issuance Review”

vii Bloomberg ILM3NAVG Index, June 28 2024 “Bankrate.com US Home Mortgage 30 Year Fixed National Avg”

viii CNBC, June 13 2024 “The Federal Reserve’s period of rate hikes may be over. Here’s why consumers are still reeling”

06 May 2024

COMENTARIO DEL CUARTO TRIMESTRE

En el primer trimestre del año se produjo una demanda entusiasta de los inversores por bonos corporativos con grado de inversión y diferenciales de crédito más ajustados. El desempeño de los diferenciales se vio contrarrestado por los rendimientos de los bonos del Tesoro, que subieron a lo largo del trimestre a medida que los datos económicos y los mensajes de la Reserva Federal dejaron cada vez más claro que esta sería más deliberada con los recortes de tasas de lo que el mercado había anticipado a principios de 2024. En conjunto, fue un trimestre modestamente negativo en términos de rentabilidad total para el crédito de grado de inversión, pero se trata de una clase de activo que se presta mejor a una visión a más largo plazo. Creemos que el entorno actual presenta una oportunidad. Los elevados rendimientos de los bonos del Tesoro y los sólidos indicadores crediticios en todo el universo de IG tienen el potencial de generar retornos atractivos ajustados al riesgo para los inversores en crédito de IG en un horizonte temporal más largo.

Resumen del primer trimestre

El diferencial ajustado por opciones (Option Adjusted Spread, OAS) en el índice de bonos corporativos de los EE. UU. de Bloomberg abrió el año en 99 y brevemente se negoció más ampliamente durante los primeros 7 días hábiles del año antes de que el estado de ánimo mejorara hasta el punto de que nunca volvería a cotizar barato en su nivel de apertura durante el primer trimestre. El índice cotizó tan ajustado como 88 cerca de finales de marzo, su nivel más estrecho desde noviembre de 2021, antes de terminar el trimestre con un OEA de 90. Quizás el aspecto más sorprendente de este movimiento hacia diferenciales más ajustados es que se produjo en medio de una avalancha récord de oferta de nuevas emisiones, cuando los prestatarios imprimieron $529 mil millones de dólares en nueva deuda corporativa con calificación IG durante el trimestre.

A veces, una gran cantidad de nuevas emisiones en un breve periodo puede tener el efecto de aumentar los diferenciales de crédito a medida que los inversores venden sus participaciones existentes para dejar espacio para asignaciones de nuevas emisiones. Por ejemplo, en 2020 y 2022, cuando la oferta de nuevas emisiones en el primer trimestre superó los $450 millones de dólares, estuvo acompañada de un aumento significativo de los diferenciales de crédito; sin embargo, ese no fue el caso en 2024, ya que la demanda de los inversores fue sólida y los flujos de fondos de IG fueron sólidamente positivos, lo que respaldó diferenciales más ajustados y un mercado sólido para nuevas emisiones.

Pasando a los rendimientos de los bonos del Tesoro, fueron más altos en todos los ámbitos en el primer periodo del año, lo que minó algo de impulso de los rendimientos totales.

Aunque no nos gusta que las tasas suban debido a los obstáculos a corto plazo que esto crea para el rendimiento, creemos que los rendimientos más altos presentan una oportunidad para que los inversores sean compensados por asumir riesgos de duración intermedia. Los rendimientos siguen siendo elevados en relación con el pasado reciente: el rendimiento al vencimiento (Yield To Maturity, YTM) del índice corporativo cerró el primer trimestre en 5.30 %, 180 puntos básicos por encima de su YTM promedio de 3.50 % en los últimos 10 años.

El mercado luchó, pero la Reserva Federal siempre gana

En nuestro comentario de enero escribimos que creíamos que el listón era alto para los recortes de tasas a corto plazo y nuestra opinión sigue siendo la misma. A principios de año, los futuros sobre fondos de la Reserva Federal implicaban siete recortes de tasas de 25 puntos básicos en 2024 para un total del 1.751. Los inversores especularon que el primer recorte se produciría en la reunión de marzo y un recorte adicional en cada reunión posterior (el Comité Federal de Mercado Abierto [Federal Open Market Committee, FOMC] celebra 8 reuniones periódicas al año)2. Esto es lo que estaban descontando los futuros de tasas de interés a principios de enero, a pesar de que en diciembre la Reserva Federal publicó su “Resumen de Proyecciones Económicas” (Summary of Economic Projections, SEP), que incluía el gráfico de puntos que mostraba solo un 0.75 % de recortes de tasas en 2024. Para ser justos, la Reserva Federal tiene cierta responsabilidad por la exuberancia del mercado en enero gracias a su mensaje moderado tras la reunión del FOMC de diciembre.

A medida que avanzaba el primer trimestre, el mercado poco a poco empezó a aceptar la idea de que la Reserva Federal podría actuar con cautela y reducir su tasa de política con más cautela de lo esperado. Como hace cada tres meses, la Reserva Federal emitió un SEP actualizado en su reunión de marzo de 2024, que fue ligeramente más agresivo que el de diciembre, pero aun así mostró recortes de tasas del 0.75 % en 2024. Al final del primer trimestre, los futuros de fondos de la Reserva Federal reflejaron el gráfico de puntos más reciente de marzo, lo que implica una probabilidad del 56.9 % de un recorte en la reunión de junio, con 2 recortes adicionales a seguir en las reuniones de septiembre y diciembre3. En nuestra opinión, esta es una visión mucho más realista de lo que es probable que ocurra. Sin algún tipo de impacto exógeno, o en ausencia de datos que muestren que la economía se está desacelerando de manera significativa, esperamos que la Reserva Federal sea paciente mientras busca aliviar su política restrictiva. Aunque no es nuestro escenario base, creemos que existe una posibilidad razonable de que la Reserva Federal no haga ningún recorte en 2024. Creemos que el resultado más probable es que la Reserva Federal aplique uno o dos recortes de 25 puntos básicos en la segunda mitad del año. La Reserva Federal se enfrenta a un dilema difícil: no puede actuar demasiado rápido ante una economía estadounidense resiliente que sigue creando empleos; pero cuanto más tiempo mantenga las tasas en niveles elevados, mayor será la probabilidad de que la economía caiga en algún tipo de recesión. Tenemos un alto grado de convicción de que a la Reserva Federal le gustaría mucho reducir la tasa de política tan pronto como sea posible, pero no confiamos en que los datos le permitan hacerlo. Por lo tanto, creemos que es más probable que se produzca una recesión modesta antes de finales de 2025 que se deba a una versión ampliada de una política monetaria de “más alto durante más tiempo”.

Valor de la gestión activa

Creemos que una Reserva Federal que esté sesgada hacia la reducción de su tasa de interés oficial es positiva para nuestra estrategia. Somos un gestor intermedio y la mayor parte de nuestra cartera está posicionada en bonos con vencimiento entre 5 y 10 años. Nuestro caso base es el siguiente escenario: la tasa de los fondos de la Reserva Federal disminuye con el tiempo, mientras que los bonos del Tesoro con vencimientos entre 2 y 5 años disminuyen en conjunto; al mismo tiempo, los bonos del Tesoro intermedios que vencen en 5 a 10 años regresan a un nivel normalizado con pendiente ascendente. Este escenario permitiría que la curva de rendimiento recuperara parte de su inclinación clásica y la cartera de CAM se beneficiaría del efecto de “reducción” a medida que los bonos bajan por la curva de rendimiento, acercándose poco a poco al vencimiento cada día que pasa.

El gráfico anterior se remonta a 20 años atrás, hasta finales del primer trimestre de 2024. Como puede ver, la curva del Tesoro 5/10 es casi siempre positiva y ha promediado 56.6 puntos básicos (basis points, bp) de inclinación durante ese periodo en relación con su nivel de cierre de -1 pb a finales de marzo. Si se compra un bono a 10 años con la intención de conservarlo durante 5 años antes de venderlo, y la curva del Tesoro 5/10 promedia 50 bp durante ese periodo, el bono producirá 10 bp de compensación de manera anual en forma de reducción. Las curvas no son estáticas y, en nuestra opinión, se entienden mejor en términos de promedios.

Cuando se habla de crédito IG, es importante recordar que hay dos curvas que deberían interesar a un inversor. Está la curva del Tesoro antes mencionada y luego está la curva de crédito corporativo que cotiza por encima de los bonos del Tesoro; esta es la compensación adicional que recibe un inversor por asumir el riesgo crediticio adicional de poseer un bono corporativo en lugar de un bono del Tesoro. Al igual que las curvas del Tesoro, las curvas de crédito corporativo están en constante evolución y cambian todo el tiempo, por lo que pueden presentar oportunidades para el inversor activo. A diferencia de la curva del Tesoro, que puede invertirse, la curva de crédito corporativo casi nunca se invierte, aunque puede invertirse para emisores de bonos específicos de vez en cuando debido a condiciones crediticias o factores técnicos. Los gestores activos eventualmente aprovecharán estas inversiones hasta que dejen de existir.

Al final del primer trimestre, la curva de crédito corporativo típica para las empresas con calificación A que estamos analizando para nuestras carteras oscilaba entre 20 y 30 puntos básicos, con valores atípicos a ambos ladosiv. Entonces, si elegimos un punto medio de 25 bp, eso significa que un bono a 5 años de un emisor que cotiza con un diferencial de 50/5 años podría esperar que el bono a 10 años de ese mismo emisor se negocie con un diferencial de 75/10 años. Si se comprara un bono a 10 años con la expectativa de venderlo en el plazo de 5 años, produciría 5 bp de reducción del diferencial de crédito por cada año que se mantenga. Esta es solo la compensación que ofrece la curva de crédito corporativo. En entornos normalizados con una curva del Tesoro con pendiente ascendente, la reducción de la curva 5/10 TSY proporcionaría beneficios adicionales además de la compensación recibida de la curva de crédito. Este doble golpe puede amplificar la rentabilidad total, beneficiando a los inversores durante los periodos de curvatura más pronunciada.

Como gestor activo, siempre buscamos formas de maximizar el posicionamiento de los clientes a lo largo de las curvas de crédito y del Tesoro. A veces esto significa que favoreceremos vencimientos más cortos dentro de ese rango de 5 a 10 años y otras veces estaremos en el extremo más largo de ese rango. En algunos entornos, como en el que nos encontramos actualmente, la economía dictará que mantengamos los bonos existentes por más tiempo, hasta que les queden 3 o 4 años hasta su vencimiento, para maximizar la efectividad de una operación de extensión de venta. Aunque vendemos más del 98 % de nuestras participaciones antes del vencimiento, ocasionalmente las matemáticas de los bonos indicarán que es mejor mantener un bono hasta el vencimiento que si lo vendiéramos y compráramos otra cosa. Como gestor activo, nos centramos en el mercado de bonos todo el día, todos los días, evaluando de manera constante las oportunidades y buscando maximizar el valor de la tenencia de cada cliente individual.

Solvencia crediticia: fuerte a bastante fuerte

Nos enorgullecemos de nuestro proceso de investigación ascendente y creemos que es uno de los atributos más importantes que aportamos como gestor. No podemos controlar la dirección de las tasas de interés, pero podemos exhibir un gran control sobre la solvencia crediticia de los bonos de las empresas que incluimos en las carteras de clientes. Las empresas con grado de inversión reciben calificación IG por una razón: sí, las empresas con calificación IG a veces incumplen sus obligaciones de deuda, pero generalmente es un proceso de degradación crediticia que dura varios años y un gestor prudente venderá antes de que se produzca el peor de los casos de incumplimiento; en otras palabras, cuando se analiza el crédito con grado de inversión, no hay muchos bonos malos, pero sí muchos precios malos. Hay muchos bonos en el universo IG que simplemente tienen precios demasiado altos y que no ofrecen una compensación adecuada por unidad de riesgo. Siempre buscamos poblar las carteras de clientes con bonos que estén valorados de manera adecuada en un esfuerzo por reducir la volatilidad y limitar la perspectiva de ampliación de los diferenciales durante periodos difíciles del mercado.

Aunque nos centramos en el análisis de crédito individual, observar las métricas crediticias para el universo IG en su conjunto es instructivo cuando intentamos ilustrar la salud actual del mercado en general y también nos ayuda a juzgar el valor relativo de las oportunidades de inversión. Al final del cuarto trimestre de 2023, las métricas crediticias en todo IG eran sólidas<sup>1</sup>. Los márgenes de ganancias antes de intereses, impuestos, depreciación y amortización (Earnings Before Interest, Taxes, Depreciation, and Amortization, EBITDA) en particular continuaron luciendo impresionantes en relación con la historia y están cerca de máximos históricos, mientras que el crecimiento de EBITDA volvió a ser positivo después de un trimestre de caídas.

El apalancamiento de la deuda neta para el índice IG no financiero se ha mantenido estable durante 5 trimestres consecutivos y ha mejorado desde el primer semestre de 2022. La única métrica crediticia importante que ha disminuido en los últimos trimestres es la cobertura de intereses y eso se debe en gran medida a que las empresas han estado emitiendo nueva deuda con cupones más altos que la deuda que vencíav. En el primer trimestre de 2024, el cupón promedio de las nuevas emisiones de IG fue del 5.33 %, 202 bp más que el cupón promedio de los bonos que vencen, que fue del 3.31 %vi. Para ponerlo en contexto, compare con el 7.24 %, que era la tasa hipotecaria fija promedio a 30 años para un comprador residencial al final del primer trimestre: el costo de capital para las empresas con calificación IG parece muy razonablevii. En pocas palabras, los inversores no necesitan asumir mucho riesgo crediticio o de tasa de interés para generar retornos saludables en el crédito con calificación IG: las métricas crediticias agregadas se encuentran en niveles saludables y el rendimiento del índice es >5 %.

Mirada hacia el futuro

Los últimos años han sido un momento histórico en los mercados crediticios. Desde marzo de 2020 hasta marzo de 2022 experimentamos posiblemente la política de la Reserva Federal más fácil de la historia, con un 0 % de fondos de la Reserva Federal acompañado de un estímulo económico sin precedentes. Luego, la Reserva Federal aumentó su tasa de política 11 veces en 18 meses hasta su rango actual de 5.25 % a 5.5 %, el ritmo más rápido de ajuste en más de 40 añosviii. Una vez más estamos al borde del precipicio de la historia, ya que la Reserva Federal tiene la tarea de terminar la guerra contra la inflación y al mismo tiempo restaurar su tasa de política a un nivel más normativo. Es un entorno de incertidumbre: ¿hacia dónde irá la economía a partir de ahora? Continuaremos centrándonos en nuestro pan de cada día y eso es poblar las carteras de clientes con bonos de empresas que están bien preparadas para navegar en una variedad de entornos económicos. Le agradecemos su interés y su colaboración continua mientras navegamos por el resto del año 2024.

.

Esta información solo tiene el propósito de dar a conocer las estrategias de inversión identificadas por Cincinnati Asset Management. Las opiniones y estimaciones ofrecidas están basadas en nuestro criterio y están sujetas a cambios sin previo aviso, al igual que las declaraciones sobre las tendencias del mercado financiero, que dependen de las condiciones actuales del mercado. Este material no tiene como objetivo ser una oferta ni una solicitud para comprar, mantener ni vender instrumentos financieros. Los valores de renta fija pueden ser vulnerables a las tasas de interés vigentes. Cuando las tasas aumentan, el valor suele disminuir. El rendimiento pasado no es garantía de resultados futuros. El rendimiento bruto de la tarifa de asesoramiento no refleja la deducción de las tarifas de asesoramiento de inversión. Nuestras tarifas de asesoramiento se comunican en el Formulario ADV Parte 2A. En general, las cuentas administradas mediante programas de firmas de corretaje incluyen tarifas adicionales. Los rendimientos se calculan mensualmente en dólares estadounidenses e incluyen la reinversión de dividendos e intereses. El índice no está administrado y no considera las tarifas de la cuenta, los gastos y los costos de transacción. Se muestra con fines comparativos y se basa en información generalmente disponible al público tomada de fuentes que se consideran confiables. No se hace ninguna afirmación sobre su precisión o integridad.

La información suministrada en este informe no debe considerarse una recomendación para comprar o vender ningún valor en particular. No hay garantía de que los valores que se tratan en este documento permanecerán en la cartera de una cuenta en el momento en que reciba este informe o que los valores vendidos no hayan sido vueltos a comprar. Los valores de los que se habla no representan la cartera completa de una cuenta y, en conjunto, pueden representar solo un pequeño porcentaje de las tenencias de cartera de una cuenta. No debe suponerse que las transacciones de valores o participaciones analizadas fueron o demostrarán ser rentables, o que las decisiones de inversión que tomemos en el futuro serán rentables o igualarán el rendimiento de la inversión de los valores discutidos en este documento. Como parte de la educación de los clientes sobre la estrategia de CAM, podemos incluir referencias a tasas y diferenciales históricos. Los ejemplos hipotéticos que hacen referencia al nivel o cambios en las tasas y diferenciales tienen únicamente fines ilustrativos y educativos. No pretenden representar el desempeño de ninguna cartera o valor en particular, ni incluyen el impacto de las tarifas y gastos; tampoco toman en consideración todas las condiciones económicas y de mercado que influyen en nuestra toma de decisiones. Por lo tanto, las cuentas de los clientes pueden experimentar o no escenarios similares a los mencionados en este documento.

En nuestro sitio web se encuentran disponibles las divulgaciones adicionales sobre los riesgos materiales y los posibles beneficios de invertir en bonos corporativos: Enlace de Divulgación de CAM.

i Bloomberg, 28 de marzo de 2024 “High‐Grade Bond Sales on Easter Pause After Record First Quarter” (“Ventas de bonos de alta
calidad en pausa de Pascua después de un primer trimestre récord”)
ii Bloomberg WIRP, 29 de diciembre de 2023 “Fed Funds Futures” (“Futuros de los fondos de la Reserva Federal”)
iii Bloomberg WIRP, 29 de marzo de 2024 “Fed Funds Futures” (“Futuros de los fondos de la Reserva Federal”)
iv Raymond James & Associates, 28 de marzo de 2024 “Fixed Income Spreads” (“Diferenciales de renta fija”)

v Barclays Bank PLC, 13 de marzo de 2024 “US Investment Grade Credit Metrics, Q24 Update: No Concerns” (“Métricas crediticias de
grado de inversión de los EE. UU., actualización del trimestre de 2024: sin preocupaciones”)
vi JP Morgan, 3 de abril de 2024 “US High Grade Corporate Bond Issuance Review” (“Revisión de la emisión de bonos corporativos de
alto grado de los EE. UU.”)
vii Índice Bloomberg ILM3NAVG, 28 de marzo de 2024 “Bankrate.com US Home Mortgage 30 Year Fixed National Avg”
(“Bankrate.com: promedio nacional de la hipoteca de vivienda en los EE. UU. a 30 años fija”)
viii CNBC, 13 de diciembre de 2023 “The Federal Reserve’s period of rate hikes may be over. Here’s why consumers are still reeling”
(“El periodo de subidas de tasas de la Reserva Federal puede haber terminado. Aquí le contamos por qué los consumidores siguen
conmocionados”)

10 Apr 2024

2024 Q1 Investment Grade Quarterly

Click here to read the Spanish version / Haga clic aquí para leer la versión en español

The first quarter of the year saw enthusiastic investor demand for investment grade corporate bonds and tighter credit spreads.  Spread performance was offset by Treasury yields that drifted higher throughout the quarter as economic data and Federal Reserve messaging made it increasingly clear that the Fed would be more deliberate with rate-cuts than what the market had anticipated at the beginning of 2024.  Taking it all together, it was a modestly negative quarter of total returns for IG credit but this is an asset class that best lends itself to a longer term view.  We believe that the current environment presents an opportunity.  Elevated Treasury yields and strong credit metrics across the IG universe have the potential to generate attractive risk-adjusted returns for IG credit investors over a longer time horizon.

First Quarter Review

The option adjusted spread (OAS) on the Bloomberg US Corporate Bond Index opened the year at 99 and it briefly traded wider during the first 7 trading days of the year before the mood improved to the point that it would never again trade cheap to its opening level for the duration of the first quarter.  The index traded as tight as 88 near the end of March, its narrowest level since November 2021, before finishing the quarter at an OAS of 90.  Perhaps the most surprising aspect of this movement toward tighter spreads is that it occurred amid a record breaking deluge of new issue supply as borrowers printed $529 billion in new IG-rated corporate debt during the quarter.i

Sometimes a large amount of new issuance within a small window of time can have the effect of pushing credit spreads wider as investors sell existing holdings to make room for new issue allocations.  For example, in 2020 and 2022, when 1Q new issue supply exceeded $450mm, it was accompanied by a meaningful move wider in credit spreads. However, that was not the case in 2024 as investor demand was robust and IG fund flows were solidly positive which was supportive of both tighter spreads and a robust market for new issuance.

Moving on to Treasury yields, they were higher across the board in the first period of the year which sapped some momentum from total returns.

Although we don’t like to see rates move higher because of the short term headwinds it creates for performance, we think that higher yields present an opportunity for investors to be compensated for taking intermediate duration risk.  Yields remain elevated relative to the recent past –the yield to maturity (YTM) for the Corporate Index closed the first quarter at 5.30% which was 180 basis points higher than its average YTM of 3.50% over the past 10 years.

The Market Fought, but the Fed Always Wins

In our January commentary we wrote that we believed that the bar was high for near term rate cuts and our view remains the same.  At the beginning of the year Fed Funds Futures were implying seven 25bp rate cuts in 2024 for a total of 1.75%.  Investors speculated that the first cut would occur at the March meeting with an additional cut at every meeting thereafter (the FOMC holds 8 regularly scheduled meetings per year).ii  This is what interest rate futures were pricing in early January despite the fact that in December the Fed released its “Summary of Economic Projections” (SEP) which included the dot plot showing just 0.75% worth of rate cuts in 2024.  To be fair, the Fed bears some responsibility for the market exuberance in January thanks to its dovish messaging on the heels of the December FOMC meeting.

As the first quarter wore on, the market slowly came around to the idea that the Fed may tread lightly, decreasing its policy rate more cautiously than expected.  As it does every three months, the Fed issued an updated SEP at its March 2024 meeting which was slightly more hawkish than the December release but it still showed 0.75% worth of rate cuts in 2024.  At the end of the first quarter, Fed Funds Futures mirrored the most recent March dot plot implying a 56.9% chance of a cut at the June meeting with 2 additional cuts to follow at the September and December meetings.iii  This is a much more realistic view of what is likely to occur in our opinion.  Without some kind of exogenous shock, or in the absence of data that shows that the economy is significantly slowing, we expect that the Fed will be patient as it looks to ease restrictive policy.  Although it is not our base case, we think that there is a reasonable chance that the Fed may not cut at all in 2024.  We think that the most likely outcome is that the Fed will deliver one or two 25bp cuts in the second half of the year.  The Fed faces a difficult conundrum –it cannot move too quickly in the face of a resilient U.S. economy that is still creating jobs; but the longer it keeps rates at elevated levels, the greater the probability that it tumbles the economy into some type of recession.  We have a high degree of conviction that the Fed would very much like to decrease the policy rate as soon as it possibly can but we lack confidence that the data will allow them to do so.  Therefore, we believe that a modest recession before the end of 2025 is more likely than not due to an extended version of “higher for longer” monetary policy.

Value of Active Management

We believe that a Fed that is biased toward decreasing its policy rate is a positive for our strategy.  We are an intermediate manager with the bulk of our portfolio positioned in bonds that mature in 5 to 10 years.  Our base case is the following scenario: The Federal Funds rate decreases over time while Treasuries that range in maturity from 2 to 5 years decrease in concert.  At the same time intermediate Treasuries that mature in 5 to 10 years move back toward a normalized upward sloping level.  This scenario would allow the yield curve to regain some of its classical steepness and CAM’s portfolio would benefit from the “roll-down” effect as bonds move down the yield curve, inching closer to maturity with each passing day.

The above chart goes back 20 years from the end of the first quarter of 2024.  As you can see, the 5/10 Treasury curve is almost always positive and it has averaged 56.6bps of steepness over that time period relative to its closing level of -1bp at the end of March.  If a 10-year bond is purchased with the intention of holding it for 5 years before selling, and the 5/10 Treasury curve averages 50bps over that period, the bond will yield 10bps of compensation annually in the form of roll-down.  Curves are not static and in our opinion are best understood in terms of averages.

When discussing IG credit it is important to remember that there are two curves an investor should care about.  There is the aforementioned Treasury curve and then there is the corporate credit curve that trades on top of Treasuries.  This is the extra compensation that an investor receives for taking the additional credit risk of owning a corporate bond over a Treasury bond.  Like Treasury curves, corporate credit curves are ever evolving and changing all of the time, thus they can present opportunity for the active investor.  Unlike the Treasury curve, which can invert, the corporate credit curve is almost never inverted, though it can be inverted for specific bond issuers in spots from time to time due to credit conditions or technical factors.  Active managers will eventually take advantage of these inversions until they no longer exist.

At the end of the first quarter the typical corporate credit curve for the A-rated companies that we are looking at for our portfolios ranged from 20 to 30 basis points with outliers on either side of that.iv  So if we pick a midpoint of 25bps then that means a 5-year bond of an issuer that trades at a spread of 50/5yr could expect to see the 10-year bond for that same issuer trade at a spread of 75/10yr.  If a 10-year bond were purchased with the expectation of selling it at the 5-year mark, it would yield 5bps of roll-down credit spread compression for each year it is held.  This is just the compensation afforded by the corporate credit curve.  In normalized environments with an upward sloping Treasury curve, roll-down from the 5/10 TSY curve would provide additional benefits on top of compensation received from the credit curve.  This one-two punch can amplify total returns, benefiting investors during periods of curve steepness.

As an active manager we are always looking for ways to maximize client positioning along the credit and Treasury curves.  Sometimes this means we will favor shorter maturities within that 5-10yr band and other times we will be on the longer end of that range.  In some environments, like the one we are in currently, the economics will dictate that we hold existing bonds longer, until they have 3 or 4 years left to maturity in order to maximize the effectiveness of a sale-extension trade.  Although we sell 98%+ of our holdings prior to maturity, occasionally the bond math will indicate that we are better off holding a bond to maturity than we would be if we sold it and bought something else.  As an active manager we are focused on the bond market all day every day constantly evaluating opportunities and looking to maximize the value of each individual client holding.

Creditworthiness: Strong to Quite Strong

We pride ourselves on our bottom up research process and believe it is one of the most important attributes that we bring to the table as a manager.  We cannot control the direction of interest rates but we can exhibit a great deal of control over the credit worthiness of the bonds of the companies that we include in client portfolios.  Investment grade companies are rated IG for a reason –yes, IG-rated companies do sometimes default on their debt obligations, but it is usually a multi-year process of credit degradation and a prudent manager will sell before the worst case of a default comes to fruition.  In other words, when looking at investment grade credit, there are not many bad bonds, but there are a lot of bad prices.  There are many bonds in the IG universe that are simply priced too rich and that do not offer adequate compensation per unit of risk.  We always seek to populate client portfolios with bonds that are appropriately valued in an effort to reduce volatility and limit the prospect of spread widening during difficult market periods.

Although we are focused on individual credit analysis, looking at credit metrics for the IG-universe as a whole is instructive when we are trying to illustrate the current health of the overall market and it also helps us judge the relative value of investment opportunities.  At the end of the 4th quarter of 2023, credit metrics across IG were strong.*  EBITDA margins in particular continued to look impressive relative to history and are near all-time highs while EBITDA growth turned back to positive after a quarter of declines.

Net debt leverage for the non-financial IG index has been stable for 5 consecutive quarters and has improved since the first half of 2022.  The only major credit metric that has declined in recent quarters is interest coverage and that is largely because companies have been issuing new debt with higher coupons than the debt that has been maturing.v  In the first quarter of 2024, the average coupon of IG new issues was 5.33% which was 202bp higher than the average coupon of maturing bonds which was 3.31%.vi  For context, compare that to 7.24% which was the average 30yr fixed mortgage rate for a residential buyer at the end of the first quarter: the cost of capital for IG-rated companies looks very reasonable.vii  Simply put, investors do not need to take a lot of credit risk or interest rate risk to generate healthy returns in IG-rated credit  –aggregate credit metrics are at healthy levels and the index yield is >5%.

Looking Ahead

The last several years have been a historic time in the credit markets.  From March 2020 until March 2022 we experienced arguably the easiest Fed policy in history with 0% Fed Funds accompanied with unprecedented economic stimulus.  Then the Fed increased its policy rate 11 times in 18 months to its current range of 5.25%-5.5% –the fastest pace of tightening in over 40 years.viii  We are at the precipice of history once again as the Fed is tasked with finishing the war against inflation while restoring its policy rate to a more normative level.  It is an environment of uncertainty –where will the economy go from here?  We will continue to focus on our bread and butter and that is populating client portfolios with the bonds of companies that are well poised to navigate a variety of economic environments.  We thank you for your interest and continued partnership as we navigate the balance of 2024.

This information is intended solely to report on investment strategies identified by Cincinnati Asset Management. Opinions and estimates offered constitute our judgment and are subject to change without notice, as are statements of financial market trends, which are based on current market conditions. This material is not intended as an offer or solicitation to buy, hold or sell any financial instrument.  Fixed income securities may be sensitive to prevailing interest rates.  When rates rise the value generally declines.  Past performance is not a guarantee of future results.  Gross of advisory fee performance does not reflect the deduction of investment advisory fees.  Our advisory fees are disclosed in Form ADV Part 2A.  Accounts managed through brokerage firm programs usually will include additional fees.  Returns are calculated monthly in U.S. dollars and include reinvestment of dividends and interest. The index is unmanaged and does not take into account fees, expenses, and transaction costs.  It is shown for comparative purposes and is based on information generally available to the public from sources believed to be reliable.  No representation is made to its accuracy or completeness. 

The information provided in this report should not be considered a recommendation to purchase or sell any particular security.  There is no assurance that any securities discussed herein will remain in an account’s portfolio at the time you receive this report or that securities sold have not been repurchased.  The securities discussed do not represent an account’s entire portfolio and in the aggregate may represent only a small percentage of an account’s portfolio holdings.  It should not be assumed that any of the securities transactions or holdings discussed were or will prove to be profitable, or that the investment decisions we make in the future will be profitable or will equal the investment performance of the securities discussed herein.    As part of educating clients about CAM’s strategy we may include references to historical rates and spreads.  Hypothetical examples referencing the level of, or changes to, rates and spreads are for illustrative and educational purposes only.  They are not intended to represent the performance of any particular portfolio or security, nor do they include the impact of fees and expenses.  They also do not take into consideration all market and economic conditions that influence our decision-making.  Therefore, client accounts may or may not experience scenarios similar to those referenced herein.

Additional disclosures on the material risks and potential benefits of investing in corporate bonds are available on our website: https://www.cambonds.com/disclosure-statements/

i Bloomberg, March 28 2024 “High-Grade Bond Sales on Easter Pause After Record First Quarter”

ii Bloomberg WIRP, December 29 2023 “Fed Funds Futures”

iii Bloomberg WIRP, March 29 2024 “Fed Funds Futures”

iv Raymond James & Associates, March 28 2024 “Fixed Income Spreads”

v Barclays Bank PLC, March 13 2024 “US Investment Grade Credit Metrics, Q24 Update: No Concerns”

vi J.P. Morgan, April 3 2024 “US High Grade Corporate Bond Issuance Review”

vii Bloomberg ILM3NAVG Index, March 28 2024 “Bankrate.com US Home Mortgage 30 Year Fixed National Avg”

viii CNBC, December 13 2023 “The Federal Reserve’s period of rate hikes may be over.  Here’s why consumers are still reeling”

24 Jan 2024

2023 Q4 Investment Grade Quarterly

Click here to read the Spanish version / Haga clic aquí para leer la versión en español

Investment grade credit bounced back in 2023.  The year was a powerful demonstration of spread compression and the benefit of the carry associated with higher interest rates.  For the full year 2023, the option adjust spread (OAS) on the Bloomberg US Corporate Bond Index tightened by 31 basis points to 99 after it opened the year at 130.  Interest rates were volatile during 2023 but Treasury yields at the end of the period finished very close to where they started.  The 10yr Treasury ended 2023 at 3.88% which is exactly where it closed in 2022.  The 2yr and 5yr Treasuries finished 2023 18 and 15 basis points lower from where they started, respectively.

2023 Year in Review

It was a solid year of positive performance for investment grade credit, but there were some bumps along the way.  The Corporate Index was in positive territory for all but 2 trading days during the first nine months of 2023 until higher interest rates took a bite out of returns in the first three weeks of October.  On October 19, the year-to-date total return for the index was at its low for the year, down to -2.53%, which also happens to be the day that the 10 year Treasury closed at 4.99%, its highest level of the current cycle and its highest yield since July of 2007.

From that point in October it was a one-two punch of tighter spreads and lower interest rates which led to higher returns through year end.  The OAS on the index moved from 129 on October 19 to 99 at year end while the 10 year Treasury moved lower from 4.99% to 3.88% over the same time period.  As a result of spread compression and lower interest rates, the Corporate Index posted a +11.33% total return from October 19 through the end of 2023.  What was the catalyst for such a dramatic turnaround in performance in such a short period of time?  We think there are several reasons that investors turned positive on IG credit: cooling inflation, a resilient job market and strong economic growth to name a few.  However, the biggest driver of higher returns, in our view, was the likelihood that the Federal Reserve had reached the end of its current hiking cycle.  The Fed elected to pause at its September, November and December meetings and its messaging at its most recent meeting suggested that it would not hike again.  We have argued throughout the hiking cycle that corporate credit could perform well when it became increasingly clear that the Fed was done raising its policy rate, but the depth and velocity of the 4th quarter rally exceeded our expectations.

As far as spread performance was concerned, 2023 saw tighter spreads across the board.  More than half (4.55%) of the index total return for 2023 (8.52%) was attributable to tighter credit spreads.  Lower quality IG-rated credit led the way, especially as credit spreads compressed in the final two months of the year.  The best performing industries in 2023 were Media & Entertainment and Oil Field Services.  While performance for the laggards was positive, Construction Machinery and Consumer Products were the two largest underperforming industries relative to the Corporate Index.  There were no industries within the investment grade universe that came anywhere close to posting a negative annual total return.

2024 Outlook

We have a positive stance on the investment grade credit market for the year ahead.  The yield of the asset class continues to trade at much higher levels relative to recent history.  The average yield on the Index over the past 10 years was 3.45% and it finished 2023 at 5.06%.  It is not as attractive today as it was during the October rate selloff when the index closed with a yield above 6.4% but the compensation afforded is still meaningfully higher than in the recent past.

Our positive view of the market as described above refers to the “all-in” compensation for IG which is comprised of the underlying Treasury as well as additional compensation that an investor receives for owning a bond in the form of credit spread.  Speaking specifically to the valuation of credit spreads, we are not as positive on spreads as we are on yields given current trading levels and we feel that spreads finished the year near the tighter end of fair value.  Looking at the past 20 years of data, the average spread on the index was 149, although this time period includes the GFC when the spread on the index blew out to >600.  The low was 75 in March of 2005 and the low for the current credit cycle was 80 in 2021.  The spread on the index closed the year at 99 and it is certainly capable of trading sideways at this level for a long period of time and it can even grind tighter from here.  But we want to be realistic with our investors about the upside potential in credit spreads.  We believe that credit spreads are pricing in a relatively high likelihood of a soft landing and any data to the contrary (read: recession) will lead to wider spreads.  The good news is that when you are starting with a >5% yield, there is a comfortable margin of safety available for spread widening while still generating positive total returns.  We would also point out that most recessions are accompanied by a move lower in Treasury yields which could serve to offset wider credit spreads.

We have a favorable view of the general health of the credit market and we believe that strong credit metrics are compelling from the standpoint of risk reward.  Although peak credit metrics of the current cycle occurred at the end of 2021, the creditworthiness of the IG credit market as a whole is stable and even showing improvement by some measures.i  According to research compiled by Barclays, at the end of the third quarter 2023, net leverage for the index was 2.8x, EBITDA margins were 29.6% and interest coverage was 12.7x.1  While leverage and interest coverage were not quite as good as they have been in recent years, they were both at very reasonable levels, showing recent improvement while EBITDA margins have been remarkably stable and were only 0.4% from all-time highs.  With few exceptions, investment grade rated companies are in very good shape.

Portfolio Positioning

We focus on the management of credit risk through a bottom up research process; so although we have a macro-view, we spend most of our time thinking about how that broader view may impact individual holdings within client portfolios.  As a reminder, we structure each separately managed account in the following manner.

  • Diversification: Each individual client or institutional portfolio is initially populated with approximately 20-25 positions. We diversify portfolios by seeking to limit each account to a 20% exposure at the sector level and 15% at the individual industry level, with the exception of the Financial Institutions (Finance) sector.  For Finance we limit each account to a 30% exposure because it represents a large portion of the IG index with a 32.97% index weighting at the end of 2023.
  • Credit Quality: One of the biggest differentiators between CAM’s portfolio and the Index is our bias toward higher quality credit in that we look to cap each client account at a 30% exposure to BAA-rated bonds. The Index had a 47.14% weighting in BAA-rated credit at the end of 2023 and this figure for the Index has been >50% several times in recent years –this leaves CAM’s portfolio with meaningfully less exposure to lower rated credit relative to the Index.
  • Maturity: We will always seek to position the portfolio within an intermediate maturity band that ranges from 5-10 years. Occasionally you will find that we will hold some shorter maturities that mature in less than 5 years. This is especially true during the current environment where certain portions of the Treasury curve are inverted –we want to be patient and allow more time for our sale and extension trades to become economic.  We will also occasionally purchase a bond that matures in >10 years but this is not typical and any such purchase will not be materially longer than 10 years. During the invest-up phase we will typically populate new portfolios with maturities that range in tenor from 8-10 years.  As an account becomes seasoned we will look to sell bonds at ~5 years left to maturity and then we will redeploy those sale proceeds back into ~10 year maturities.  As a result of our intermediate positioning, at year end 2023 our composite had a modified duration of 5.4 relative to the Index duration of 7.3.

The mission of our Investment Grade Strategy is to provide our clients with superior risk adjusted returns.  Our goal is to minimize volatility by incurring less credit risk and less interest rate risk than the Index.

Fed Watching

In his prepared remarks following the December FOMC meeting, Chair Powell said that “…our policy rate is likely at or near its peak for this tightening cycle.”ii  While he did not specifically rule out additional rate increases it has become increasingly clear that the Fed is unlikely to hike again.  Now all attention has turned to the Fed rate-cut narrative which is sure to dominate the business news cycle in 2024.  The most recent version of the Fed “dot plot” that was released at its December meeting showed that central bankers expect 0.75% of rate cuts in 2024.  One way to look at this is if the Fed moves in 25bps increments then it is expecting to cut rates three times during the year.  It is worth noting that the dot plot is simply the best estimate at a given point in time and it does not necessarily mean that the consensus estimate will come to fruition.  For example, the dot plot that was released at the September 2023 meeting showed that there would be one additional 25bp rate increase in 2023 but that did not occur.

The Fed made a splash at its December meeting with its dovish commentary.  One measure we track to gauge market perception is The Goldman Sachs Financial Conditions Index which is a weighted average of short and long-term interest rates, the value of the $USD, credit spreads and the ratio of equity prices to the 10-year average of EPS.

As you can see from the above chart, conditions were tightening rapidly in September and October before they just as quickly started to ease beginning with the November 1 FOMC meeting and then again at the December 13 meeting (denoted by the vertical line on the chart).  We do not think it was necessarily a policy mistake but believe that the December press conference was a missed opportunity for Chairman Powell to push back against easing financial conditions, which ended 2023 near the most comfortable levels of the year.  The U.S. economy added 4.8mm jobs in 2022 and another 2.7mm jobs in 2023.iii  We believe that the bar for near term rate cuts is quite high unless the economy experiences a proportional slowing of job growth in 2024.

This brings us to our final thought with regard to Fed policy.  The target range for Fed Funds was 5.25%-5.5% at year end and the Effective Fed Funds rate per data compiled by the New York Fed was 5.33% at the end of 2023.  A 75bp move on an effective rate of 5.33% is a percentage decrease of 14%.  We question whether the prospect of a move of just 14% is really enough to sustain the exuberance that risk assets experienced in the final two months of 2023.  We think that, regardless of what it says, this Fed is determined to avoid repeating the mistakes of the past and that it must have the utmost confidence that inflation will settle at its 2% target before it starts to really move the needle with rate cuts.  The best way for the Fed to accomplish this is to keep its policy rate “higher for longer.”  An extended period of elevated rates is not necessarily a bad thing for bonds nor is it bad for IG-rated companies with good balance sheets but it could present a headwind for equities and certain sectors of the economy such as commercial real estate.  Ultimately we believe “higher for longer” diminishes the prospect of a soft landing and increases the probability that the economy will enter a recession near the end of 2024 or sometime in 2025.  The timing of such a call is always the most difficult part.

Moving Forward

Thank you for your continued enthusiasm and support and for trusting us to manage your hard earned capital.  We look forward to collaborating with you in 2024.

This information is intended solely to report on investment strategies identified by Cincinnati Asset Management. Opinions and estimates offered constitute our judgment and are subject to change without notice, as are statements of financial market trends, which are based on current market conditions. This material is not intended as an offer or solicitation to buy, hold or sell any financial instrument.  Fixed income securities may be sensitive to prevailing interest rates.  When rates rise the value generally declines.  Past performance is not a guarantee of future results.  Gross of advisory fee performance does not reflect the deduction of investment advisory fees.  Our advisory fees are disclosed in Form ADV Part 2A.  Accounts managed through brokerage firm programs usually will include additional fees.  Returns are calculated monthly in U.S. dollars and include reinvestment of dividends and interest. The index is unmanaged and does not take into account fees, expenses, and transaction costs.  It is shown for comparative purposes and is based on information generally available to the public from sources believed to be reliable.  No representation is made to its accuracy or completeness. 


The information provided in this report should not be considered a recommendation to purchase or sell any particular security.  There is no assurance that any securities discussed herein will remain in an account’s portfolio at the time you receive this report or that securities sold have not been repurchased.  The securities discussed do not represent an account’s entire portfolio and in the aggregate may represent only a small percentage of an account’s portfolio holdings.  It should not be assumed that any of the securities transactions or holdings discussed were or will prove to be profitable, or that the investment decisions we make in the future will be profitable or will equal the investment performance of the securities discussed herein.


Additional disclosures on the material risks and potential benefits of investing in corporate bonds are available on our website:
https://www.cambonds.com/disclosure-statements/

i Barclays Bank PLC, December 11 2023 “US Investment Grade Credit Metrics, Q3 23 Update: Stable”

ii Federal Reserve System Board of Governors Chairman Jerome H. Powell News Conference, December 13 2023 “Federal Reserve System”

iii The Wall Street Journal, January 5 2024 “Job Gains Picked Up in December Capping Year of Healthy Hiring”

20 Jan 2024

COMENTARIO DEL CUARTO TRIMESTRE

El crédito con grado de inversión se recuperó en 2023.  El ejercicio fue una fuerte demostración de la reducción de los diferenciales y del beneficio residual asociado con altas tasas de interés.  Para todo el año 2023, el diferencial ajustado por opciones (OAS) en el índice de bonos corporativos de EE. UU. de Bloomberg se redujo en 31 puntos básicos a 99 después de haber abierto el año en 130.  Las tasas de interés fueron volátiles durante 2023, pero el rendimiento de los bonos del Tesoro al final del período terminó muy cerca de donde comenzó.  Los bonos del Tesoro a 10 años terminaron 2023 en 3,88 %, que es el mismo número con el que cerraron en 2022.  Los bonos del Tesoro a 2 y 5 años terminaron 2023 con una disminución de 18 y 15 puntos básicos, respectivamente, respecto de donde empezaron.

Año 2023 en revisión

Se trató de un año sólido con rendimiento positivo para el crédito con grado de inversión, aunque hubo algunos obstáculos en el camino.  El índice corporativo se mantuvo en territorio positivo durante todas las jornadas bursátiles de los primeros nueve meses de 2023, salvo por dos días, hasta que las tasas de interés más altas afectaron la rentabilidad en las tres primeras semanas de octubre.  El 19 de octubre, la rentabilidad total del último año para este índice estuvo en su punto más bajo, con una disminución de -2,53 %, lo que coincidió con el día en que el bono del Tesoro a 10 años cerró en 4,99 %, su nivel más alto del ciclo actual y su rendimiento más alto desde julio de 2007.

Desde ese punto en octubre se produjo un doble impacto de diferenciales más ajustados y tasas de interés más bajas, lo que se tradujo en rentabilidades más altas hacia fin de año.  El OAS del índice bajó de 129, el 19 de octubre, a 99, a fin de año, mientras que el bono del Tesoro a 10 años descendió de 4,99 % a 3,88 % durante el mismo período.  Como resultado de la reducción de los diferenciales y la disminución de las tasas de interés, el Índice corporativo registró una rentabilidad total de +11,33 % entre el 19 de octubre y finales del año 2023.  ¿Cuál fue el catalizador de un cambio de rumbo tan drástico en el rendimiento en tan poco tiempo?  Creemos que existen varias razones para que los inversores volvieran positivo el crédito con grado de inversión: una inflación controlada, un mercado de empleo resiliente y un crecimiento económico sólido, por nombrar algunas.  Sin embargo, en nuestra opinión, el mayor impulsor del aumento del rendimiento fue la probabilidad de que la Reserva Federal hubiera llegado al final de su actual ciclo de subidas.  La Reserva Federal optó por hacer una pausa en sus reuniones de septiembre, noviembre y diciembre, y en su comunicado de la reunión más reciente, se sugirió que no habría más subidas.  A lo largo del ciclo de subidas, hemos argumentado que el crédito corporativo podría tener un buen desempeño cuando quedara más claro que la Reserva Federal había concluido con su política de suba de tasas, pero la profundidad y velocidad del repunte del cuarto trimestre superó nuestras expectativas.

En lo que respecta al rendimiento del diferencial, 2023 fue testigo de diferenciales más ajustados en todos los ámbitos.  Más de la mitad (4,55 %) de la rentabilidad total del índice para 2023 (8,52 %) se pudo atribuir a diferenciales de crédito más ajustados.  El crédito con calificación de grado de inversión (IG) de menor calidad lideró el camino, especialmente a medida que se redujeron los diferenciales de crédito durante los últimos dos meses del año.  Las industrias con un mejor rendimiento en 2023 fueron la de Medios y Entretenimiento y Servicios de Yacimientos Petrolíferos.  Si bien el rendimiento para los rezagados fue positivo, Maquinaria de Construcción y Productos de Consumo fueron las dos industrias más rezagadas en relación con el índice corporativo.  No hubo ninguna industria del universo con grado de inversión que se acercara lo más mínimo a un registro de rentabilidad total anual negativa.

Perspectiva para el 2024

Tenemos una postura positiva sobre el mercado de crédito con grado de inversión para el año entrante.  El rendimiento de esta clase de activos continúa cotizando a niveles mucho más elevados en relación con la historia reciente.  El rendimiento promedio del Índice durante los últimos 10 años fue de 3,45 % y finalizó a 5,06 % en 2023.  No es atractivo hoy en día como lo era durante la liquidación de tasas de octubre cuando el índice cerró con un rendimiento superior a 6,4 %, pero la compensación ofrecida sigue siendo significativamente más alta que en el pasado reciente.

Nuestra visión positiva del mercado, según lo descrito anteriormente, se refiere a la compensación “total” para IG que está compuesta por el Tesoro subyacente, así como una compensación adicional que recibe el inversor por la tenencia de un bono en forma de diferencial de crédito.  Hablando específicamente de la valoración de los diferenciales de crédito, no tenemos una visión tan positiva sobre los diferenciales cuando prestamos atención a los rendimientos producidos con los niveles actuales de negociación, y creemos que los diferenciales terminaron el año cerca del extremo más ajustado del valor de mercado.  Si observamos los últimos 20 años de datos, el diferencial promedio del índice fue de 149, aunque este período incluye la Crisis Financiera Global (GFC) cuando el diferencial del índice se disparó a más de 600.  El punto bajo fue de 75 en marzo de 2005 y el más bajo del ciclo de crédito actual fue de 80 en 2021.  El diferencial del índice cerró el año en 99 y definitivamente es capaz de mantenerse operando lateralmente en este nivel durante un largo período de tiempo e incluso puede ajustarse a niveles más bajos a partir de aquí.  Pero queremos ser realistas con nuestros inversores sobre el potencial alcista de los diferenciales de crédito.  Creemos que los diferenciales de crédito están negociándose con una probabilidad relativamente alta de un impacto controlado, y cualquier dato que indique lo contrario (léase: recesión) provocará diferenciales más amplios.  La buena noticia es que cuando se comienza con un rendimiento superior al 5 %, hay un cómodo margen de seguridad disponible para la ampliación de los diferenciales mientras se generan rendimientos totales positivos.  También señalaríamos que la mayoría de las recesiones están acompañadas por una disminución de los rendimientos de los bonos del Tesoro, lo que podría compensar la ampliación de los diferenciales de crédito.

Tenemos una visión favorable de la salud general del mercado de créditos y creemos que la solidez de las métricas crediticias es convincente desde el punto de vista de la recompensa por el riesgo.  Si bien el punto máximo de las métricas crediticias del ciclo actual se produjo a finales de 2021, la solvencia del mercado de créditos con grado de inversión como un todo es estable e incluso algunas mediciones muestran una mejora.1Fi Según la investigación recopilada por Barclays, a finales del tercer trimestre de 2023, el apalancamiento neto para el índice fue 2,8 veces mayor, los márgenes de EBITDA fueron del 29,6 % y la cobertura de intereses fue de 12,7 veces mayor.a1 Si bien el apalancamiento y la cobertura de intereses no tuvieron tan buen desempeño como en los últimos años, estuvieron dentro de niveles razonables y mostraron una mejora reciente, mientras los márgenes de EBITDA han sido notablemente estables y estuvieron solo un 0,4 % por debajo de los máximos históricos.  Salvo unas pocas excepciones, las compañías calificadas con grado de inversión están en muy buena forma.

Posicionamiento de la cartera

Nos centramos en la gestión del riesgo crediticio a través de un proceso de investigación detallado; así que aunque tengamos una visión macro, pasamos la mayor parte del tiempo pensando en cómo esa visión más amplia puede afectar a las inversiones individuales dentro de las carteras de los clientes.  Como recordatorio, estructuramos cada cuenta individual administrada de la siguiente manera.

  • Diversificación: se ingresan datos iniciales para cada cliente individual o cartera institucional con 20 a 25 posiciones. Diversificamos las carteras buscando limitar cada cuenta a una exposición de 20 % a nivel sectorial y un 15 % a nivel de industria individual, con excepción del sector de Instituciones financieras (Finanzas).  Para el sector de Finanzas, limitamos cada cuenta a una exposición de 30 % porque este sector representa una amplia porción del índice de IG con una ponderación del 32,97 % a finales de 2023.
  • Calidad crediticia: uno de los mayores diferenciadores entre la cartera de CAM y el Índice radica en nuestro sesgo hacia créditos de mayor calidad, en el sentido de que buscamos limitar cada cuenta de cliente a una exposición del 30 % en bonos con calificación BAA. El índice tuvo una ponderación de 47,14 % en créditos con calificación BAA a finales de 2023 y esta cifra ha superado el 50 % varias veces para el índice en los últimos años: esto deja la cartera de CAM con una exposición significativamente menor a créditos de calificación más baja en comparación con el índice.
  • Vencimiento: siempre buscaremos posicionar la cartera dentro de una banda de vencimiento intermedio que oscila entre los 5 y 10 años. Ocasionalmente verá que mantenemos algunos vencimientos más cortos que vencen a menos de 5 años. Esto se da especialmente durante el entorno actual, donde ciertas partes de la curva del Tesoro están invertidas; queremos ser pacientes y permitir más tiempo para que nuestras operaciones de venta y extensión sean rentables.  Ocasionalmente también adquiriremos un bono con un vencimiento superior a 10 años pero esto no es habitual y una compra de esa naturaleza no tendrá una duración sustancialmente mayor a 10 años. Durante la fase de inversión, normalmente llenaremos nuevas carteras con vencimientos que fluctúan entre los 8 y los 10 años.  A medida que una cuenta se vuelve antigua, buscamos vender los bonos con aproximadamente 5 años de vencimiento y, a continuación, reinvertimos los ingresos de esas ventas en vencimientos de aproximadamente 10 años.  Como resultado de nuestro posicionamiento intermedio, a finales de 2023, nuestro compuesto tuvo una duración modificada de 5,4 en relación con la duración de 7,3 del índice.

La misión de nuestra Estrategia de grado de inversión es proporcionar a nuestros clientes rentabilidades superiores ajustadas al riesgo.  Nuestra meta es minimizar la volatilidad incurriendo en menos riesgo crediticio y menos riesgo de tasas de interés que con el índice.

Vigilancia de la Reserva Federal

En sus comentarios preparados después de la reunión de diciembre del Comité Federal del Mercado Abierto (FOMC), el presidente Powell dijo que “…nuestra tasa de referencia probablemente esté en su punto máximo, o cerca de él, para este ciclo de ajuste”.ii Aunque no descartó específicamente nuevas alzas en las tasas, cada vez está más claro que es improbable que la Reserva Federal vuelva a subirlas.  Ahora toda la atención se ha centrado en el relato del recorte de tasas de la Reserva Federal, lo que seguramente dominará el ciclo de noticias empresariales en 2024.  La versión más reciente del “gráfico de puntos” de la Reserva Federal lanzado en su reunión de diciembre mostró que la banca central espera recortes de 0,75 % en las tasas para 2024.  Una manera de interpretarlo es que si la Reserva Federal opera con aumentos de 25 puntos básicos, se prevén recortes en las tasas tres veces en el año.  Cabe destacar que el gráfico de puntos solo es la mejor estimación en un punto temporal específico y no implica necesariamente que la estimación por consenso se hará realidad.  Por ejemplo, el gráfico de puntos publicado en la reunión de septiembre de 2023 mostró que habría un aumento de 25 puntos básicos adicionales en 2023, pero eso no ocurrió.

La Reserva Federal causó un revuelo con sus comentarios moderados en su reunión de diciembre.  Una medición que rastreamos para evaluar la percepción del mercado es el índice de condiciones financieras de Goldman Sachs, que es un promedio ponderado de tasas de interés a corto y largo plazo, el valor del dólar estadounidense, los diferenciales de crédito y la relación de los precios de las acciones con el promedio de 10 años de las ganancias por acción (EPS).

Como se puede ver en el gráfico anterior, las condiciones se fueron ajustando rápidamente en septiembre y octubre, antes de que empezaran a relajarse rápidamente, comenzando con la reunión del FOMC del 1 de noviembre y nuevamente en la reunión del 13 de diciembre (indicado por la línea vertical del gráfico).  No consideramos que se trate necesariamente de un error de política, pero creemos que la conferencia de prensa de diciembre fue una oportunidad perdida para el presidente Powell de oponerse a la relajación de las condiciones financieras, que terminaron el 2023 cerca de los niveles más cómodos del año.  La economía de Estados Unidos sumó 4.8 millones de empleos en 2022 y otros 2.7 millones en 2023.iii Creemos que el umbral para los recortes de las tasas a corto plazo es bastante alto, a menos que la economía experimente una desaceleración proporcional del crecimiento del empleo en 2024.

Esto nos conduce a nuestra reflexión final respecto de la política de la Reserva Federal.  El margen deseado para los Fondos Federales fue de 5,25 % a 5,5 % al final del año y la tasa efectiva de Fondos Federales, según los datos recopilados por la Reserva Federal de Nueva York, fue del 5,33 % a finales de 2023.  Un movimiento de 75 puntos básicos en una tasa efectiva de 5,33 % supone una disminución porcentual de 14 %.  Nos preguntamos si la perspectiva de un movimiento de apenas el 14 % es realmente suficiente para sostener la exuberancia que experimentaron los activos de riesgo en los últimos dos meses de 2023.  Creemos que, independientemente de lo que digan, esta Reserva Federal tiene la determinación de no repetir los errores del pasado y debe tener la máxima confianza en que la inflación llegará a su objetivo del 2 % antes de comenzar a tener un impacto significativo en los recortes de tasas.  La mejor manera que tiene la Reserva Federal para lograr esto es mantener su tasa de referencia “más alta por más tiempo”. Un período prolongado de tasas elevadas no es necesariamente algo malo para los bonos ni para las empresas con calificación de grado de inversión y balances sólidos, pero podría representar un obstáculo para las acciones y ciertos sectores de la economía, como el mercado comercial de bienes raíces.  En última instancia, creemos que una tasa “más alta por más tiempo” disminuye la posibilidad de un impacto controlado y aumenta la probabilidad de que la economía entre en una recesión cerca del final de 2024 o en algún momento de 2025.  El marco temporal de esta opción siempre es la parte más difícil.

De cara al futuro

Gracias por su continuo entusiasmo y apoyo y por depositar su confianza en nosotros para administrar el capital que tanto esfuerzo les costó ganar.  Ansiamos colaborar con ustedes en 2024.

.

This information is intended solely to report on investment strategies identified by Cincinnati Asset Management. Opinions and estimates offered constitute our judgment and are subject to change without notice, as are statements of financial market trends, which are based on current market conditions. This material is not intended as an offer or solicitation to buy, hold or sell any financial instrument.  Fixed income securities may be sensitive to prevailing interest rates.  When rates rise the value generally declines.  Past performance is not a guarantee of future results.  Gross of advisory fee performance does not reflect the deduction of investment advisory fees.  Our advisory fees are disclosed in Form ADV Part 2A.  Accounts managed through brokerage firm programs usually will include additional fees.  Returns are calculated monthly in U.S. dollars and include reinvestment of dividends and interest. The index is unmanaged and does not take into account fees, expenses, and transaction costs.  It is shown for comparative purposes and is based on information generally available to the public from sources believed to be reliable.  No representation is made to its accuracy or completeness. 


The information provided in this report should not be considered a recommendation to purchase or sell any particular security.  There is no assurance that any securities discussed herein will remain in an account’s portfolio at the time you receive this report or that securities sold have not been repurchased.  The securities discussed do not represent an account’s entire portfolio and in the aggregate may represent only a small percentage of an account’s portfolio holdings.  It should not be assumed that any of the securities transactions or holdings discussed were or will prove to be profitable, or that the investment decisions we make in the future will be profitable or will equal the investment performance of the securities discussed herein.


Additional disclosures on the material risks and potential benefits of investing in corporate bonds are available on our website:
https://www.cambonds.com/disclosure-statements/

i Barclays Bank PLC, December 11 2023 “US Investment Grade Credit Metrics, Q3 23 Update: Stable”

ii Federal Reserve System Board of Governors Chairman Jerome H. Powell News Conference, December 13 2023 “Federal Reserve System”

iii The Wall Street Journal, January 5 2024 “Job Gains Picked Up in December Capping Year of Healthy Hiring”

23 Oct 2023

2023 Q3 Investment Grade Quarterly

Click here to read the Spanish version / Haga clic aquí para leer la versión en español. Investment grade credit spreads were tighter during the third quarter, but Treasury yields moved higher, which acted as a meaningful headwind for returns.  During the quarter, the Option Adjusted Spread (OAS) on the Bloomberg US Corporate Bond Index tightened by 2 basis points to 121 after opening the period at 123.  Intermediate Treasury curves steepened during the period, with relatively little change in the 2yr Treasury, while the 5yr and 10yr Treasury yields moved significantly higher.   Higher rates are bad news for short term returns, but for the long run, curve steepening is something that we like to see as it creates a friendlier environment for bond investors.  Positive sloping curves maximize the efficiency and return potential of a bond rolling down the yield curve as it approaches maturity.

The Corporate Index posted a quarterly total return of -3.09%.  CAM’s Investment Grade Program net of fees total return for the quarter was -2.36%.  Year-to-date total returns remained positive for both the index and CAM through quarter end.

Market Update

The yield to maturity (YTM) for the Bloomberg U.S. Corporate Index ended the quarter at 6.04%.  Here are some statistics to provide context:

  • The 5yr average YTM was 3.48%. The index closed >6% fewer than 0.7% of trading days.
  • The 10yr average YTM was 3.38%. The index closed >6% fewer than 0.4% of trading days.
  • The 15yr average YTM was 3.69%. The index closed >6% fewer than 5.2% of trading days.
  • The 20yr average YTM was 4.12%. The index closed >6% fewer than 7.6% of trading days.

With yields near cycle highs and company fundamentals in solid shape, we think that IG credit offers an attractive value proposition.  We also believe that downside for the asset class is limited at these elevated yields.  Treasury yields could go higher from here or there could be a hard landing that might send credit spreads wider, but the impact of those moves on returns is diminished when the starting point is a >6% yield, which provides meaningful cushion for bond investors.

We believe credit spreads were fairly valued at quarter end.  The OAS on the index finished the quarter at 121 relative to its 5 and 10 year averages of 123 and 124, respectively.  Investors are cautious about the direction of the U.S. economy which is why we believe that further spread tightening from current levels could be difficult.  However, there are a couple of scenarios that could drive spreads tighter: 1.) The yield curve continues to steepen to the point that it is no longer inverted and/or 2.) Inflation continues to decline coincident with a soft landing for the U.S. economy.  There is a third scenario as well, which contemplates a lack of new bond supply into year-end which could create a supply/demand mismatch: if new issuance is insufficient to satisfy investor demand, then secondary spreads could grind tighter in the absence of negative economic data.  Conversely, spreads could go wider if tight monetary policy tips the economy into a recession.  We believe the most likely outcome is that spreads will trade within a relatively tight range until there is more certainty among investors regarding the direction of the economy and inflation expectations.  Bottom line, with elevated Treasury yields and fair compensation for credit risk, we believe investment grade credit remains attractive.

Asset Allocation – Stocks vs. Bonds

Throughout 2023, Treasuries have climbed higher, while equities have continued to chug along, posting impressive returns.  This price action has brought the concept of the equity risk premium (ERP) into to the spotlight.  The ERP is the extra return that an investor earns from stocks compared to bonds for taking additional risk in the equity market.  To put it in mathematical terms, the ERP is the difference between the S&P 500’s earnings yield and the yield on the 10yr Treasury.  The following ERP chart is expressed in terms of basis points.

Currently, the ERP is at its lowest level at any point in the past 20 years.  Does this strengthen the case for investment grade bonds, which earn a spread in excess of the risk free rate?  We think so, but it is worth noting that the ERP can go negative – it was deeply negative for an extended period during the dot-com bubble period of 1998 into early 2001.

Cash Remains Attractive, But Less So

The most frequent question we have continued to field from individual investors over the course of the past year goes something like this.

“Yields at 6% look great to me, but why would I allocate to intermediate corporate bonds when I can buy a 2-year Treasury at 5% or an 18 month CD at 5.25%?”

To be clear, we think that investors should absolutely be taking advantage of dislocation at the front end of the yield curve, but they should not do so at the expense of their longer term goals.  These high short rates are a phenomenon of the Fed hiking cycle and the inverted curve could dissipate quickly when the Fed reverses course.  An investor that over-allocates to the front end of the curve puts themselves at risk of missing out on larger returns slightly further out the curve.  The goal for most investors should be to allocate their portfolio in a manner that benefits from elevated short term rates while maintaining an exposure to the intermediate part of the yield curve so that the portfolio can reap the rewards of a curve that eventually re-steepens from its current inverted state. An investor that waits for the first Fed rate cut or waits for this trade to be obvious could miss out on a lot of low hanging fruit as far as returns are concerned.

The subject of reinvestment risk remains highly topical in our conversations with investors. Please reach out to one of our client consultants if you would like to discuss this further or you can view some of our past content here.

Corporate Credit Curve – A Waiting Game

The corporate credit curve is integral to our strategy at CAM.  The following graph shows the change from the beginning of the year through the end of the third quarter for both the Treasury curve and the corporate yield curve.  Our focus at CAM is on intermediate maturities that range from 5 to 10 years.

Both corporate and Treasury curves have moved much higher so far in 2023.  It is important to note that while the Treasury curve has remained inverted, the corporate curve has maintained its steepness.  For example, even though the 5/10 Treasury curve was inverted by -4bps at quarter end, an investor could expect to earn +21bps in additional yield (on average) by extending from a 5yr corporate bond to a 10yr corporate bond.  This equates to a 5/10 corporate credit curve of +25bps.   For our existing investors, we are currently holding some maturities longer than we would typically – as we are patiently waiting for the corporate credit curve to steepen.  A steeper curve allows us to extract more value for our investors from extension trades.  As the Fed tightening cycle reaches its logical conclusion, we expect steepening in both the underlying Treasury curve and the corporate credit curve.  As these curves steepen, investors that have been with us for some time will start to see us resume our extension trades.  The following graph from the St. Louis Fed provides a good illustration of how much steeper the corporate credit curve has been for most of the past decade relative to where it is today.

The Fed – Are We There Yet?

The Federal Reserve delivered a +0.25% hike at its July meeting, but held rates steady at its September meeting.  The Fed meets two more times this year, the first day of November and again in mid-December.  The FOMC’s dot plot shows an expectation of one more +25bp hike this year and -50bps worth of cuts next year.  At quarter-end, investors were assigning a 39.1% probability of an additional rate hike by year-end according to Fed Funds Futures.

The Fed message has been consistent lately, hammering home the “higher for longer” mantra.  We don’t believe that it is particularly meaningful if the Fed hikes once more or even twice.  Instead, we think bond investors should rejoice at the likelihood that the Fed may finally be near the end of its hiking cycle.

Keep Grinding

It was a quarter to forget for IG credit returns but the longer term value proposition remains.  Even despite massive movement in Treasuries the asset class has remained in positive territory year-to-date.  We will continue to manage your capital to the best of our ability, searching for superior risk adjusted returns amid an increasingly volatile landscape.  Thank you for your continued interest and confidence.

This information is intended solely to report on investment strategies identified by Cincinnati Asset Management. Opinions and estimates offered constitute our judgment and are subject to change without notice, as are statements of financial market trends, which are based on current market conditions. This material is not intended as an offer or solicitation to buy, hold or sell any financial instrument.  Fixed income securities may be sensitive to prevailing interest rates.  When rates rise the value generally declines.  Past performance is not a guarantee of future results.  Gross of advisory fee performance does not reflect the deduction of investment advisory fees.  Our advisory fees are disclosed in Form ADV Part 2A.  Accounts managed through brokerage firm programs usually will include additional fees.  Returns are calculated monthly in U.S. dollars and include reinvestment of dividends and interest. The index is unmanaged and does not take into account fees, expenses, and transaction costs.  It is shown for comparative purposes and is based on information generally available to the public from sources believed to be reliable.  No representation is made to its accuracy or completeness. 


The information provided in this report should not be considered a recommendation to purchase or sell any particular security.  There is no assurance that any securities discussed herein will remain in an account’s portfolio at the time you receive this report or that securities sold have not been repurchased.  The securities discussed do not represent an account’s entire portfolio and in the aggregate may represent only a small percentage of an account’s portfolio holdings.  It should not be assumed that any of the securities transactions or holdings discussed were or will prove to be profitable, or that the investment decisions we make in the future will be profitable or will equal the investment performance of the securities discussed herein.


Additional disclosures on the material risks and potential benefits of investing in corporate bonds are available on our website:
https://www.cambonds.com/disclosure-statements/.