
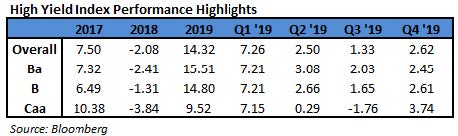
In the first quarter of 2020, the Bloomberg Barclays US Corporate High Yield Index (“Index”) return was ‐12.68%, and the CAM High Yield Composite gross total return was ‐10.03%. The S&P 500 stock index return was ‐19.60% (including dividends reinvested) for Q1. The 10 year US Treasury rate (“10 year”) generally drifted lower throughout the quarter finishing at 0.67%, down 1.25% from the beginning of the quarter.

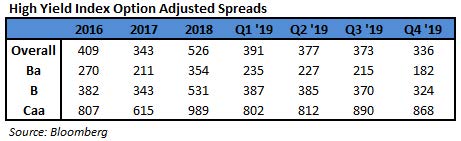
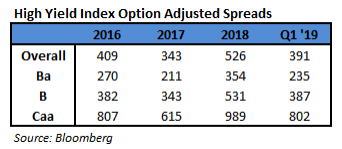
The 10 year did make a record low of 0.54% in early March. That is just one of the many records to take place across markets in 2020. During the quarter, the Index option adjusted spread (“OAS”) widened 544 basis points moving from 336 basis points to 880 basis points. During the first quarter, each quality segment of the High Yield Market participated in the spread widening as BB rated securities widened 472 basis points, B rated securities widened 532 basis points, and CCC rated securities, widened 836 basis points. Take a look at the chart below from Bloomberg to see the eye‐popping visual of the enormous spread move in the Index. The chart displays data for the past five years. Notice the previous ramp in the Index OAS spread from 2015. That ramp took seven months before reaching the peak and topped out around 850 basis points. The ramp‐up this time around happened inside of five weeks and topped out at 1100 basis points. “It sure was a long year this past month,” is a saying that seems to capture the feelings of many across Wall Street as the first quarter closed.

The Utility, Technology, and Insurance sectors were the best performers during the quarter, posting returns of ‐5.06%, ‐5.31%, and ‐5.95%, respectively. On the other hand, Energy, Transportation, and REITs were the worst performing sectors, posting returns of ‐38.94%, ‐20.90%, and ‐16.87%, respectively. At the industry level, wireless, supermarkets, pharma, and food/beverage all posted the best returns. The wireless industry (‐1.04%) posted the highest return. The lowest performing industries during the quarter were oil field services, e&p energy, retail REITs, and leisure. The oil field services industry (‐49.18%) posted the lowest return.

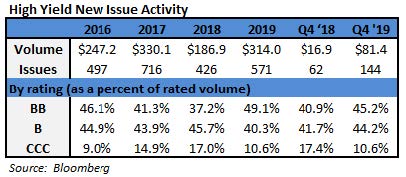
During the first quarter, the high yield primary market posted $81.8 billion in issuance. That is the total issuance including a market that was essentially closed for the month of March. Issuance within Financials was the strongest with almost 23% of the total during the quarter. The last few days of March did see the high yield market begin to open up just a bit for issuance. That was a very encouraging sign to see. We expect that when the issuance door opens some more, there will likely be a flood of companies coming to market to fortify their balance sheets.
The Federal Reserve was very busy during the quarter. They pulled out all the stops by not only dropping the Target Rate to an upper bound of 0.25%, but they passed numerous programs (PMCCF, SMCCF, TALF, MMLF, CPFF, etc.) in order to keep the credit markets functioning. While they may run out of acronyms at some point, they truly are injecting unprecedented amounts of support in the markets. Additionally, after some political wrangling, Congress passed a massive $2 trillion rescue package. The package is very wide reaching and a critical piece of legislation that will go a long way to help support businesses and citizens during such a troubling time.
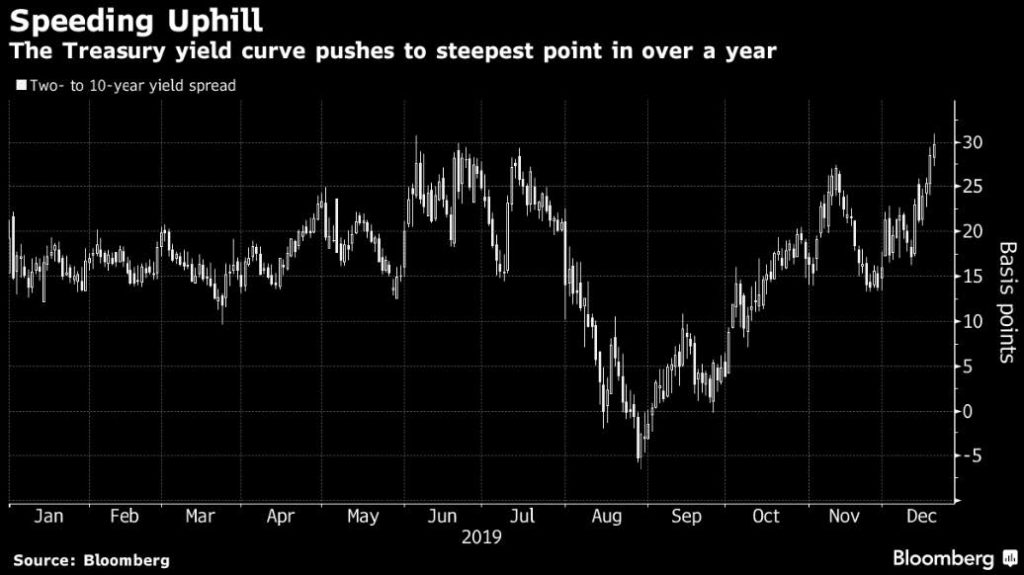
While Target Rate moves tend to have a more immediate impact on the short end of the yield curve, yields on intermediate Treasuries decreased 125 basis points over the quarter, as the 10‐year Treasury yield was at 1.92% on December 31st, and 0.67% at the end of the quarter. The 5‐year Treasury decreased 131 basis points over the quarter, moving from 1.69% on December 31st, to 0.38% at the end of the quarter. Intermediate term yields more often reflect GDP and expectations for future economic growth and inflation rather than actions taken by the FOMC to adjust the Target Rate. There is no doubt that economic reports are going to be quite noisy over the balance of 2020. However, the revised fourth quarter GDP print was 2.1% (quarter over quarter annualized rate), and the current consensus view of economists suggests a GDP for 2020 around ‐1.3% with inflation expectations around 1.3%.
The global pandemic and crumbling oil prices were the main themes in the quarter leading to markets falling at the fastest pace everi. The energy sector was hit especially hard as crude fell from $60 to $20 a barrel. The price drop was due not only to demand destruction caused by the COVID‐19 economic fallout but also a supply side dispute between Russia and Saudi Arabia. An OPEC meeting broke down when Russia wouldn’t agree to production cuts. In a follow‐up move, Saudi Arabia decided that they would not only increase production but slash their selling price as well. The energy market has been reeling ever sinceii. Within high yield, the downgrades have been plentiful and the bankruptcies are beginning to trickle in.

Being a more conservative asset manager, Cincinnati Asset Management is structurally underweight CCC and lower rated securities. This positioning has served our clients well so far in 2020. As noted above, our High Yield Composite gross total return has outperformed the Index over the first quarter measurement period. With the market so weak during the first quarter, our cash position was a main driver of our overall performance. Further, our structural underweight of CCC rated securities was a benefit. Additionally, our underweight positioning in the communications sector was a drag on our performance. While our overweight positioning in energy hurt performance, our credit selections within the midstream industry performed much better than the sector. Unfortunately, our credit selections within the consumer cyclical services, leisure, and auto industries hurt performance. However, our underweight in the transportation sector and our overweight in the consumer non‐cyclical sector were bright spots. Further, our credit selections within the media and healthcare industries were a benefit to performance.

The Bloomberg Barclays US Corporate High Yield Index ended the first quarter with a yield of 9.44%. This yield is an average that is barbelled by the CCC‐rated cohort yielding 17.54% and a BB rated slice yielding 7.24%. Equity volatility, as measured by the Chicago Board Options Exchange Volatility Index (“VIX”), had the proverbial moonshot moving from 14 to a high of 83. For context, the average was 15 over the course of 2019. The first quarter had four issuers default on their debt, and the trailing twelve month default rate was 3.35%iii. Default rates are on the rise and the strategists on Wall Street are already bumping up their forecasts. Fundamentals of high yield companies have been mostly good and will no doubt be tested as we move through 2020. From a technical perspective, supply is still tracking higher than last year at this time even including the March shutdown of the primary market. High yield has certainly had trouble this year; however there are now many more opportunities present in the market than existed just three months ago. For clients that have an investment horizon over a complete market cycle, high yield deserves to be considered in the portfolio allocation.
With the High Yield Market trading at the current elevated spread level, it is important that we exercise discipline and selectivity in our credit choices moving forward. We are very much on the lookout for any pitfalls as well as opportunities for our clients. The market needs to be carefully monitored to evaluate that the given compensation for the perceived level of risk remains appropriate on a security by security basis. It is important to focus on credit research and buy bonds of corporations that can withstand economic headwinds and also enjoy improved credit metrics in a stable to improving economy. As always, we will continue our search for value and adjust positions as we uncover compelling situations. Finally, we are very grateful for the trust placed in our team to manage your capital through such an unprecedented time.
This information is intended solely to report on investment strategies identified by Cincinnati Asset Management. Opinions and estimates offered constitute our judgment and are subject to change without notice, as are statements of financial market trends, which are based on current market conditions. This material is not intended as an offer or solicitation to buy, hold or sell any financial instrument. Fixed income securities may be sensitive to prevailing interest rates. When rates rise the value generally declines. Past performance is not a guarantee of future results. Gross of advisory fee performance does not reflect the deduction of investment advisory fees. Our advisory fees are disclosed in Form ADV Part 2A. Accounts managed through brokerage firm programs usually will include additional fees. Returns are calculated monthly in U.S. dollars and include reinvestment of dividends and interest. The index is unmanaged and does not take into account fees, expenses, and transaction costs. It is shown for comparative purposes and is based on information generally available to the public from sources believed to be reliable. No representation is made to its accuracy or completeness.
i Wall Street Journal March 24, 2020: “Markets Melt Down at Fastest Pace Ever”
ii Wall Street Journal April 1, 2020: “Price War Batters OPEC’s Weak”
iii JP Morgan April 1, 2020: “Default Monitor”


 The Finance Companies, Energy, and Utilities sectors were the best performers during the quarter, posting returns of 9.00%, 8.27%, and 7.81%, respectively. On the other hand, Other Financial, Insurance, and Transportation were the worst performing sectors, posting returns of 5.12%, 6.33%, and 6.34%, respectively. At the industry level, refining, oil field services, pharma, and supermarkets all posted the best returns. The refining industry (12.20%) posted the highest return. The lowest performing industries during the quarter were retail REITs, office REITs, airlines, and life insurance. The retail REIT industry (2.86%) posted the lowest return.


 The Federal Reserve held two meetings during Q2 2018. The Federal Funds Target Rate was raised at the June 13
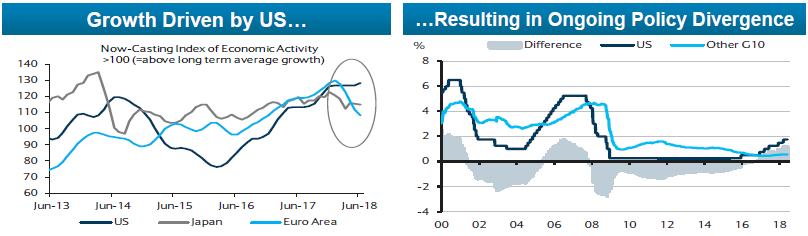
 While the Fed continues a less accommodative posture, other Central Banks aren’t necessarily following suit. The Bank of Japan is still buying an annualized JPY45 trillion of Japanese Government Bonds (“JGB’s”) and targeting a JGB yield of 0%.

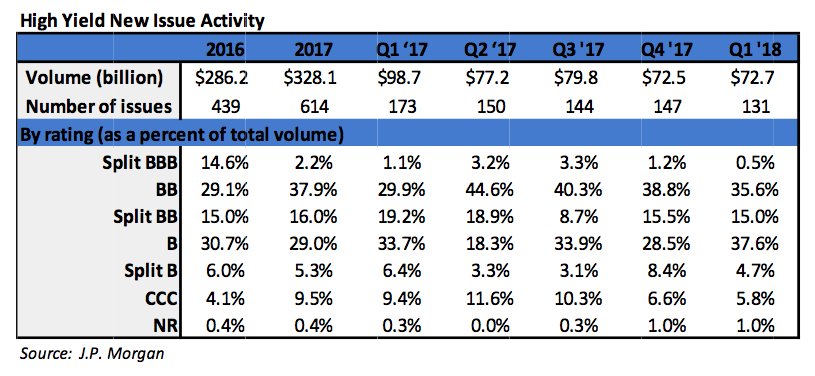 During the first quarter, the high yield primary market posted $72.7 billion in issuance. Importantly, almost three‐quarters of the issuance was used for refinancing activity. That was the highest level of refinancing since 2009. Issuance within Energy comprised just over a quarter of the total issuance. The 2018 first quarter level of issuance was relative to the $98.7 billion posted during the first quarter of 2017. The full year issuance for 2017 was $328.1 billion, making 2017 the strongest year of issuance since the $355.7 posted in 2014.
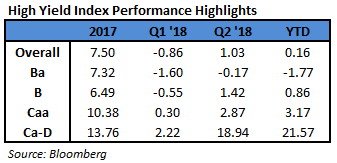
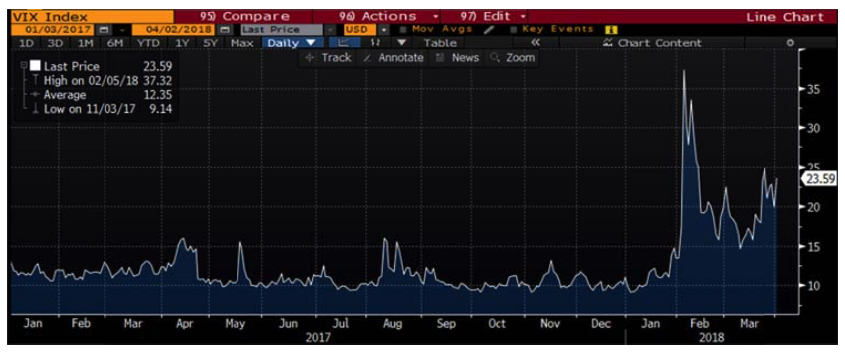 The chart to the left is sourced from Bloomberg and is the Chicago Board Options Exchange Volatility Index (“VIX”). The VIX is a market estimate of future volatility in the S&P 500 equity index. It is quite clear that the market has entered a period of higher volatility. In fact, the equity market through the first quarter of 2018 is already much more volatile than all of 2017 as measured by the number of positive and negative 1% days.iv In addition to the volatility witnessed throughout the markets during the first quarter, there have been a few transitions in high profile government posts as well. Jerome Powell began a four‐year term as Chair of the Federal Reserve following the end of Janet Yellen’s single term in that role; economist Larry Kudlow succeeded to director of the National Economic Council after Gary Cohn’s resignation; and Mike Pompeo and John Bolten were nominated as Secretary of State and National Security Adviser, respectively, after Rex Tillerson and HR McMaster were dismissed from the roles.
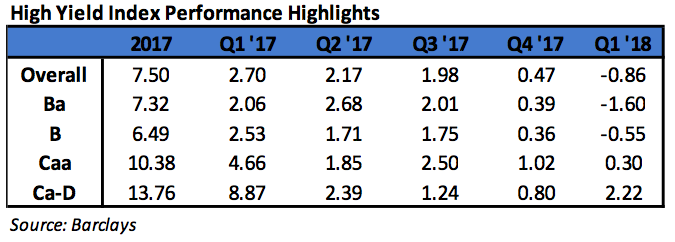 Being a more conservative asset manager, Cincinnati Asset Management remains significantly underweight CCC and lower rated securities. For the first quarter, that focus on higher quality credits was a detriment as our High Yield Composite gross total return underperformed the return of the Bloomberg Barclays US Corporate High Yield Index (‐1.83% versus ‐0.86%). The higher quality credits that were a focus tended to react more negatively to the interest rate increases. This was an additional consequence also contributing to the underperformance. Our credit selections in the food & beverage and home construction industries were an additional drag on our performance. However, our credit selections in the cable & satellite and leisure industries were a bright spot in the midst of the negative first quarter return.


