Category: High Yield Quarterly

14 Jan 2025

2024 Q4 High Yield Quarterly

January 2025

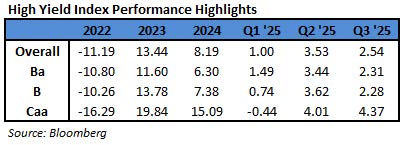
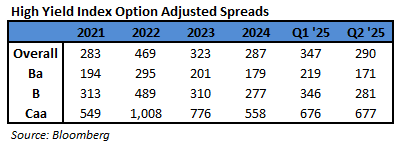
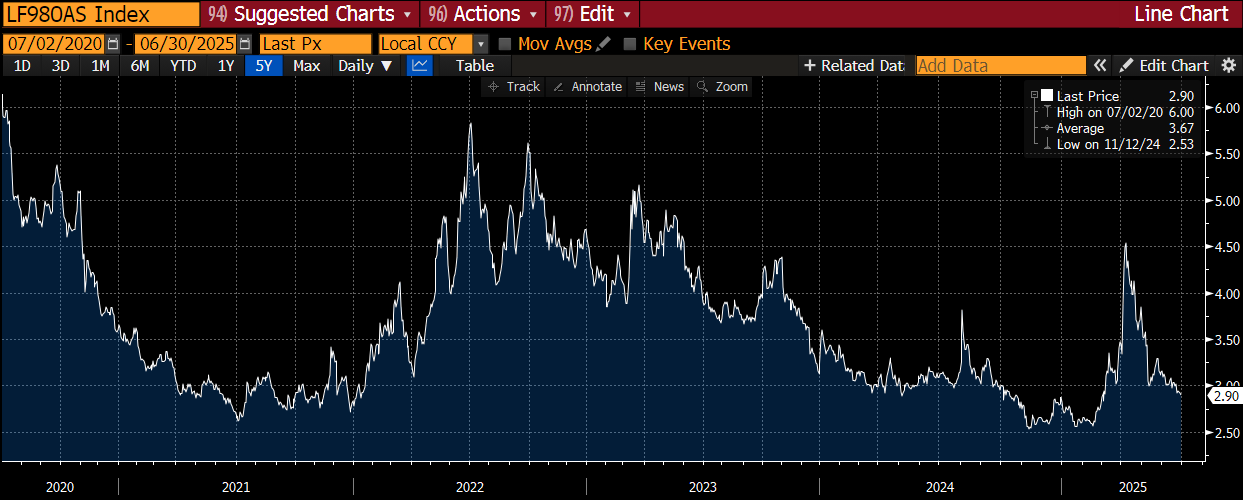
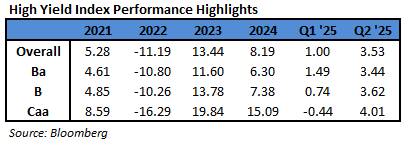
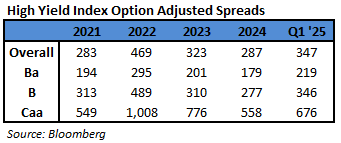
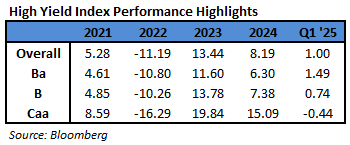
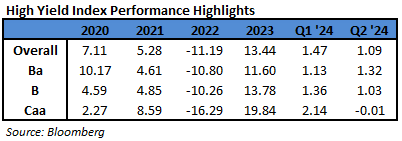
In the fourth quarter of 2024, the Bloomberg US Corporate High Yield Index (“Index”) return was 0.17% bringing the year to date (“YTD”) return to 8.19%. The S&P 500 index return was 2.39% (including dividends reinvested) bringing the YTD return to 25.00%. Over the period, while the 10 year Treasury yield increased 79 basis points, the Index option adjusted spread (“OAS”) tightened 8 basis points moving from 295 basis points to 287 basis points.

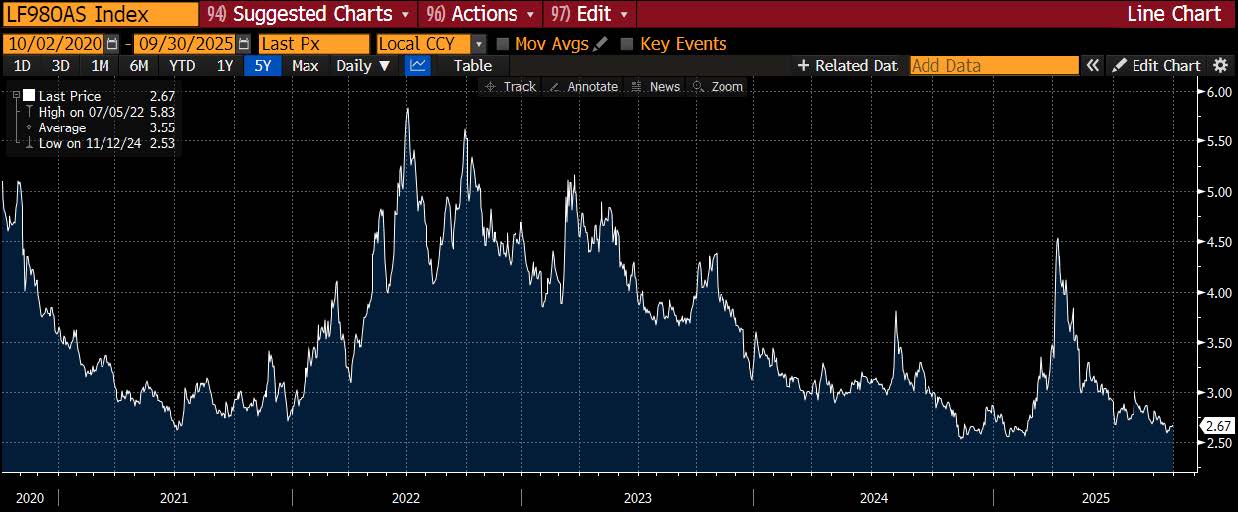
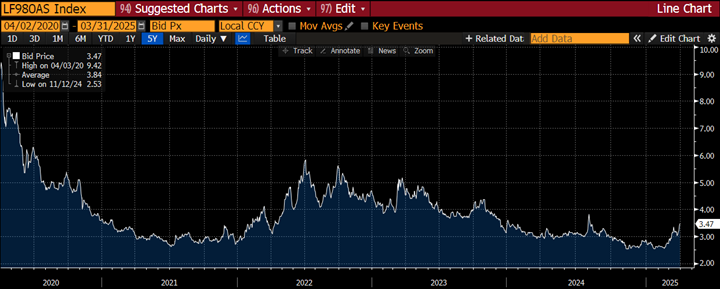
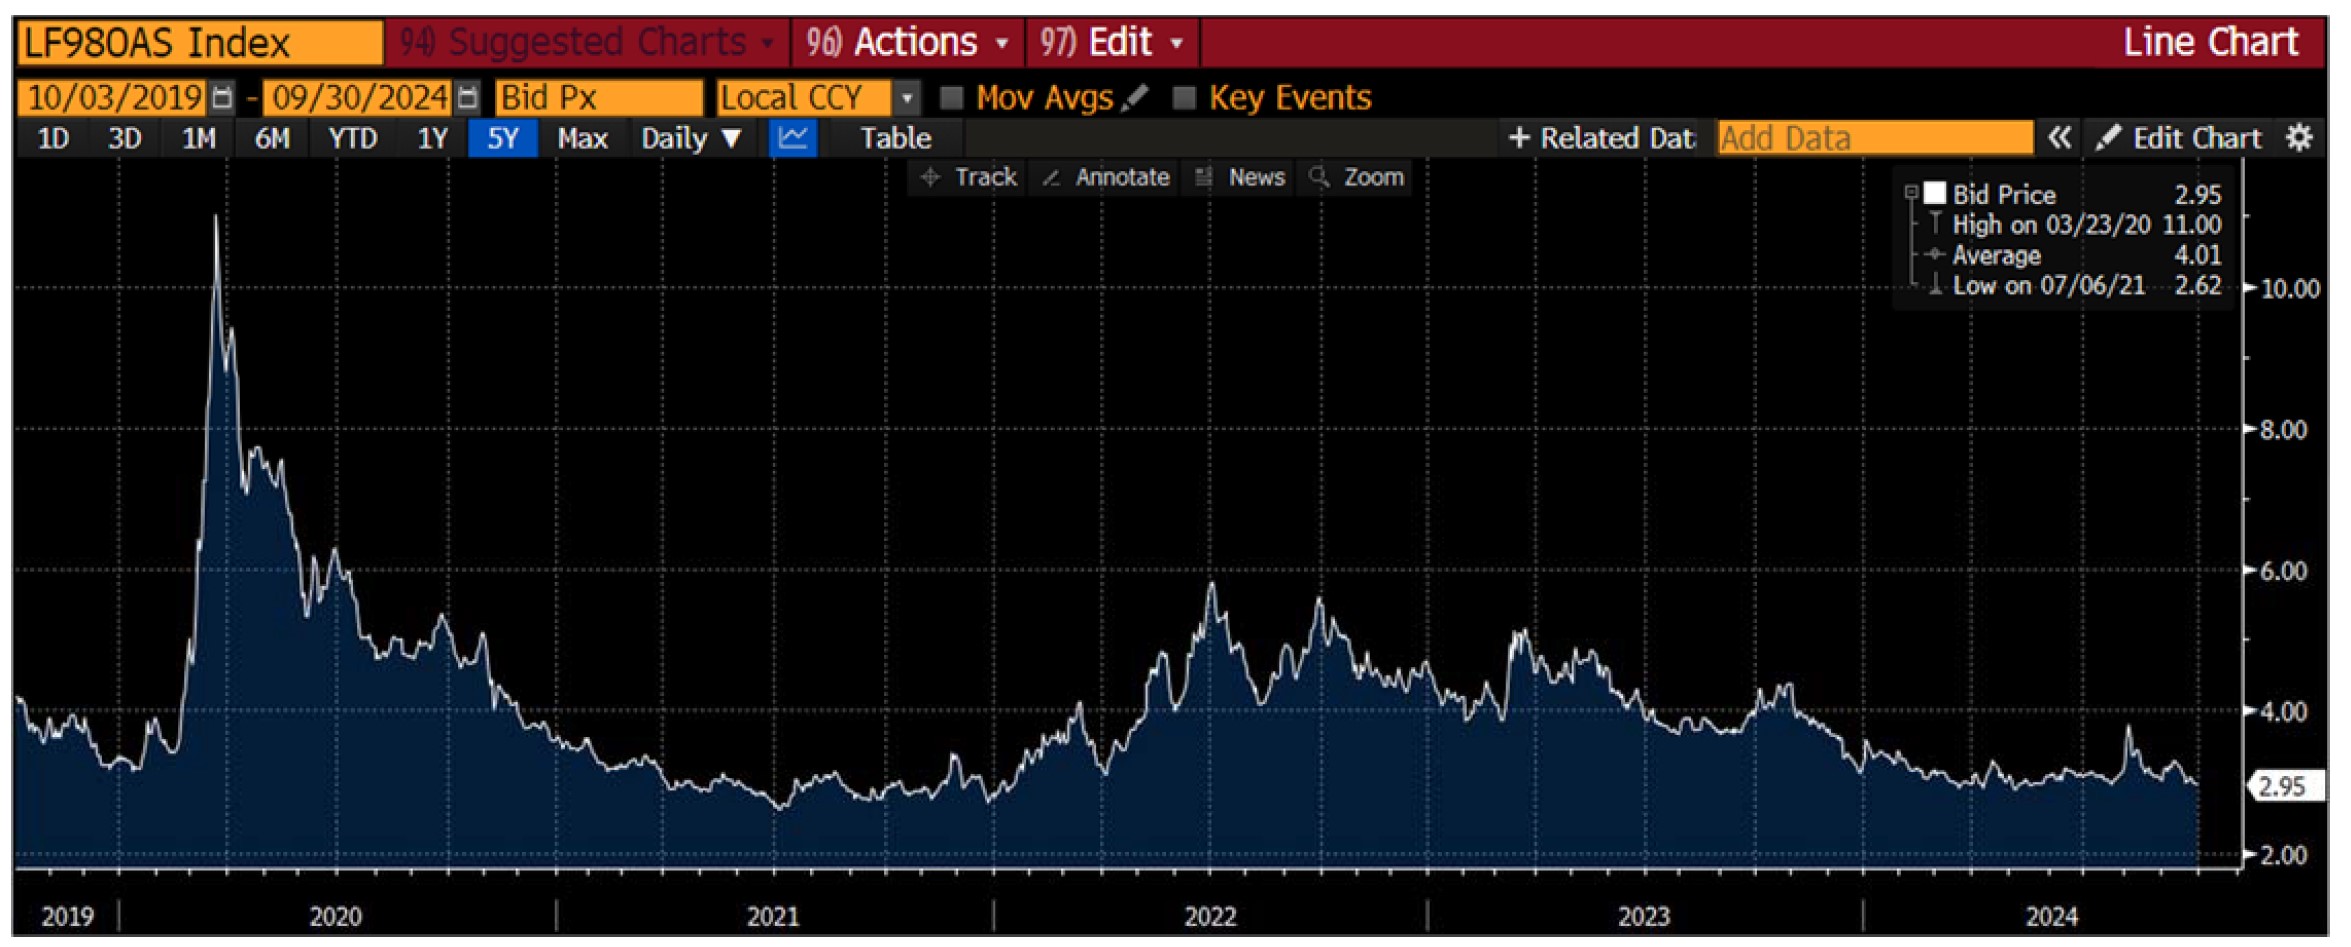
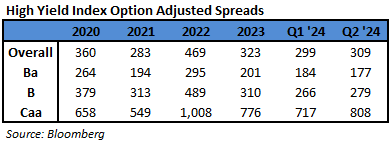
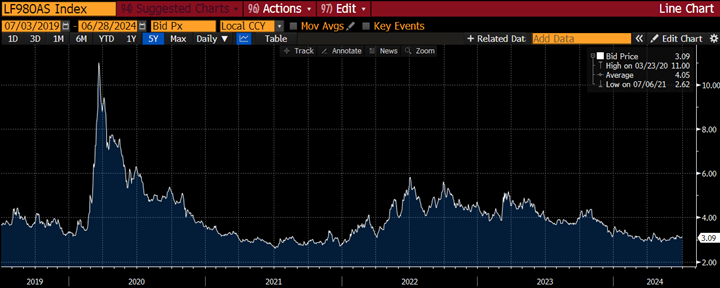
With regard to ratings segments of the High Yield Market, BB rated securities tightened 1 basis point, B rated securities tightened 8 basis points, and CCC rated securities tightened 84 basis points. The chart below from Bloomberg displays the spread moves in the Index over the past five years. For reference, the average level over that time period was 396 basis points.

The sector and industry returns in this paragraph are all Index return numbers. The Index is mapped in a manner where the “sector” is broader with the more specific “industry” beneath it. For example, Energy is a “sector” and the “industries” within the Energy sector include independent energy, integrated energy, midstream, oil field services, and refining. The Transportation, Communications, and Brokerage sectors were the best performers during the quarter, posting returns of 1.79%, 1.47%, and 1.00%, respectively. On the other hand, REITs, Utilities, and Capital Goods were the worst performing sectors, posting returns of -1.54%, -1.17%, and -0.68%, respectively. At the industry level, railroads, wirelines, and media all posted the best returns. The railroads industry posted the highest return of 6.57%. The lowest performing industries during the quarter were healthcare REITs, health insurance, and office REITs. The healthcare REITs industry posted the lowest return of -5.04%.

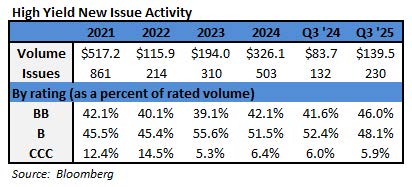
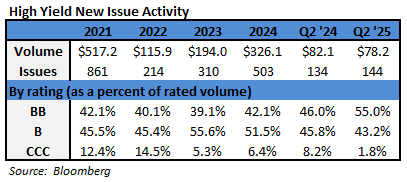
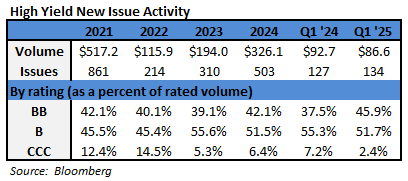
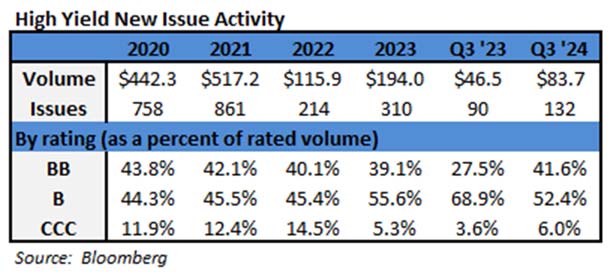
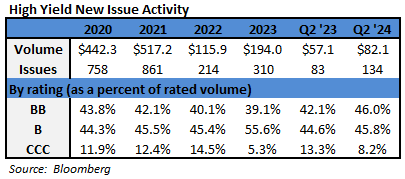
The year concluded with strong issuance during Q4 after the very strong issuance during the first three quarters of the year. The $67.6 billion figure is the most volume for a fourth quarter in three years. Of the issuance that did take place during Q4, Discretionary took 25% of the market share followed by Financials at 22% share and Communications at 12% share.

The Federal Reserve did lower the Target Rate at the November meeting and the December meeting. There was no meeting held in October. That brings the current Fed easing cycle to 100 basis points in total cuts. They kicked off this cycle with a 50 basis point cut at their September meeting. The Fed dot plot continues to moderate for 2025 now showing only 50 additional basis points of cuts expected for the year. Market participants are forecasting a bit more aggressive Fed and are expecting 83 basis points in cuts for 2025.1 After the cut at the December meeting Fed Chair Jerome Powell commented, “With today’s action, we have lowered our policy rate by a full percentage point from its peak and our policy stance is now significantly less restrictive.” Powell continued, “We can therefore be more cautious as we consider further adjustments to our policy rate.”2 While the Fed is on track to continue cutting rates, they are looking for more progress on inflation before making another move lower. Further, at this juncture, the Fed is comfortable with the current state of the labor market.

Intermediate Treasuries increased 79 basis points over the quarter, as the 10-year Treasury yield was at 3.78% on September 30th, and 4.57% at the end of the fourth quarter. The 5-year Treasury increased 82 basis points over the quarter, moving from 3.56% on September 30th, to 4.38% at the end of the fourth quarter. Intermediate term yields more often reflect GDP and expectations for future economic growth and inflation rather than actions taken by the FOMC to adjust the target rate. The revised third quarter GDP print was 3.1% (quarter over quarter annualized rate). Looking forward, the current consensus view of economists suggests a GDP for 2025 around 2.1% with inflation expectations around 2.5%.3

Being a more conservative asset manager, Cincinnati Asset Management does not buy CCC and lower rated securities. Additionally, our interest rate agnostic philosophy keeps us generally positioned in the five to ten year maturity timeframe. During Q4, our higher quality positioning was a drag on performance as lower rated securities significantly outperformed. Further, Index performance was driven by maturity buckets of 3 years and shorter. Additional performance detractors were our credit selections within the capital goods sector and our underweight in the communications sector. Benefiting our performance this quarter were our credit selections in the banking sector, consumer products industry, and consumer cyclical services industry. Another benefit was added due to our underweight in the REITs sector.

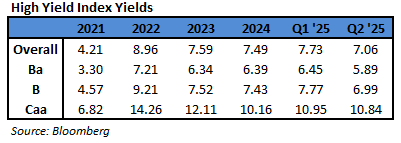
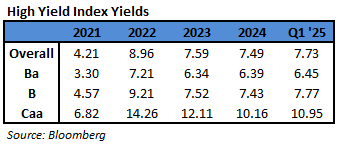
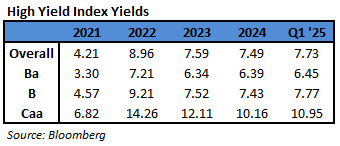
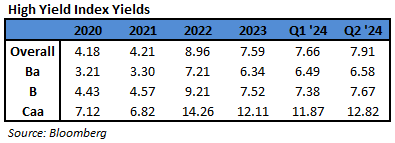
The Bloomberg US Corporate High Yield Index ended the fourth quarter with a yield of 7.49%. Treasury volatility, as measured by the Merrill Lynch Option Volatility Estimate (“MOVE” Index), remains elevated from the 78 index average over the past 10 years. The current rate of 98 is well below the spike near 200 back during the March 2023 banking scare. The MOVE Index does show a general downward trend over the last two years. Data available through November shows 29 bond defaults during 2024 which is relative to 16 defaults in all of 2022 and 41 defaults in all of 2023. The trailing twelve month dollar-weighted bond default rate is 1.80%.4 The current default rate is relative to the 2.38%, 2.67%, 2.15%, 1.85% default rates from the previous four quarter end data points listed oldest to most recent. Defaults are ticking lower and the fundamentals of high yield companies are in decent shape. From a technical view, fund flows were positive in the quarter at $6.6 billion.5 No doubt there are risks, but we are of the belief that for clients that have an investment horizon over a complete market cycle, high yield deserves to be considered as part of the portfolio allocation.

The high yield market continues to hum along with positive performance and attractive yields. Corporate fundamentals are broadly in good shape, defaults have moved lower, and issuance remains robust. GDP still looks good. Three months back the labor market appeared a bit wobbly, but it has proved resilient. There are some concerns regarding the consumer, and the Fed is eyeing a bit of needed inflation improvement. Looking ahead, the new US administration should keep things interesting. The Fed is evaluating the impact of potential presidential policies but have not yet incorporated them into any decision making saying that it is “very premature.” In other words, the Fed is data dependent. Our exercise of discipline and credit selectivity is important as we continue to evaluate that the given compensation for the perceived level of risk remains appropriate. As always, we will continue our search for value and adjust positions as we uncover compelling situations. Finally, we are very grateful for the trust placed in our team to manage your capital.

This information is intended solely to report on investment strategies identified by Cincinnati Asset Management. Opinions and estimates offered constitute our judgment and are subject to change without notice, as are statements of financial market trends, which are based on current market conditions. This material is not intended as an offer or solicitation to buy, hold or sell any financial instrument. Fixed income securities may be sensitive to prevailing interest rates. When rates rise the value generally declines. Past performance is not a guarantee of future results. Gross of advisory fee performance does not reflect the deduction of investment advisory fees. Our advisory fees are disclosed in Form ADV Part 2A. Accounts managed through brokerage firm programs usually will include additional fees. Returns are calculated monthly in U.S. dollars and include reinvestment of dividends and interest. The index is unmanaged and does not take into account fees, expenses, and transaction costs. It is shown for comparative purposes and is based on information generally available to the public from sources believed to be reliable. No representation is made to its accuracy or completeness. Additional disclosures on the material risks and potential benefits of investing in corporate bonds are available on our website: https://www.cambonds.com/disclosure-statements/.

Footnotes

Bloomberg January 1, 2025: World Interest Rate Probability

Bloomberg December 18, 2024: Powell Says Future Cuts Would Require Fresh Inflation Progress

Bloomberg January 1, 2025: Economic Forecasts (ECFC)

Moody’s December 16, 2024: November 2024 Default Report and data file

Bloomberg January 1, 2025: Fund Flows

14 Oct 2024

2024 Q3 High Yield Quarterly

In the third quarter of 2024, the Bloomberg US Corporate High Yield Index (“Index”) return was 5.28% bringing the year to date (“YTD”) return to 8.00%. The S&P 500 index return was 5.89% (including dividends reinvested) bringing the YTD return to 22.08%. Over the period, while the 10-year Treasury yield decreased 62 basis points, the Index option-adjusted spread (“OAS”) tightened 14 basis points moving from 309 basis points to 295 basis points.

With regard to ratings segments of the High Yield Market, BB rated securities widened 3 basis points, B rated securities widened 6 basis points, and CCC rated securities tightened 166 basis points. The chart below from Bloomberg displays the spread moves in the Index over the past five years. For reference, the average level over that time period was 401 basis points.

The sector and industry returns in this paragraph are all Index return numbers. The Index is mapped in a manner where the “sector” is broader with the more specific “industry” beneath it. For example, Energy is a “sector” and the “industries” within the Energy sector include independent energy, integrated energy, midstream, oil field services, and refining. The Communications, REITs, and Technology sectors were the best performers during the quarter, posting returns of 10.99%, 6.12%, and 5.84%, respectively. On the other hand, Energy, Other Industrial, and Consumer Cyclical were the worst-performing sectors, posting returns of 2.76%, 3.21%, and 4.04%, respectively. At the industry level, wirelines, cable, and pharma all posted the best returns. The wirelines industry posted the highest return of 16.86%. The lowest-performing industries during the quarter were independent energy, oil field services, and automotive. The independent energy industry posted the lowest return of 2.03%.

The year continued with strong issuance during Q3 after the very strong start that took place in the first half of the year. The $83.7 billion figure is the most volume in a quarter since the fourth quarter of 2021 not counting Q1 this year. Of the issuance that did take place during Q3, Discretionary took 24% of the market share followed by Energy at 21% share and Financials at 16% share. YTD issuance stands at $258.5 billion.

The Federal Reserve did hold the Target Rate steady at the July meeting, but cut a half a point at the September meeting. There was no meeting held in August. The last cut to the Target Rate was back in March of 2020 and then held steady for two years before the Fed started a hiking campaign then ended with a final hike in July of 2023. The Fed dot plot shows that Fed officials are forecasting an additional 50 basis points in cuts during 2024. Market participants are forecasting a bit more aggressive Fed and are expecting 71 basis points in cuts for the remainder of this yeari. After the cut at the September meeting Chair Powell commented, “This decision reflects our growing confidence that with an appropriate recalibration of our policy stance, strength in the labor market can be maintained in a context of moderate growth and inflation moving sustainably down to 2%.”ii The Fed’s main objective has been lowering inflation and it continues to generally trend in the desired direction. However, the cooling labor market is getting more of the Fed’s attention. Even though policymakers indicated that risks to employment and inflation are “roughly balanced,” the Fed’s updated economic projections show continued deterioration expected in the labor market. Chair Powell said a continuing slump in jobs would be “unwelcome.”

Intermediate Treasuries decreased 62 basis points over the quarter, as the 10-year Treasury yield was at 4.40% on June 30th, and 3.78% at the end of the third quarter. The 5-year Treasury decreased 82 basis points over the quarter, moving from 4.38% on June 30th, to 3.56% at the end of the third quarter. Intermediate term yields more often reflect GDP and expectations for future economic growth and inflation rather than actions taken by the FOMC to adjust the target rate. The revised second-quarter GDP print was 3.0% (quarter over quarter annualized rate). Looking forward, the current consensus view of economists suggests a GDP for 2025 around 1.8% with inflation expectations around 2.2%iii.

Being a more conservative asset manager, Cincinnati Asset Management does not buy CCC and lower-rated securities. Additionally, our interest rate agnostic philosophy keeps us generally positioned in the five to ten-year maturity timeframe. During Q3, our higher quality positioning was a drag on performance as lower-rated securities significantly outperformed. Further, Index performance was very strong leading to our cash position also being a drag on performance. Additional performance detractors were our credit selections within the consumer cyclical sector and our underweight in the communications sector. Benefiting our performance this quarter were our credit selections in the energy sector, aerospace/defense industry, and construction machinery industry. Another benefit was added due to our underweight in the capital goods sector.

The Bloomberg US Corporate High Yield Index ended the third quarter with a yield of 6.99%. Treasury volatility, as measured by the Merrill Lynch Option Volatility Estimate (“MOVE” Index), remains elevated from the 78 index average over the past 10 years. The current rate of 94 is well below the spike near 200 back during the March 2023 banking scare. The MOVE Index does show a general downward trend over the last two years. Data available through August shows 17 defaults during 2024 which is relative to 16 defaults in all of 2022 and 41 defaults in all of 2023. The trailing twelve month dollar-weighted default rate is 1.72%iv. The current default rate is relative to the 1.93%, 2.38%, 2.67%, 2.15% default rates from the previous four quarter end data points listed oldest to most recent. Defaults are ticking lower and the fundamentals of high yield companies are in decent shape. From a technical view, fund flows were positive in the quarter at $5.7 billionv. No doubt there are risks, but we are of the belief that for clients that have an investment horizon over a complete market cycle, high yield deserves to be considered as part of the portfolio allocation.

The high yield market continues to hum along with positive performance and attractive yields. Corporate fundamentals are broadly in good shape, defaults have moved lower, and issuance remains robust. While GDP still looks good, there are some items to note that are relevant to the consumer, namely rising delinquencies, depleted excess savings from the pandemic, and an unemployment rate that is on the rise. Recently reported consumer confidence fell the most in three years on labor market views. The Fed commenced rate cuts and stands ready to cut more as needed. Looking ahead, rising tension in the Middle East and the approaching US presidential election should certainly keep things interesting. Our exercise of discipline and credit selectivity is important as we continue to evaluate that the given compensation for the perceived level of risk remains appropriate. As always, we will continue our search for value and adjust positions as we uncover compelling situations. Finally, we are very grateful for the trust placed in our team to manage your capital.

This information is intended solely to report on investment strategies identified by Cincinnati Asset Management. Opinions and estimates offered constitute our judgment and are subject to change without notice, as are statements of financial market trends, which are based on current market conditions. This material is not intended as an offer or solicitation to buy, hold or sell any financial instrument. Fixed income securities may be sensitive to prevailing interest rates. When rates rise the value generally declines. Past performance is not a guarantee of future results. Gross of advisory fee performance does not reflect the deduction of investment advisory fees. Our advisory fees are disclosed in Form ADV Part 2A. Accounts managed through brokerage firm programs usually will include additional fees. Returns are calculated monthly in U.S. dollars and include reinvestment of dividends and interest. The index is unmanaged and does not take into account fees, expenses, and transaction costs. It is shown for comparative purposes and is based on information generally available to the public from sources believed to be reliable. No representation is made to its accuracy or completeness. Additional disclosures on the material risks and potential benefits of investing in corporate bonds are available on our website: https://www.cambonds.com/disclosure-statements/.

i Bloomberg October 1, 2024: World Interest Rate Probability
ii Bloomberg September 18, 2024: Fed Cuts Rates by Half Point
iii Bloomberg October 1, 2024: Economic Forecasts (ECFC)
iv Moody’s September 17, 2024: August 2024 Default Report and data file
v CreditSights September 25, 2024: Fund Flows

15 Jul 2024

2024 Q2 High Yield Quarterly

In the second quarter of 2024, the Bloomberg US Corporate High Yield Index (“Index”) return was 1.09% bringing the year to date (“YTD”) return to 2.58%. The S&P 500 index return was 4.28% (including dividends reinvested) bringing the YTD return to 15.29%. Over the period while the 10-year Treasury yield increased 20 basis points the Index option adjusted spread (“OAS”) widened 10 basis points moving from 299 basis points to 309 basis points.

With regard to ratings segments of the High Yield Market, BB rated securities tightened 7 basis points, B rated securities widened 13 basis points, and CCC rated securities widened 91 basis points. The chart below from Bloomberg displays the spread moves in the Index over the past five years. For reference, the average level over that time period was 405 basis points.

The sector and industry returns in this paragraph are all Index return numbers. The Index is mapped in a manner where the “sector” is broader with the more specific “industry” beneath it. For example, Energy is a “sector” and the “industries” within the Energy sector include independent energy, integrated energy, midstream, oil field services, and refining. The Consumer, Non-Cyclical, Other Financial, and Brokerage sectors were the best performers during the quarter, posting returns of 2.54%, 2.42%, and 2.35% respectively. On the other hand, Communications, REITs, and Transportation were the worst performing sectors, posting returns of -1.76%, 0.52%, and 0.55% respectively. At the industry level, pharma, other industrial, and leisure all posted the best returns. The pharma industry posted the highest return of 9.49%. The lowest performing industries during the quarter were wirelines, media, and cable. The wirelines industry posted the lowest return of -3.01%.

The year continued with strong issuance during Q2 after the very strong start that took place in Q1. The $82.1 billion figure is the most volume in a quarter since the fourth quarter of 2021, not counting Q1 this year. Of the issuance that did take place during Q2, Discretionary took 22% of the market share followed by Financials at 20% share and Energy at 16% share.

The Federal Reserve did hold the Target Rate steady at the May and June meetings. There was no meeting held in April. This made seven consecutive meetings without a hike. The last hike was back in July of 2023. The Fed dot plot shows that Fed officials are forecasting 25 basis points in cuts during 2024 down from a 75 basis cut forecast at the beginning of this year. Market participants have continued to reign in their own expectations of cuts during 2024 based on the pricing of Fed Funds Futures. At the start of the year participants expected over 150 basis points in cuts during 2024; however the expectation is now down to approximately 45 basis points in cuts this year. After the June meeting, Chair Powell commented “the most recent inflation readings have been more favorable than earlier in the year.” He continued “there has been modest further progress toward our inflation objective. We’ll need to see more good data to bolster our confidence that inflation is moving sustainably toward 2%.” The Fed’s main objective has been lowering inflation and it continues to generally trend in the desired direction. The most recent report for Core CPI showed a year over year growth rate of 3.4% down from a peak of 6.6% almost two years ago. Further, the most recent Core PCE growth rate measured 2.6% off the peak of 5.6% from February of 2022.

Intermediate Treasuries increased 20 basis points over the quarter as the 10-year Treasury yield was at 4.20% on March 31st and 4.40% at the end of the second quarter. The 5-year Treasury increased 17 basis points over the quarter moving from 4.21% on March 31st to 4.38% at the end of the second quarter. Intermediate term yields more often reflect GDP and expectations for future economic growth and inflation rather than actions taken by the FOMC to adjust the target rate. The revised first quarter GDP print was 1.4% (quarter over quarter annualized rate). Looking forward, the current consensus view of economists suggests a GDP for 2024 around 2.3% with inflation expectations around 2.8%.

Being a more conservative asset manager, Cincinnati Asset Management does not buy CCC and lower rated securities. Additionally, our interest rate agnostic philosophy keeps us generally positioned in the five to ten year maturity timeframe. During Q2, our higher quality positioning served clients well as lower rated securities underperformed but maturity positioning was a detractor as the less than three year timeframe bucket outperformed. Additionally, there was a performance drag due to our credit selections within the consumer non-cyclical and energy sectors. Benefiting our performance this quarter were our credit selections in the communications sector and our underweight in the communications sector.

The Bloomberg US Corporate High Yield Index ended the second quarter with a yield of 7.91%. Treasury volatility as measured by the Merrill Lynch Option Volatility Estimate (“MOVE” Index) has picked up quite a bit the past couple of years. The MOVE averaged 121 during 2023 relative to a 62 average over 2021. However, the current rate of 98 is well below the spike near 200 back during the March 2023 banking scare. Data available through May shows 11 defaults during 2024 which is relative to 16 defaults in all of 2022 and 41 defaults in all of 2023. The trailing twelve month dollar-weighted default rate is 2.52%. The current default rate is relative to the 1.74%, 1.93%, 2.37%, 2.53% default rates from the previous four quarter end data points listed oldest to most recent. While defaults are ticking up, the fundamentals of high yield companies still look good. From a technical view, fund flows were positive in the quarter at $3.3 billion. No doubt there are risks but we are of the belief that for clients that have an investment horizon over a complete market cycle, high yield deserves to be considered as part of the portfolio allocation.
The high yield market continues to hum along with positive performance and attractive yields. Corporate fundamentals are broadly in good shape, defaults held steady this quarter and issuance remains robust. While GDP still looks good there are some items to note that are relevant to the consumer namely rising delinquencies, depleted excess savings from the pandemic, and an unemployment rate that is on the rise. These items are likely to weigh on the data dependent Fed to commence rate cuts. Among others, the ECB and Bank of Canada have already enacted rate cuts. Looking ahead, the second half of the year contains some events of interest including the presidential election and the probable start of a US rate reduction cycle. Our exercise of discipline and credit selectivity is important as we continue to evaluate that the given compensation for the perceived level of risk remains appropriate. As always, we will continue our search for value and adjust positions as we uncover compelling situations. Finally, we are very grateful for the trust placed in our team to manage your capital.

This information is intended solely to report on investment strategies identified by Cincinnati Asset Management. Opinions and estimates offered constitute our judgment and are subject to change without notice as are statements of financial market trends which are based on current market conditions. This material is not intended as an offer or solicitation to buy, hold or sell any financial instrument. Fixed income securities may be sensitive to prevailing interest rates. When rates rise, the value generally declines. Past performance is not a guarantee of future results. Gross of advisory fee performance does not reflect the deduction of investment advisory fees. Our advisory fees are disclosed in Form ADV Part 2A. Accounts managed through brokerage firm programs usually will include additional fees. Returns are calculated monthly in U.S. dollars and include reinvestment of dividends and interest. The index is unmanaged and does not take into account fees, expenses, and transaction costs. It is shown for comparative purposes and is based on information generally available to the public from sources believed to be reliable. No representation is made to its accuracy or completeness.

Additional disclosures on the material risks and potential benefits of investing in corporate bonds are available on our website: https://www.cambonds.com/disclosure-statements/

i Bloomberg, June 28 2024 “High-Grade Bond Sales on Easter Pause After Record First Quarter”

ii Bloomberg WIRP, March 29 2024 “Fed Funds Futures”

iii Bloomberg WIRP, June 29 2024 “Fed Funds Futures”

iv Raymond James & Associates, June 28 2024 “Fixed Income Spreads”

v Barclays Bank PLC, June 13 2024 “US Investment Grade Credit Metrics, Q2 2024 Update: No Concerns”

vi J.P. Morgan, July 3 2024 “US High Grade Corporate Bond Issuance Review”

vii Bloomberg ILM3NAVG Index, June 28 2024 “Bankrate.com US Home Mortgage 30 Year Fixed National Avg”

viii CNBC, June 13 2024 “The Federal Reserve’s period of rate hikes may be over. Here’s why consumers are still reeling”

06 Apr 2024

2024 Q1 High Yield Quarterly

In the first quarter of 2024, the Bloomberg US Corporate High Yield Index (“Index”) return was 1.47%, and the S&P 500 index return was 10.55% (including dividends reinvested).  Over the period, while the 10 year Treasury yield increased 32 basis points, the Index option adjusted spread (“OAS”) tightened 24 basis points moving from 323 basis points to 299 basis points.

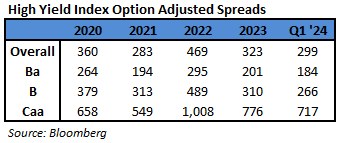
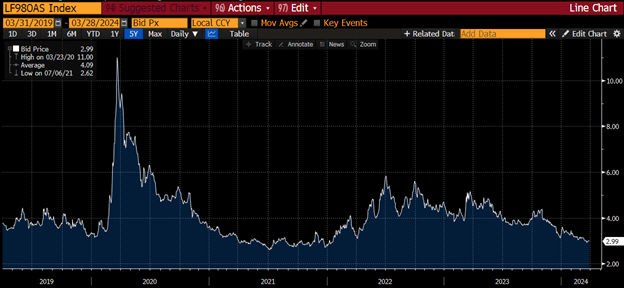
All ratings segments of the High Yield Market participated in the spread tightening as BB rated securities tightened 17 basis points, B rated securities tightened 44 basis points, and CCC rated securities tightened 59 basis points.  The chart below from Bloomberg displays the spread moves in the Index over the past five years.  For reference, the average level over that time period was 409 basis points.

The sector and industry returns in this paragraph are all Index return numbers.  The Index is mapped in a manner where the “sector” is broader with the more specific “industry” beneath it.  For example, Energy is a “sector” and the “industries” within the Energy sector include independent energy, integrated energy, midstream, oil field services, and refining.  The Other Financial, Brokerage, and Energy sectors were the best performers during the quarter, posting returns of 2.79%, 2.58%, and 2.55%, respectively.  On the other hand, Communications, Utilities, and Insurance were the worst performing sectors, posting returns of -1.90%, 0.29%, and 0.32%, respectively.  At the industry level, retailers, paper, and healthcare all posted the best returns.  The retailers industry posted the highest return of 4.89%.  The lowest performing industries during the quarter were wireless, cable, and media.  The wireless industry posted the lowest return of -7.12%.

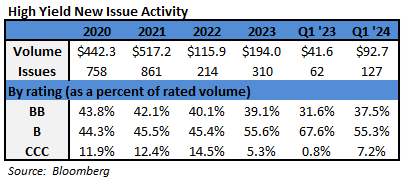
The year is off to a very strong start in terms of issuance.  The $92.7 billion figure is the most volume in a quarter since the third quarter of 2021.  Of the issuance that did take place during Q1, Financials took 25% of the market share followed by Discretionary at 23% share and Energy at 15% share.

The Federal Reserve did hold the Target Rate steady at the January and March meetings.  There was no meeting held in February.  This made five consecutive meetings without a hike.  The last hike was back in July of 2023.  The Fed dot plot shows that Fed officials are forecasting 75 basis points in cuts during 2024.    Market participants have continued to reign in their own expectations of cuts during 2024 based on the pricing of Fed Funds Futures.  At the start of the year, participants expected over 150 basis points in cuts during 2024; however, the expectation is now down to approximately 67 basis points in cuts this year.i  During the March post meeting press conference, Chair Powell “largely shrugged off recent data showing an uptick in inflation in recent months, saying, ‘It is still likely in most people’s view that we will achieve that confidence and there will be rate cuts.’  At the same time, he said the data supported the Fed’s cautious approach to the first rate cut, and added that policymakers are still looking for more evidence that inflation is headed toward their 2% goal.”ii  The Fed’s main objective has been lowering inflation and while now being described as “bumpy,” it continues to trend in the desired direction.  The most recent report for Core CPI showed a year over year growth rate of 3.8% down from a peak of 6.6% a year and a half ago.  Further, the most recent Core PCE growth rate measured 2.8% off the peak of 5.6% from February of 2022.
Intermediate Treasuries increased 32 basis points over the quarter, as the 10-year Treasury yield was at 3.88% on December 31st, and 4.20% at the end of the first quarter.  The 5-year Treasury increased 36 basis points over the quarter, moving from 3.85% on December 31st, to 4.21% at the end of the first quarter.  Intermediate term yields more often reflect GDP and expectations for future economic growth and inflation rather than actions taken by the FOMC to adjust the target rate.  The revised fourth quarter GDP print was 3.4% (quarter over quarter annualized rate).  Looking forward, the current consensus view of economists suggests a GDP for 2024 around 2.2% with inflation expectations around 2.9%.iii

Being a more conservative asset manager, Cincinnati Asset Management does not buy CCC and lower rated securities.  Additionally, our interest rate agnostic philosophy keeps us generally positioned in the five to ten year maturity timeframe.  During Q1, those elements were a drag on performance as lower rated securities outperformed and rate movements put our particular duration position at a disadvantage.  Additional performance drag was due to our cash position and credit selections within the consumer and energy sectors.  Benefiting our performance this quarter were our credit selections in the banking and technology sectors and our underweight in the communications sector.

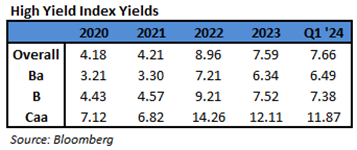
The Bloomberg US Corporate High Yield Index ended the first quarter with a yield of 7.66%.  Treasury volatility, as measured by the Merrill Lynch Option Volatility Estimate (“MOVE” Index), has picked up quite a bit the past couple of years.  The MOVE averaged 121 during 2023 relative to a 62 average over 2021.  However, the current rate of 86 is well below the spike near 200 back during the March 2023 banking scare.  Data available through February shows 5 defaults during 2024 which is relative to 16 defaults in all of 2022 and 41 defaults in all of 2023.  The trailing twelve month dollar-weighted default rate is 2.53%.iv  The current default rate is relative to the 1.30%, 1.74%, 1.93%, 2.37% default rates from the previous four quarter end data points listed oldest to most recent.  While defaults are ticking up, the fundamentals of high yield companies still look good.  From a technical view, fund flows were positive in the quarter at $5.8 billion.v  No doubt there are risks, but we are of the belief that for clients that have an investment horizon over a complete market cycle, high yield deserves to be considered as part of the portfolio allocation.
The market backdrop was fairly positive for high yield this quarter.  The nice inflows, strong issuance, and good available yield led to a positive total return.  However, there are under-currents to monitor as consumer spending ticks up while the savings rate ticks down, and consumer delinquencies are moving higher across most loan categories.  Looking ahead, the approaching presidential election certainly has the ability to impact markets, and the Fed stands at the ready to begin cutting rates.  Our exercise of discipline and credit selectivity is important as we continue to evaluate that the given compensation for the perceived level of risk remains appropriate.  As always, we will continue our search for value and adjust positions as we uncover compelling situations.  Finally, we are very grateful for the trust placed in our team to manage your capital.

This information is intended solely to report on investment strategies identified by Cincinnati Asset Management. Opinions and estimates offered constitute our judgment and are subject to change without notice, as are statements of financial market trends, which are based on current market conditions. This material is not intended as an offer or solicitation to buy, hold or sell any financial instrument.  Fixed income securities may be sensitive to prevailing interest rates.  When rates rise the value generally declines.  Past performance is not a guarantee of future results.  Gross of advisory fee performance does not reflect the deduction of investment advisory fees.  Our advisory fees are disclosed in Form ADV Part 2A.  Accounts managed through brokerage firm programs usually will include additional fees.  Returns are calculated monthly in U.S. dollars and include reinvestment of dividends and interest. The index is unmanaged and does not take into account fees, expenses, and transaction costs.  It is shown for comparative purposes and is based on information generally available to the public from sources believed to be reliable.  No representation is made to its accuracy or completeness.  Additional disclosures on the material risks and potential benefits of investing in corporate bonds are available on our website: https://www.cambonds.com/disclosure-statements/.

i Bloomberg March 29, 2024:  World Interest Rate Probability

ii Bloomberg March 20, 2024:  Fed Signals Three Rate Cuts Likely

iii Bloomberg March 29, 2024: Economic Forecasts (ECFC)

iv Moody’s March 14, 2024:  February 2024 Default Report and data file

v CreditSights March 28, 2024:  “Credit Flows”

24 Jan 2024

2023 Q4 High Yield Quarterly

In the fourth quarter of 2023, the Bloomberg US Corporate High Yield Index (“Index”) return was 7.16% bringing the year to date (“YTD”) return to 13.44%.  The S&P 500 index return was 11.68% (including dividends reinvested) bringing the YTD return to 26.26%.  Over the period, while the 10 year Treasury yield decreased 69 basis points, the Index option adjusted spread (“OAS”) tightened 71 basis points moving from 394 basis points to 323 basis points.

All ratings segments of the High Yield Market participated in the spread tightening as BB rated securities tightened 63 basis points, B rated securities tightened 89 basis points, and CCC rated securities tightened 72 basis points.  The chart below from Bloomberg displays the spread moves in the Index over the past five years.  For reference, the average level over that time period was 413 basis points.

The sector and industry returns in this paragraph are all Index return numbers.  The Index is mapped in a manner where the “sector” is broader with the more specific “industry” beneath it.  For example, Energy is a “sector” and the “industries” within the Energy sector include independent energy, integrated energy, midstream, oil field services, and refining.  The Brokerage, Banking, and Finance sectors were the best performers during the quarter, posting returns of 11.80%, 9.37%, and 8.40%, respectively.  On the other hand, Transportation, Energy, and Other Industrial were the worst performing sectors, posting returns of 4.25%, 5.24%, and 6.53%, respectively.  At the industry level, retailers, media, and building materials all posted the best returns.  The retailers industry posted the highest return of 10.03%.  The lowest performing industries during the quarter were oil field services, airlines, and independent energy.  The oil field services industry posted the lowest return of 3.10%.

While there was a dearth of issuance during 2022 as interest rates rapidly increased and capital structures were previously refinanced, the primary market perked up a bit during each quarter this year.  Issuance has remained low by historical standards as so much was pushed out by the large issuance during 2020 and 2021.  For 2024, strategists are looking for issuance in the range of $200-$230 billion.  Of the issuance that did take place during Q4, Finance took 29% of the market share followed by Energy at 28% share and Industrials at 13% share.

The Federal Reserve did hold the Target Rate steady at the November and December meetings.  There was no meeting held in October.  This made three consecutive meetings without a hike.  The last hike was back in July.  For the first time since March of 2021, the Fed is not projecting additional hikes.  In fact, the Fed dot plot shows that Fed officials are forecasting 75 basis points in cuts during 2024.  It sure seems like the worm has finally turned and the market is responding positively.  During the December post meeting press conference, Chair Powell did pay lip service to the ability to hike again if needed, but the focus moved to rate cuts.  With regard to when it will become appropriate to cut rates, Powell said “That begins to come into view and is clearly a topic of discussion out in the world and also a discussion for us at our meeting today.”i  The Fed’s main objective has been lowering inflation and it continues to trend in the desired direction.  The most recent report for Core CPI showed a year over year growth rate of 4.0% down from a peak of 6.6% over one year ago.  Further, the most recent Core PCE growth rate measured 3.2% off the peak of 5.6% from February of 2022.

Intermediate Treasuries decreased 69 basis points over the quarter, as the 10-year Treasury yield was at 4.57% on September 30th, and 3.88% at the end of the fourth quarter.  The 5-year Treasury decreased 76 basis points over the quarter, moving from 4.61% on September 30th, to 3.85% at the end of the fourth quarter.  Intermediate term yields more often reflect GDP and expectations for future economic growth and inflation rather than actions taken by the FOMC to adjust the target rate.  The revised third quarter GDP print was 4.9% (quarter over quarter annualized rate).  Looking forward, the current consensus view of economists suggests a GDP for 2024 around 1.3% with inflation expectations around 2.6%.ii

Being a more conservative asset manager, Cincinnati Asset Management does not buy CCC and lower rated securities.  Additionally, our interest rate agnostic philosophy keeps us generally positioned in the five to ten year maturity timeframe.  During Q4, Index performance was very strong leading to our cash position being a drag on performance.  Additional performance drag was due to our credit selections within banking and brokerage as we positioned in high quality credits in those sectors.  Benefiting our performance this quarter were our credit selections in capital goods, technology, and electric utilities.

The Bloomberg US Corporate High Yield Index ended the fourth quarter with a yield of 7.59%.  Treasury volatility, as measured by the Merrill Lynch Option Volatility Estimate (“MOVE” Index), has picked up quite a bit the past couple of years.  The MOVE averaged 121 during 2023 relative to a 62 average over 2021.  However, the current rate of 114 is well below the spike near 200 back in March during the banking scare.  Data available through November shows 39 defaults during 2023 which is up from 16 defaults during all of 2022.  The trailing twelve month dollar-weighted default rate is 2.46%.iii  The current default rate is relative to the 1.14%, 1.30%, 1.74%, 1.93% default rates from the previous four quarter end data points listed oldest to most recent.  While defaults are ticking up, the fundamentals of high yield companies still look good.  From a technical view, fund flows were positive in the quarter at $6.7 billion and total -$22.6 billion YTD.iv  No doubt there are risks, but we are of the belief that for clients that have an investment horizon over a complete market cycle, high yield deserves to be considered as part of the portfolio allocation.

What a difference several months can make.  Not too long ago 10 year rates were at 15 year highs topping out close to 5%.  Today the 10 year rate is just under 4%.  Crude oil was over $90 per barrel and now it is a touch over $70 per barrel.  As we move forward in 2024, the labor market is holding up but cooling as job seekers are beginning to struggle to find work.  Consumer delinquencies have been ticking up across most loan categories while savings have dwindled and the savings rate remains below average.v  No doubt that this softness is being taken into account by market participants.  That is the reason for the lower GDP projections and the Fed talking potential cuts at this point in time.  Our exercise of discipline and credit selectivity is important as we continue to evaluate that the given compensation for the perceived level of risk remains appropriate.  As always, we will continue our search for value and adjust positions as we uncover compelling situations.  Finally, we are very grateful for the trust placed in our team to manage your capital.

This information is intended solely to report on investment strategies identified by Cincinnati Asset Management. Opinions and estimates offered constitute our judgment and are subject to change without notice, as are statements of financial market trends, which are based on current market conditions. This material is not intended as an offer or solicitation to buy, hold or sell any financial instrument.  Fixed income securities may be sensitive to prevailing interest rates.  When rates rise the value generally declines.  Past performance is not a guarantee of future results.  Gross of advisory fee performance does not reflect the deduction of investment advisory fees.  Our advisory fees are disclosed in Form ADV Part 2A.  Accounts managed through brokerage firm programs usually will include additional fees.  Returns are calculated monthly in U.S. dollars and include reinvestment of dividends and interest. The index is unmanaged and does not take into account fees, expenses, and transaction costs.  It is shown for comparative purposes and is based on information generally available to the public from sources believed to be reliable.  No representation is made to its accuracy or completeness.  Additional disclosures on the material risks and potential benefits of investing in corporate bonds are available on our website: https://www.cambonds.com/disclosure-statements/.

i Bloomberg December 13, 2023:  Fed Pivots to Rate Cuts

ii Bloomberg January 2, 2024: Economic Forecasts (ECFC)

iii Moody’s December 14, 2023:  November 2023 Default Report and data file

iv CreditSights December 21, 2023:  “Credit Flows”

v Moody’s December 2023:  State of the US Consumer

08 Oct 2023

2023 Q3 High Yield Quarterly

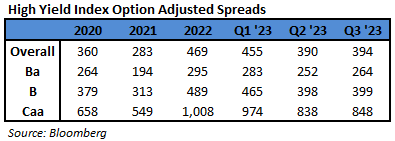
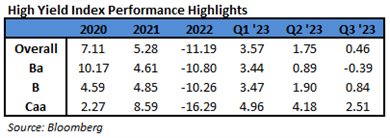
In the third quarter of 2023, the Bloomberg US Corporate High Yield Index (“Index”) return was 0.46% bringing the year to date (“YTD”) return to 5.86%.  The S&P 500 index return was -3.27% (including dividends reinvested) bringing the YTD return to 13.06%.  Over the period, while the 10 year Treasury yield increased 73 basis points, the Index option adjusted spread (“OAS”) widened 4 basis points moving from 390 basis points to 394 basis points.

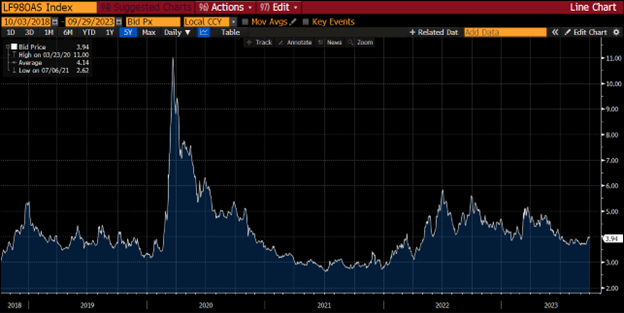
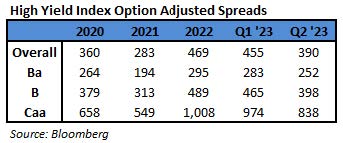
All ratings segments of the High Yield Market participated in the spread widening as BB rated securities widened 12 basis points, B rated securities widened 1 basis point, and CCC rated securities widened 10 basis points.  The chart below from Bloomberg displays the spread moves in the Index over the past five years.  For reference, the average level over that time period was 414 basis points.

The sector and industry returns in this paragraph are all Index return numbers.  The Index is mapped in a manner where the “sector” is broader with the more specific “industry” beneath it.  For example, Energy is a “sector” and the “industries” within the Energy sector include independent energy, integrated energy, midstream, oil field services, and refining.  The Banking, Brokerage, and Other Financial sectors were the best performers during the quarter, posting returns of 3.18%, 2.56%, and 1.96%, respectively.  On the other hand, Electric Utilities, Transportation, and REITs were the worst performing sectors, posting returns of -0.97%,  -0.69%, and -0.46%, respectively.  At the industry level, oil field services, cable, and independent energy all posted the best returns.  The oil field services industry posted the highest return of 3.40%.  The lowest performing industries during the quarter were office REITs, healthcare REITs, and health insurance.  The office REITs industry posted the lowest return of -5.32%.

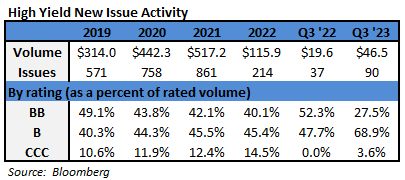
While there was a dearth of issuance during 2022 as interest rates rapidly increased and capital structures were previously refinanced, the primary market perked up a bit during each quarter this year.  Issuance has remained low by historical standards as so much was pushed out by the large issuance during 2020 and 2021.  Of the issuance that did take place during Q3, Energy took 21% of the market share followed by Discretionary at 17% share and Healthcare at a 12% share.

The Federal Reserve did lift the Target Rate by 0.25% at the July meeting but took a pause at the September meeting.  There was no meeting held in August.  This was the second rate pause, the first being June of this year, during the current 525 basis points hiking cycle that began in March of 2022.  A few of the main takeaways from the September meeting and press conference:  inflation is still too high, the job market is still too tight, the Fed is just about done with the rate hikes, the Fed remains data dependent but expects rates to stay higher for longer.  “We’re fairly close, we think, to where we need to get,” Chair Powell said.  “We are committed to achieving and sustaining a stance of monetary policy that is sufficiently restrictive to bring inflation down to our 2% goal over time,” Powell said at a press conference following the decision.i  Inflation gauges are certainly off their peaks and moving in the proper direction.  The most recent report for Core CPI showed a year over year growth rate of 4.3% down from a peak of 6.6% one year ago.  Further, the most recent Core PCE growth rate measured 3.9% off the peak of 5.6% from February of 2022.

Intermediate Treasuries increased 73 basis points over the quarter, as the 10-year Treasury yield was at 3.84% on June 30th, and 4.57% at the end of the third quarter.  The 5-year Treasury increased 45 basis points over the quarter, moving from 4.16% on June 30th, to 4.61% at the end of the third quarter.  Intermediate term yields more often reflect GDP and expectations for future economic growth and inflation rather than actions taken by the FOMC to adjust the target rate.  The revised second quarter GDP print was 2.1% (quarter over quarter annualized rate).  Looking forward, the current consensus view of economists suggests a GDP for 2023 around 2.1% with inflation expectations around 4.1%.ii

Being a more conservative asset manager, Cincinnati Asset Management does not buy CCC and lower rated securities.  Additionally, our interest rate agnostic philosophy keeps us generally positioned in the five to ten year maturity timeframe.  During Q3, Index performance was once again tilted toward the lowest rated end of the market.  Further, Index performance was heavily tilted toward short duration as all duration buckets over a three year duration underperformed.  Our credit selections within the consumer sectors and aerospace/defense were also a drag to performance.  Benefiting our performance this quarter were our overweights in banking and energy, and our credit selections in airlines and independent energy.

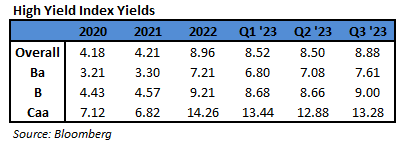
The Bloomberg US Corporate High Yield Index ended the third quarter with a yield of 8.88%.  Treasury volatility, as measured by the Merrill Lynch Option Volatility Estimate (“MOVE” Index), has picked up quite a bit the past couple of years.  The MOVE has averaged 121 during 2023 relative to a 62 average over 2021.  However, the current rate of 113 is well below the spike near 200 back in March during the banking scare. Data available through August shows 33 defaults during 2023 which is up from 16 defaults during all of 2022.  The trailing twelve month dollar-weighted default rate is 1.86%.iii The current default rate is relative to the 1.10%, 1.14%, 1.30%, 1.74% default rates from the previous four quarter end data points listed oldest to most recent.  While defaults are ticking up, the fundamentals of high yield companies still look good.  From a technical view, fund flows were negative in the quarter at -$1.8 billion and total -$27.9 billion YTD.iv No doubt there are risks, but we are of the belief that for clients that have an investment horizon over a complete market cycle, high yield deserves to be considered as part of the portfolio allocation.

The data dependent Fed will continue to remain a large part of the story as 2023 works its way toward year end.  The data will in fact continue to flow as Congress averted a government shutdown with a last minute agreement.  Had the shutdown taken place, some of the data the Fed looks to would not have been available.  In reality, Congress just kicked the can down the road to buy less than two months of additional time to work on a more substantial funding package.  Adding to the current wall of worry are 10 year rates that are at 15 year highs, oil has ripped higher by $20 per barrel over the past three months, and cracks are seemingly starting to show for the US Consumer.  Credit card delinquencies are at the highest level in more than a decade, and a recent report from Moody’s stated, “consumer debt quality is declining.”  Our exercise of discipline and credit selectivity is important as we continue to evaluate that the given compensation for the perceived level of risk remains appropriate.  As always, we will continue our search for value and adjust positions as we uncover compelling situations.  Finally, we are very grateful for the trust placed in our team to manage your capital.

This information is intended solely to report on investment strategies identified by Cincinnati Asset Management. Opinions and estimates offered constitute our judgment and are subject to change without notice, as are statements of financial market trends, which are based on current market conditions. This material is not intended as an offer or solicitation to buy, hold or sell any financial instrument.  Fixed income securities may be sensitive to prevailing interest rates.  When rates rise the value generally declines.  Past performance is not a guarantee of future results.  Gross of advisory fee performance does not reflect the deduction of investment advisory fees.  Our advisory fees are disclosed in Form ADV Part 2A.  Accounts managed through brokerage firm programs usually will include additional fees.  Returns are calculated monthly in U.S. dollars and include reinvestment of dividends and interest. The index is unmanaged and does not take into account fees, expenses, and transaction costs.  It is shown for comparative purposes and is based on information generally available to the public from sources believed to be reliable.  No representation is made to its accuracy or completeness.  Additional disclosures on the material risks and potential benefits of investing in corporate bonds are available on our website: https://www.cambonds.com/disclosure-statements/.

i Bloomberg September 20, 2023:  Fed Leaves Rates Unchanged

ii Bloomberg October 2, 2023: Economic Forecasts (ECFC)

iii Moody’s September 15, 2023:  August 2023 Default Report and data file

iv CreditSights September 28, 2023:  “Credit Flows”

14 Jul 2023

2023 Q2 High Yield Quarterly

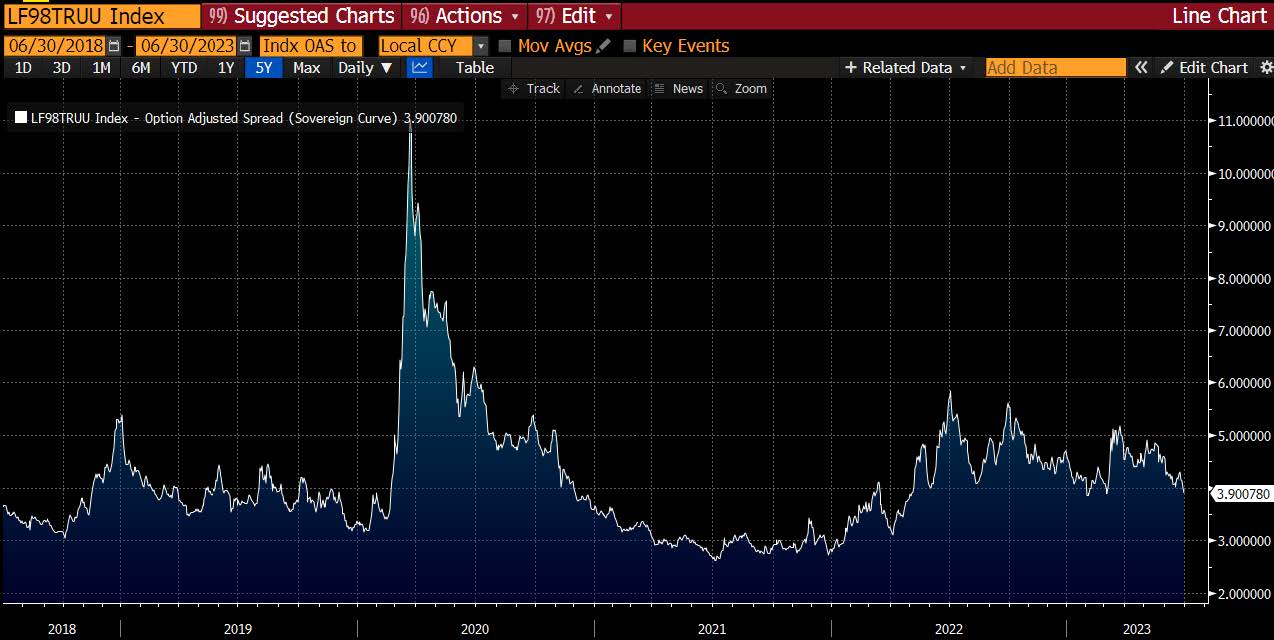
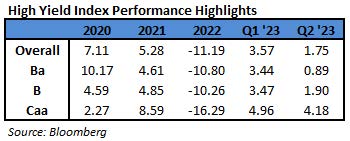
In the second quarter of 2023, the Bloomberg US Corporate High Yield Index (“Index”) return was 1.75% bringing the year to date (“YTD”) return to 5.38%.  The S&P 500 index return was 8.74% (including dividends reinvested) bringing the YTD return to 16.88%.  Over the period, while the 10 year Treasury yield increased 37 basis points, the Index option adjusted spread (“OAS”) tightened 65 basis points moving from 455 basis points to 390 basis points.

All ratings segments of the High Yield Market participated in the spread tightening as BB rated securities tightened 31 basis points, B rated securities tightened 67 basis points, and CCC rated securities tightened 136 basis points.  The chart below from Bloomberg displays the spread moves in the Index over the past five years.  For reference, the average level over the five years is 411 basis points.

The sector and industry returns in this paragraph are all index return numbers.  The Other Industrial, Finance Companies, and REITs sectors were the best performers during the quarter, posting returns of 3.90%, 3.66%, and 3.44%, respectively.  On the other hand, Banking, Electric Utilities, and Other Financial were the worst performing sectors, posting returns of -1.68%, -0.26%, and -0.09%, respectively.  At the industry level, retailers, leisure, and retail REITs all posted the best returns.  The retailers industry posted the highest return of 6.39%.  The lowest performing industries during the quarter were wireless, life insurance, and paper.  The wireless industry posted the lowest return of -2.67%.

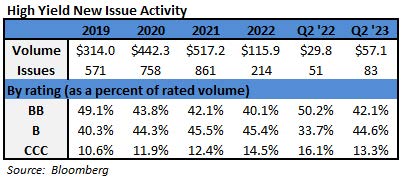
While there was a dearth of issuance during 2022 as interest rates rapidly increased and capital structures were previously refinanced, the primary market perked up a bit during the second quarter this year.  Of the issuance that did take place, Energy took 23% of the market share followed by Discretionary at an 18% share and Financials at a 15% share.

The Federal Reserve did lift the Target Rate by 0.25% at the May meeting but took a pause at the June meeting.  This was the first rate pause during the current 15 month long hiking cycle where the Fed has hiked by 500 basis points.  With inflation still too high and the labor market still too tight, Chair Jerome Powell has provided a clear message that additional hikes this year are to be expected.  “A strong majority of committee participants expect that it will be appropriate to raise interest rates two or more times by the end of the year,” Powell said, referencing the policy-setting Federal Open Market Committee during a conference at the end of June.  “Inflation pressures continue to run high, and the process of getting inflation back down to 2% has a long way to go.”i  Powell did acknowledge that the outlook is “particularly uncertain” and noted that the Fed will pay close attention to ongoing economic data releases.  With regard to the banking turmoil that started back in March, Powell suggested that more supervision and regulation is likely needed but did note that the US banking system is “strong and resilient.”  At this point, treasury rates and high yield spreads are about where they were prior to the banking scare.


Intermediate Treasuries increased 37 basis points over the quarter, as the 10-year Treasury yield was at 3.47% on March 31st, and 3.84% at the end of the second quarter.  The 5-year Treasury increased 59 basis points over the quarter, moving from 3.57% on March 31st, to 4.16% at the end of the second quarter.  Intermediate term yields more often reflect GDP and expectations for future economic growth and inflation rather than actions taken by the FOMC to adjust the Target Rate.  The revised first quarter GDP print was 2.0% (quarter over quarter annualized rate).  Looking forward, the current consensus view of economists suggests a GDP for 2023 around 1.3% with inflation expectations around 4.3%.[ii]

Being a more conservative asset manager, Cincinnati Asset Management Inc. does not buy CCC and lower rated securities.  Additionally, our interest rate agnostic philosophy keeps us generally positioned in the five to ten year maturity timeframe.  During Q2, Index performance was once again tilted toward the lowest rated end of the market as there was a mostly risk-on tone in the quarter.  Additionally, given the positive quarterly return of the Index, our natural cash position was a drag on performance for Q1.  Our credit selections within communications and energy were also a drag to performance.  Benefiting our performance this quarter was our overweight in consumer cyclicals, particularly home construction, and our credit selections in transportation, leisure, and aerospace and defense.

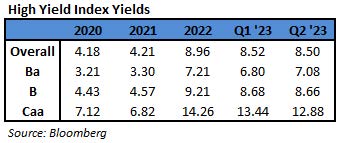
The Bloomberg US Corporate High Yield Index ended the second quarter with a yield of 8.50%.  Treasury volatility, as measured by the Merrill Lynch Option Volatility Estimate (“MOVE” Index), has picked up quite a bit the past 18 months.  Over that timeframe, the MOVE has averaged 122 relative to a 62 average over 2021.  However, the current rate of 110 is well below the spike near 200 back in March during the banking scare.  The second quarter had eight bond issuers default on their debt, taking the trailing twelve month default rate to 1.64%.iii  The current default rate is relative to the 0.86%, 0.83%, 0.84%, 1.27% default rates from the previous four quarter end data points listed oldest to most recent.  The fundamentals of high yield companies still look good considering the uncertain economic backdrop.  From a technical view, fund flows were only slightly negative in the quarter at -$0.6 billion after totaling -$24.3 billion during Q1.iv  No doubt there are risks, but we are of the belief that for clients that have an investment horizon over a complete market cycle, high yield deserves to be considered as part of the portfolio allocation

The Fed will continue to remain a large part of the story in the second half of this year.  While their message to expect more hikes remains clear, market participants have listened as they exited previous positioning for rate cuts later in 2023.  As an aggregate of over 50 institutional contributors, the Bloomberg recession probability forecast currently stands at 65%.  Naturally, there are plenty of reasons to be cautious as lending standards have tightened and defaults are on the rise.  That said, the unemployment rate is sub 4%, demand is resilient, and good fundamentals are still providing cushion.  Our exercise of discipline and selectivity in credit selections is important as we continue to evaluate that the given compensation for the perceived level of risk remains appropriate.  As always, we will continue our search for value and adjust positions as we uncover compelling situations.  Finally, we are very grateful for the trust placed in our team to manage your capital.

This information is intended solely to report on investment strategies identified by Cincinnati Asset Management. Opinions and estimates offered constitute our judgment and are subject to change without notice, as are statements of financial market trends, which are based on current market conditions. This material is not intended as an offer or solicitation to buy, hold or sell any financial instrument.  Fixed income securities may be sensitive to prevailing interest rates.  When rates rise the value generally declines.  Past performance is not a guarantee of future results.  Gross of advisory fee performance does not reflect the deduction of investment advisory fees.  Our advisory fees are disclosed in Form ADV Part 2A.  Accounts managed through brokerage firm programs usually will include additional fees.  Returns are calculated monthly in U.S. dollars and include reinvestment of dividends and interest. The index is unmanaged and does not take into account fees, expenses, and transaction costs.  It is shown for comparative purposes and is based on information generally available to the public from sources believed to be reliable.  No representation is made to its accuracy or completeness.  Additional disclosures on the material risks and potential benefits of investing in corporate bonds are available on our website: https://www.cambonds.com/disclosure-statements/.

i Bloomberg June 29, 2023:  Powell Says Likely Need Two or More Hikes to Cool Inflation

ii Bloomberg July 3, 2023: Economic Forecasts (ECFC)

iii JP Morgan July 5, 2023:  “Default Monitor”

iv CreditSights June 29, 2023:  “Credit Flows”

11 Apr 2023

2023 Q1 High Yield Quarterly

In the first quarter of 2023, the Bloomberg US Corporate High Yield Index (“Index”) return was 3.57%, and the S&P 500 stock index return was 7.48% (including dividends reinvested). Over the period, while the 10 year Treasury yield fell 41 basis points, the Index option adjusted spread (“OAS”) tightened 14 basis points moving from 469 basis points to 455 basis points.

All ratings segments of the High Yield Market participated in the spread tightening as BB rated securities tightened 12 basis points, B rated securities tightened 24 basis points, and CCC rated securities tightened 34 basis points. The chart below from Bloomberg displays the spread moves in the Index over the past five years. The average level over the five years is 406 basis points.

The Brokerage, Consumer Cyclical, and Transportation sectors were the best performers during the quarter, posting returns of 5.02%, 4.80%, and 4.75%, respectively. On the other hand, Banking, Communications, and REITs were the worst performing sectors, posting returns of ‐0.40%, 0.78%, and 1.18%, respectively. At the industry level, leisure, building materials, and healthcare all posted the best returns. The leisure industry posted the highest return of 9.38%. The lowest performing industries during the quarter were office REITs, wirelines, and retail REITs. The office REITs industry posted the lowest return of ‐7.16%.

The primary market remained very subdued during the first quarter. Several factors were at play keeping issuance to a minimum: increase in rates volatility, general market uncertainty, and previously refinanced capital structures. Of the issuance that did take place, Discretionary took 26% of the market share followed by Industrials at a 16% share.

The Federal Reserve continued lifting rates in 2023. The Fed held two meetings this quarter and raised the Target Rate by 0.25% at both the February and March meetings. These increases were on top of the 425 basis points of raises the Fed completed in 2022. “We are committed to restoring price stability,” Chair Jerome Powell said at a press conference following the Fed’s two‐day meeting in March. “It is important that we sustain that confidence with our actions as well as our words.” The March hike took place in the midst of a banking sector scare. Powell did comment that the banking turmoil is “likely to result in tighter credit conditions for households and businesses, which would in turn affect economic outcomes,” but added, “It’s too soon to tell how monetary policy should respond.”i The Fed has spoken at length about the tightness in the labor market. After 475 basis points of raises, the tightness continues. In fact, the unemployment rate is currently at 3.6%, the same level at the start of the hiking cycle. It is likely that some cracks in labor will need to emerge prior to any Fed pivot to lower rates.

Intermediate Treasuries decreased 41 basis points over the quarter, as the 10-year Treasury yield was at 3.88% on December 31st, and 3.47% at the end of the first quarter. The 5‐year Treasury decreased 43 basis points over the quarter, moving from 4.00% on December 31st, to 3.57% at the end of the first quarter. Intermediate term yields more often reflect GDP and expectations for future economic growth and inflation rather than actions taken by the FOMC to adjust the Target Rate. The revised fourth quarter GDP print was 2.6%(quarter over quarter annualized rate). Looking forward, the current consensus view of economists suggests a GDP for 2023 around 1.0% with inflation expectations around 4.3%.ii

Being a more conservative asset manager, Cincinnati Asset Management Inc. does not buy CCC and lower rated securities. Additionally, our interest rate agnostic philosophy keeps us generally positioned in the five to ten year maturity timeframe. After the negative performance of last year, Q1 closed positive across each rating category. The lowest bucket of CCC did perform best over the quarter due to returns built up in January and February. With the banking scare in March, the CCC category returned ‐1.37% relative to the Index return of 1.07%. The quality focus that CAM is known for was a benefit in March. Given the positive quarterly return of the Index, our natural cash position was a drag on performance for Q1. Our credit selections within communications and consumer cyclicals were also a drag to performance. Benefiting our performance this quarter was our underweight in wirelines and communications and our credit selections in consumer noncyclicals, technology, and transportation.

Being a more conservative asset manager, Cincinnati Asset Management Inc. does not buy CCC and lower rated securities. Additionally, our interest rate agnostic philosophy keeps us generally positioned in the five to ten year maturity timeframe. After the negative performance of last year, Q1 closed positive across each rating category. The lowest bucket of CCC did perform best over the quarter due to returns built up in January and February. With the banking scare in March, the CCC category returned ‐1.37% relative to the Index return of 1.07%. The quality focus that CAM is known for was a benefit in March. Given the positive quarterly return of the Index, our natural cash position was a drag on performance for Q1. Our credit selections within communications and consumer cyclicals were also a drag to performance. Benefiting our performance this quarter was our underweight in wirelines and communications and our credit selections in consumer noncyclicals, technology, and transportation.

The Bloomberg US Corporate High Yield Index ended the first quarter with a yield of 8.52%. Treasury volatility, as measured by the Merrill Lynch Option Volatility Estimate (“MOVE” Index), has picked up quite a bit the past 15 months. Over that timeframe, the MOVE has averaged 121 relative to a 62 average over 2021. The banking turmoil several weeks ago had the MOVE spike up to almost 200 and the 2 year Treasury had the widest intraday range since the early 1980s.iii The first quarter had four bond issuers default on their debt, taking the trailing twelve month default rate to 1.27%.iv The current default rate is relative to the 0.23%, 0.86%, 0.83%, 0.84% default rates from the previous four quarter end data points listed oldest to most recent. The fundamentals of high yield companies still look good considering the economic backdrop. From a technical view, fund flows were negative in each month of the quarter totaling ‐$24.3 billion.v No doubt there are risks, but we are of the belief that for clients that have an investment horizon over a complete market cycle, high yield deserves to be considered as part of the portfolio allocation.

The Fed will continue to remain a large part of the story throughout this year. While their message currently remains steadfast, market participants are pricing in a possible transition later this year. Although moving in the right direction, inflation is still too high, and the labor market is still too tight from the Fed’s point of view. This led the Fed in keep increasing rates in the face of the recent banking sector trouble. Market participant’s bets of a transition are suggesting that after a year of aggressive increases, there is not much further the Fed can push. The recession probability forecast currently stands at 65%. There are plenty of reasons to be cautious as lending standards have tightened, defaults are on the rise, and trouble brewing in the commercial real estate market is now on many investors’ radars. That said, supply chains are easing, demand is resilient, high yield maturities are low, and good fundamentals are still providing cushion. Our exercise of discipline and selectivity in credit selections is important as we continue to evaluate that the given compensation for the perceived level of risk remains appropriate. As always, we will continue our search for value and adjust positions as we uncover compelling situations. Finally, we are very grateful for the trust placed in our team to manage your capital.

This information is intended solely to report on investment strategies identified by Cincinnati Asset Management. Opinions and estimates offered constitute our judgment and are subject to change without notice, as are statements of financial market trends, which are based on current market conditions. This material is not intended as an offer or solicitation to buy, hold or sell any financial instrument. Fixed income securities may be sensitive to prevailing interest rates. When rates rise the value generally declines. Past performance is not a guarantee of future results. Gross of advisory fee performance does not reflect the deduction of investment advisory fees. Our advisory fees are disclosed in Form ADV Part 2A. Accounts managed through brokerage firm programs usually will include additional fees. Returns are calculated monthly in U.S. dollars and include reinvestment of dividends and interest. The index is unmanaged and does not take into account fees, expenses, and transaction costs. It is shown for comparative purposes and is based on information generally available to the public from sources believed to be reliable. No representation is made to its accuracy or completeness. Additional disclosures on the material risks and potential benefits of investing in corporate bonds are available on our website: https://www.cambonds.com/disclosurestatements/.

i Bloomberg March 22, 2023: Powell Stresses Commitment to Cooling Prices as Fed Hikes Rates
ii Bloomberg April 4, 2023: Economic Forecasts (ECFC)
iii Bloomberg April 4, 2023: Riding Brutal Yield Swings
iv JP Morgan April 3, 2023: “Default Monitor”
v CreditSights March 30, 2023: “Credit Flows”

12 Jan 2023

2022 Q4 High Yield Quarterly

In the fourth quarter of 2022, the Bloomberg US Corporate High Yield Index (“Index”) return was 4.17% bringing the year to date (“YTD”) return to -11.19%.  The S&P 500 stock index return was 7.55% (including dividends reinvested) for Q4, and the YTD return stands at -18.13%.

The 10 year US Treasury rate (“10 year”) finished at 3.88%, up 0.05% from the beginning of the quarter but did show a bit of volatility with a high in October of 4.24% and a low in December of 3.42%.  Over the period, the Index option adjusted spread (“OAS”) tightened 83 basis points moving from 552 basis points to 469 basis points.  All quality segments of the High Yield Market participated in the spread tightening as BB rated securities tightened 59 basis points, and B rated securities tightened 130 basis points, and CCC rated securities tightened 96 basis points.  The chart below from Bloomberg displays the spread moves in the Index over the past ten years with an average level of 428 basis points.

The Basic Industry, Banking, and Finance Companies sectors were the best performers during the quarter, posting returns of 6.52%, 6.33%, and 6.10%, respectively.  On the other hand, Communications, Technology, and Other Financial were the worst performing sectors, posting returns of 1.82%, 3.04%, and 3.06%, respectively.  At the industry level, gaming, oil field services, and pharma all posted the best returns.  The gaming industry posted the highest return 9.04%.  The lowest performing industries during the quarter were media, healthcare REITs, and retailers.  The media industry posted the lowest return 0.04%.

Crude oil had a few spikes above $90 per barrel as   OPEC+ members agreed to cut oil production by two million barrels per day.  Those levels did not remain long as a concern for economic growth took hold and prices marched lower by roughly $20 per barrel.  As we go to print in early January, crude is at $73 per barrel.  “A panel formed of key nations in the OPEC+ alliance is due to hold a monitoring meeting on Feb. 1. In the meantime, Saudi Energy Minister Prince Abdulaziz bin Salman has said the group will remain “pre-emptive” to keep the crude market in equilibrium.”i

The primary market remained very subdued during the fourth quarter.  The weak market led to full year 2022 issuance of $115.9 billion and $20.7 billion in the quarter.  The chart to the left gives a sense of just how low issuance was in 2022 relative to the past handful of years.  Discretionary took 31% of the market share followed by Technology at a 17% share.  Currently, there isn’t much concern for lack of capital access due to issuers being so proactive with refinancing in the past few years

After the Federal Reserve lifted the Target Rate by 0.75% at their June meeting, Fed Chair Jerome Powell acknowledged that the hike was “an unusually large one.”  The Fed then proceeded to lift the Target Rate at a 0.75% clip at the next three consecutive meetings before downshifting to a 0.50% increase at the December meeting.  All told, the Fed completed 425 basis points of raises in 2022.  The dot plot chart shows how the Fed projections of the 2022 year-end Target Rate have evolved over the past year.  The Fed was clearly behind the curve in keeping rates too low for too long and needed to play catch-up.  It remains to be seen whether they miss on the other side by raising rates too high.  Michael Feroli, chief US economist at JPMorgan said, officials “realize that the risk of overtightening is just something that they have to swallow and stomach.”ii  Chair Jerome Powell acknowledged at the December post-meeting press conference that there is “more work to do,” and the minutes showed Fed officials are intent on lowering inflation back toward their 2% target at the risk of rising unemployment and slower growth.

Intermediate Treasuries increased 5 basis points over the quarter, as the 10-year Treasury yield was at 3.83% on September 30th, and 3.88% at the end of the third quarter.  The 5-year Treasury decreased 9 basis points over the quarter, moving from 4.09% on September 30th, to 4.00% at the end of the third quarter.  Intermediate term yields more often reflect GDP and expectations for future economic growth and inflation rather than actions taken by the FOMC to adjust the Target Rate.  The revised third quarter GDP print was 3.2% (quarter over quarter annualized rate).  Looking forward, the current consensus view of economists suggests a GDP for 2023 around 0.3% with inflation expectations around 4.0%.iii

Being a more conservative asset manager, Cincinnati Asset Management Inc. does not buy CCC and lower rated securities.  Additionally, our interest rate agnostic philosophy keeps us generally positioned in the five to ten year maturity timeframe.  After three quarters of negative performance, Q4 closed positive with quality leading the way.  That quality focus that CAM is known for was certainly on display this quarter.  Further, our underweight within communications and our credit selections within aerospace & defense and consumer cyclicals were a benefit to performance.  The cash position was a drag on performance as was our credit selections within food & beverage.  All totaled, the CAM High Yield Composite Q4 gross of fees total return of 4.78% (4.71% net of fees) outperformed the Index. The full year 2022 Composite gross of fees total return of -12.90% (-13.16% net of fees) underperformed the Index.  Additionally, the Composite 5-year annualized gross of fees total return was 1.87% (1.55% net of fees) versus 2.31% for the Index, and the Composite 10-year annualized gross of fees total return was 2.33% (1.99% net of fees) versus 4.03% for the Index.

The Bloomberg US Corporate High Yield Index ended the fourth quarter with a yield of 8.96%.  Equity volatility, as measured by the Chicago Board Options Exchange Volatility Index (“VIX”), had an average of 25 over the quarter moving from a high of 33 in mid-October to a low of 19 in early December.  For context, the average was 15 over the course of 2019, 29 for 2020, and 19 for 2021.  The fourth quarter had zero bond issuers default on their debt. The trailing twelve month default rate stands at 0.84%.iv  The current default rate is relative to the 0.27%, 0.23%, 0.86%, 0.83% default rates from the previous four quarter end data points listed oldest to most recent.  The fundamentals of high yield companies still look good considering the economic backdrop.  From a technical view, fund flows were positive in October and November but negative in December.  The 2022 year-to-date outflow stands at $56.6 billion.v  While this was the second worst high yield market on record, it is important to remember that bonds are a contractual agreement with a defined maturity date.  Thus, despite price volatility, without default, par will be paid at the stated maturity date.  Currently, defaults are quite low and fundamentals are still providing a cushion.  No doubt there are risks, but we are of the belief that for clients that have an investment horizon over a complete market cycle, high yield deserves to be considered as part of the portfolio allocation.

As we move into 2023, the Fed will continue to remain a large part of the story.  The message from the Fed is unequivocal.  Breaking the back of inflation is job number one.  While caution is warranted as uncertainty remains around the cycle’s terminal rate and depth of an economic slowdown, it seems like progress is being made as there has been five consecutive lower inflation reports.   Markets have been roughed up this year, but brighter days will eventually appear.  As this cycle plays out, current uncertainty and volatility can create opportunities that lead back to positive returns.  Our exercise of discipline and selectivity in credit selections is important as we continue to evaluate that the given compensation for the perceived level of risk remains appropriate.  As always, we will continue our search for value and adjust positions as we uncover compelling situations.  Finally, we are very grateful for the trust placed in our team to manage your capital.

This information is intended solely to report on investment strategies identified by Cincinnati Asset Management. Opinions and estimates offered constitute our judgment and are subject to change without notice, as are statements of financial market trends, which are based on current market conditions. This material is not intended as an offer or solicitation to buy, hold or sell any financial instrument.  Fixed income securities may be sensitive to prevailing interest rates.  When rates rise the value generally declines.  Past performance is not a guarantee of future results.  Gross of advisory fee performance does not reflect the deduction of investment advisory fees.  Our advisory fees are disclosed in Form ADV Part 2A.  Accounts managed through brokerage firm programs usually will include additional fees.  Returns are calculated monthly in U.S. dollars and include reinvestment of dividends and interest. The index is unmanaged and does not take into account fees, expenses, and transaction costs.  It is shown for comparative purposes and is based on information generally available to the public from sources believed to be reliable.  No representation is made to its accuracy or completeness.  Additional disclosures on the material risks and potential benefits of investing in corporate bonds are available on our website: https://www.cambonds.com/disclosure-statements/.

i Bloomberg January 4, 2023: Saudi Arabia Kept Oil Exports Steady in December
ii Bloomberg January 4, 2023: Fed Affirms Inflation Resolve
iii Bloomberg January 4, 2023: Economic Forecasts (ECFC)
iv JP Morgan January 3, 2023: “Default Monitor”
v Wells Fargo December 29, 2022: “Credit Flows”

12 Oct 2022

2022 Q3 High Yield Quarterly

In the third quarter of 2022, the Bloomberg US Corporate High Yield Index (“Index”) return was ‐0.65% bringing the year to date (“YTD”) return to ‐14.74%. The S&P 500 stock index return was ‐4.89% (including dividends reinvested) for Q3, and the YTD return stands at ‐23.88%.

The 10 year US Treasury rate (“10 year”) generally marched higher after a small dip in July as the rate finished at 3.83%, up 0.82% from the beginning of the quarter. Over the period, the Index option adjusted spread (“OAS”) tightened 17 basis points moving from 569 basis points to 552 basis points. The higher quality segments of the High Yield Market participated in the spread tightening as BB rated securities tightened 50 basis points, and B rated securities tightened 12 basis points. Meanwhile, CCC rated securities widened 61 basis points. The chart below from Bloomberg displays the spread moves in the Index over the past ten years with an average level of 430 basis points.

The Energy, Transportation, and Other Industrial sectors were the best performers during the quarter, posting returns of 1.28%, 1.20%, and 0.54%, respectively. On the other hand, Banking, Consumer Non‐Cyclical, and Brokerage were the worst performing sectors, posting returns of ‐3.91%, ‐2.82%, and ‐2.06%, respectively. At the industry level, aerospace and defense, refining, and gaming all posted the best returns. The aerospace and defense industry posted the highest return 3.49%. The lowest performing industries during the quarter were pharma, healthcare REIT, and retailers. The pharma industry posted the lowest return ‐9.57%. Crude oil has continued trending lower as can be seen on the chart at the left. OPEC+ members just met and agreed to cut oil production by two million barrels per day in a bid to help support the price of oil in the face of a weakening global economy. However, it is noted that the impact to supply is likely to be smaller than the headline number. “OPEC and its partners have been meeting online on a monthly basis and weren’t expected to arrange an inperson gathering until at least the end of this year. The slump in prices may have been what prompted the change of tack, requiring the first face‐to‐face talks since 2020.”i

The primary market remained very subdued during the third quarter. The weak market led to year‐to‐date issuance of $95.2 billion and $19.6 billion in the quarter. That is the lowest quarter of issuance in four years. Discretionary took 37% of the market share followed by Technology at a 28% share. Currently, there isn’t much concern for lack of capital access due to issuers being so proactive with refinancing in the past few years. In fact, only about $50 billion in high yield bonds are due to mature from now through the end of 2023.

After the Federal Reserve lifted the Target Rate by 0.75% at their June meeting, Fed Chair Jerome Powell acknowledged that the hike was “an unusually large one.” It may have been a large one, but apparently it was not enough as the Fed raised an additional 0.75% at both the July and September meetings. For those keeping score, that brings the Fed to 300 basis points of raises this year.

The dot plot chart shows how the Fed projections of the 2022 year‐end Target Rate have evolved over the past year. The Fed was clearly behind the curve and now believes stuffing the market with three consecutive “unusually large” hikes in a singular bid to break inflation is the appropriate move, notwithstanding all the other consequences. “We have always understood that restoring price stability while achieving a relatively modest increase in unemployment and a soft landing would be very challenging,” Powell said. “We have got to get
inflation behind us. I wish there were a painless way to do that. There isn’t.”ii Based on the Fed’s Summary of Economic Projections, they accept that the continuing rate hikes are going to lower growth and push up unemployment.

Intermediate Treasuries increased 82 basis points over the quarter, as the 10‐year Treasury yield was at 3.01% on June 30th, and 3.83% at the end of the third quarter. The 5‐year Treasury increased 105 basis points over the quarter, moving from 3.04% on June 30th, to 4.09% at the end of the third quarter. Intermediate term yields more often reflect GDP and expectations for future economic growth and inflation rather than actions taken by the FOMC to adjust the Target Rate. The revised second quarter GDP print was ‐0.6% (quarter over quarter annualized rate). Looking forward, the current consensus view of economists suggests a GDP for 2022 around 1.6% with inflation expectations around 8.0%.iii

Being a more conservative asset manager, Cincinnati Asset Management Inc. does not buy CCC and lower rated securities. Additionally, our interest rate agnostic philosophy keeps us generally positioned in the five to ten year maturity timeframe. Due to the continued rate moves, this positioning was a detractor of performance in the quarter as short‐end maturities outperformed. Further, our credit selections within communications and energy were a drag on performance. Benefiting our performance was our lack of exposure to pharma and our credit selections within healthcare. All totaled, the CAM High Yield Composite Q3 net of fees total return of ‐1.38% underperformed the Index. The Composite YTD net of fees total return of ‐17.06% also underperformed the Index.

The Bloomberg US Corporate High Yield Index ended the third quarter with a yield of 9.68%. Equity volatility, as measured by the Chicago Board Options Exchange Volatility Index (“VIX”), had an average of 25 over the quarter moving from a low of 20 in mid‐August to a high of 32 atthe end of September. For context, the average was 15 over the course of 2019, 29 for 2020, and 19 for 2021. The third quarter had two bond issuers default on their debt. The trailing twelve month default rate stands at 0.83%.iv The current default rate is relative to the 0.92%, 0.27%, 0.23%, 0.86% default rates from the previous four quarter end data points listed oldest to most recent. The fundamentals of high yield companies still look good considering the economic backdrop. From a technical view, fund flows were positive in July but negative in August and September. The 2022 year-to‐date outflow stands at $61.5 billion.v Without question there has been a fair amount of damage in bond markets so far this year. It is important to remember that bonds are a contractual agreement with a defined maturity date. Thus, despite price volatility, without default, par will be paid at the stated maturity date. Currently, defaults are quite low and fundamentals are still providing a cushion. No doubt there are risks, but
we are of the belief that for clients that have an investment horizon over a complete market cycle, high yield deserves to be considered as part of the portfolio allocation.

As we move into the last quarter of 2022, fixed income markets remain pressured as the Fed continues raising the Target Rate. The US dollar has been moving higher all year. Over 80% of central banks around the world are now hiking, the highest percentage on record.vi Japan has taken to currency intervention. The Bank of England is hiking while the British government is pushing through their largest tax cut package since 1972. Citi’s London team commented that euro credit markets are disorderly. Subsequently, the Bank of England started buying gilts while some of the tax cut package was walked back. Back in the US with the message from the Fed steadfast, caution is warranted as uncertainty remains around the cycle’s terminal rate and the resulting depth of an intentional economic slowdown. Markets have been roughed up this year, but brighter days will eventually appear. As this cycle plays out, current uncertainty and volatility can create opportunities that lead back to positive returns. Our exercise of discipline and selectivity in credit selections is important as we continue to evaluate that the given compensation for the perceived level of risk remains appropriate. As always, we will continue our search for value and adjust positions as we uncover compelling situations. Finally, we are very grateful for the trust placed in our team to manage your capital.

This information is intended solely to report on investment strategies identified by Cincinnati Asset Management. Opinions and estimates offered constitute our judgment and are subject to change without notice, as are statements of financial market trends, which are based on current market conditions. This material is not intended as an offer or solicitation to buy, hold or sell any financial instrument. Fixed income securities may be sensitive to prevailing interest rates. When rates rise the value generally declines. Past performance is not a guarantee of future results. Gross of advisory fee performance does not reflect the deduction of investment advisory fees. Our advisory fees are disclosed in Form ADV Part 2A. Accounts managed through brokerage firm programs usually will include additional fees. Returns are calculated monthly in U.S. dollars and include reinvestment of dividends and interest. The index is unmanaged and does not take into account fees, expenses, and transaction costs. It is shown for comparative purposes and is based on information generally available to the public from sources believed to be reliable. No representation is made to its accuracy or completeness.

The information provided in this report should not be considered a recommendation to purchase or sell any particular security. There is no assurance that any securities discussed herein will remain in an account’s portfolio at the time you receive this report or that securities sold have not been repurchased. The securities discussed do not represent an account’s entire portfolio and in the aggregate may represent only a small percentage of an account’s portfolio holdings. It should not be assumed that any of the securities transactions or holdings discussed were or will prove to be profitable, or that the investment decisions we make in the future will be profitable or will equal the investment performance of the securities discussed herein.

i Bloomberg October 4, 2022: OPEC+ Considers Output Limit Cut
ii Bloomberg September 22, 2022: Powell Signals Recession May Be the Price for Crushing Inflation
iii Bloomberg October 3, 2022: Economic Forecasts (ECFC)
iv JP Morgan October 3, 2022: “Default Monitor”
v Wells Fargo September 29, 2022: “Credit Flows”
vi Goldman Global Markets Insights September 23, 2022: Markets/Macro