
(Bloomberg) High Yield Market Highlights
- US junk bond yields plunged to a new six-month low and spreads still hovered near a more than three-month low driving supply to nearly $33 billion in June, the busiest month for new bonds sales since September.
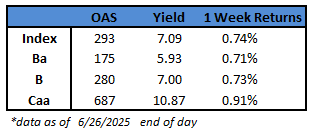
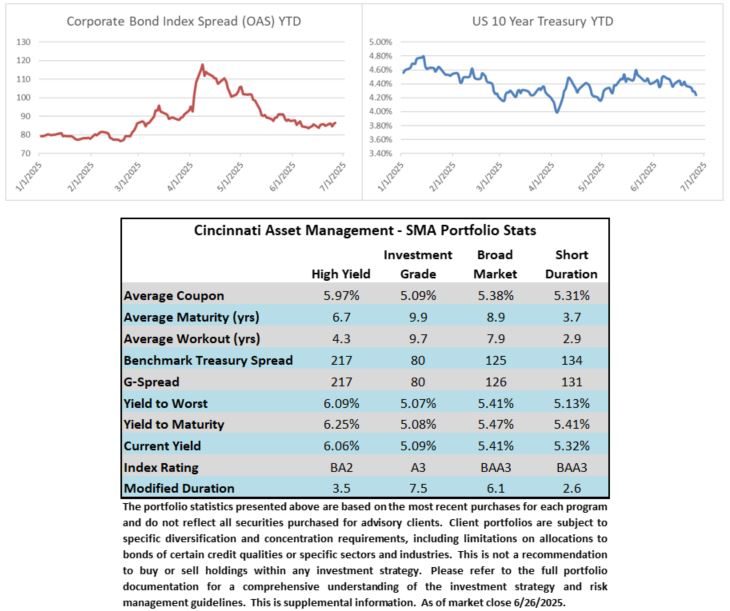
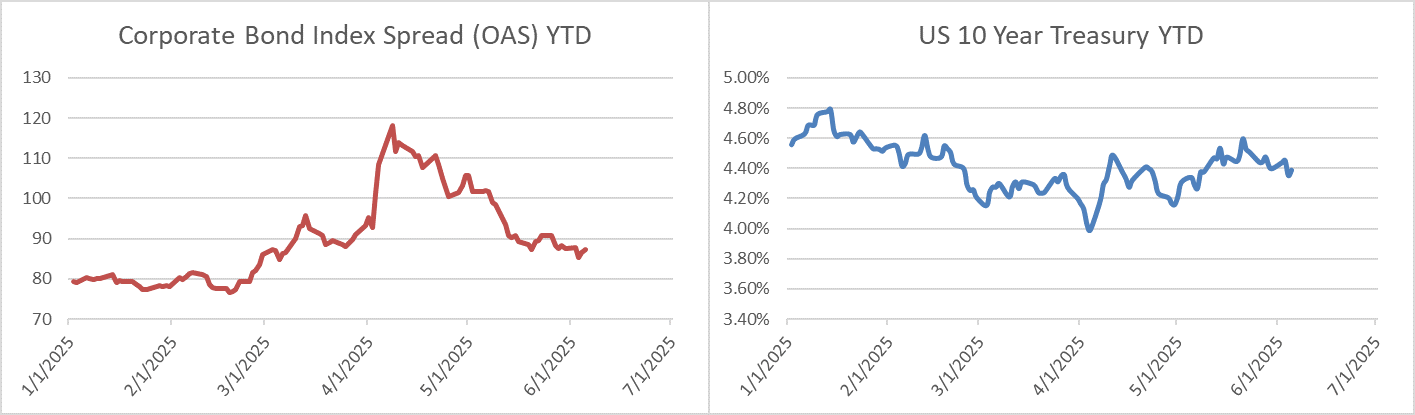
- Yields fell 21 basis points in four sessions and declined for five straight weeks to close at 7.09%, the lowest since December.
- The rally across risk assets was fueled by easing concerns about immediate geopolitical tensions and on expectations that the Federal Reserve will begin rate cuts as data showed US consumer confidence fell unexpectedly and new home sales dropped the most since 2022 on poor affordability. The speculation about rate cuts gained legs after Fed revised its growth forecast for 2025 to 1.4%, down from 1.75% earlier.
- The broad rally in the US junk bond market gained momentum after investors poured cash into the asset class. US junk bonds took in a cash haul of $3.46b for week ended June 25, the biggest weekly inflow since November 2023. This is the ninth consecutive week of cash inflows into high yield funds
- In the primary market, the week’s supply was more than $8b. The June tally is $32.85b
- Barclays revised its 2025 supply forecast downward saying they expect a vast majority of issuance to be refinancings
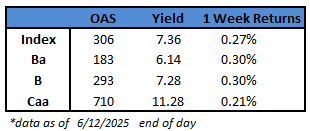
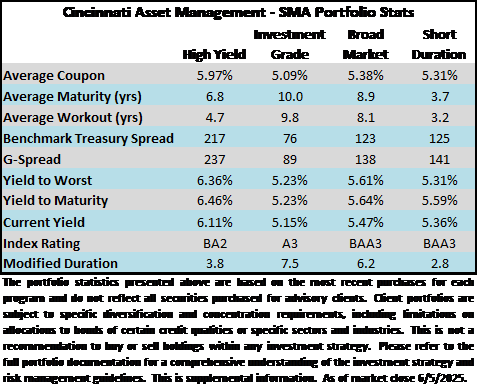
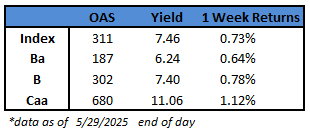
- The recent gains in the US high-yield market extended across ratings. BB yields, the top tier in the high-yield universe with low risk of default, dropped to close at an eight-month low of 5.93% driving gains for six straight sessions
- Single B spreads closed at 280 basis points, still floating near a six-month low. Yields closed at a new year-to-date low of 7%
This information is intended solely to report on investment strategies identified by Cincinnati Asset Management. Opinions and estimates offered constitute our judgment and are subject to change without notice, as are statements of financial market trends, which are based on current market conditions. This material is not intended as an offer or solicitation to buy, hold or sell any financial instrument. Fixed income securities may be sensitive to prevailing interest rates. When rates rise the value generally declines. Past performance is not a guarantee of future results.
 US junk bonds shrugged off a jump in jobless claims and recurring benefits to
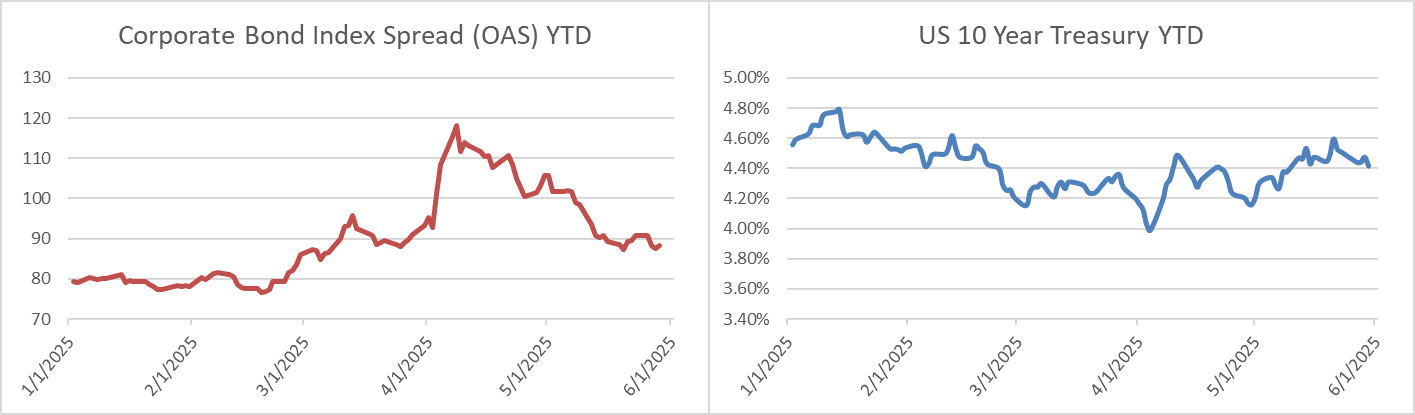
 Economics