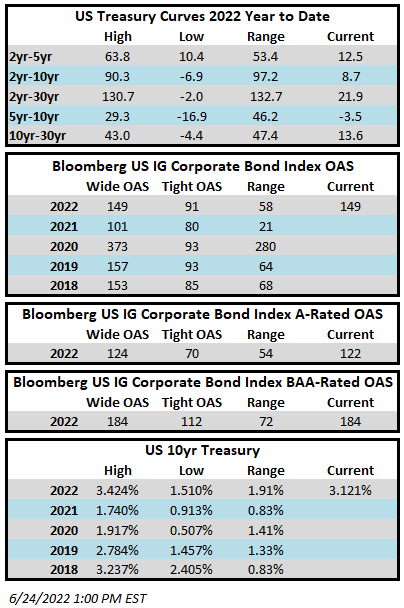
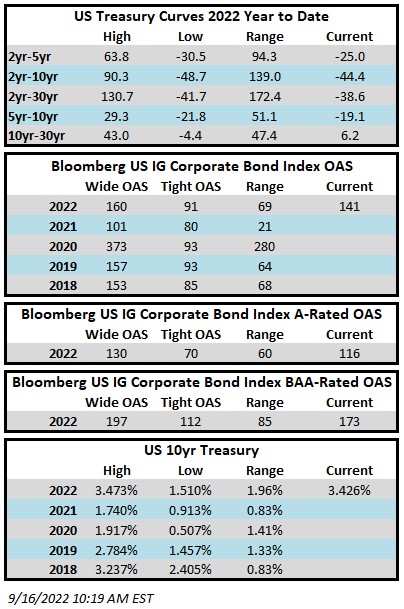
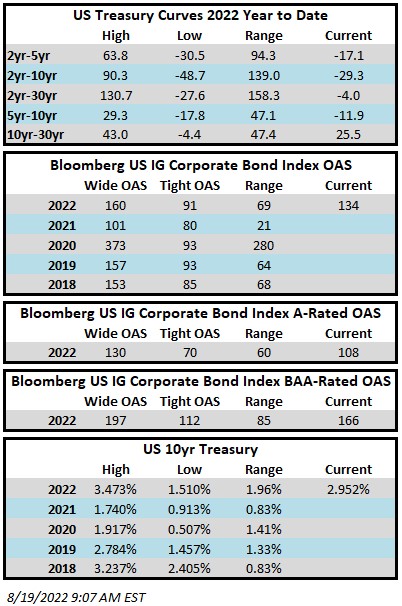
Author: Josh Adams - Portfolio Manager

30 Apr 2022

CAM Investment Grade Weekly Insights

It was an ugly week for risk assets.  The OAS on the Bloomberg US Corporate Bond Index closed the week of April 29th at 135 after having closed the week prior at 132.  The month of April is one that investors would like to forget; it was historically bad for credit and stocks were down substantially.  All eyes will be on the Federal Reserve next Wednesday.  The market is pricing in a 50bps increase in the Fed Funds rate and is awaiting more details on balance sheet run-off.  The Investment Grade Corporate Index had a negative YTD total return of -12.73% through the end of the week while the YTD S&P500 Index return was -12.92% and the Nasdaq Composite Index return was -21.2%.

Volume in the primary market was underwhelming during the week and finished just under $9bln relative to estimates that were in the neighborhood of $25bln.  Per Bloomberg, this boosted the monthly total for April to $107.2bln.  Historically, May is a seasonally busy month and estimates are calling for $125-150bln of monthly supply.   While investor demand for high quality issuers has remained strong, we detect a sentiment of caution among borrowers as their funding costs are higher than they have been in several years so it will be interesting to see if May volume can keep pace with expectations.  There are some large bond deals waiting in the wings related to M&A that could come to market in May and it will also be interesting to see if investors demand higher new issue concessions from those borrowers who in some cases have to float large amounts of new debt.

Per data compiled by Wells Fargo, flows for investment grade were negative on the week.  Outflows for the week of April 21–27 were -$2.4bln which brings the year-to-date total to -$47.5bln.

22 Apr 2022

CAM Investment Grade Weekly Insights

Spreads drifted wider throughout the week and the tape is weak on Friday afternoon for credit and equites as we go to print.  The OAS on the Bloomberg US Corporate Bond Index closed at 128 on Thursday, April 21, after having closed the week prior at 121.  On Thursday, Federal Reserve Chairman Jerome Powell delivered a hawkish message that sent equities lower and credit spreads wider.  Geopolitical tensions and a humanitarian crisis Ukraine also continue to weigh on sentiment.  The Investment Grade Corporate Index had a negative YTD total return of -12% through Thursday.  The YTD S&P500 Index return was -7.4% and the Nasdaq Composite Index return was -15.6%.  The yield to worst for the Corporate Index is now 4.21%, closing in on the high of 4.57% that occurred during the early days of the pandemic in March of 2020.

The primary market was very busy this week with $55 billion in new debt having been brought to market.  Financials led the way with $33bln in issuance from money center banks.  Year-to-date issuance has now topped $551bln, slightly ahead of 2021’s pace.

Per data compiled by Wells Fargo, flows for investment grade were negative on the week.  Outflows for the week of April 14–20 were -$2.8bln which brings the year-to-date total to -$45.1bln.

11 Apr 2022

2022 Q1 Investment Grade Quarterly

It was an extremely painful start to the year for credit markets as performance suffered due to wider spreads and higher interest rates. During the first quarter, the option adjusted spread (OAS) on the Bloomberg US Corporate Bond Index widened by 24 basis points to 116 after having opened the year at an OAS of 92. Interest rates finished the first quarter higher across the board. The 10yr Treasury opened the quarter at 1.51% and closed 83 basis points higher, at 2.34%. The move in the 5yr Treasury was even more dramatic as it rocketed higher by 120 basis points, from 1.26% to 2.46%. The 2yr Treasury saw the most movement of all with a 160 basis point increase from 0.73% to 2.33%. The extreme move higher in interest rates led to negative returns for fixed income products across the board. The Corporate Index posted a quarterly total return of ‐7.69%, its second worst quarterly return in history. The only quarter that was worse than this one was the 3rd quarter of 2008 in the midst of the Great Recession when the index posted a quarterly return of ‐7.80%. CAM’s net of fees 1st quarter total return was ‐6.75%.

You own bonds, now what?

 Is now the time to panic? While we are certainly disappointed with short term negative performance we believe investors that are committed to the asset class will be rewarded over a longer time horizon. The thesis for owning investment grade credit as part of an overall diversified portfolio has not changed. Investors look to highly rated corporate bonds for diversification, income, and to decrease the volatility of their overall portfolio. While higher Treasury yields have led to negative performance for the past quarter it has also led to opportunity with investment grade yields that are now at their highest levels since the spring of 2019. Higher yields mean that newly issued corporate bonds will have larger coupons and more income generation.

For those who may view recent returns as a signal to either enter or exit certain asset classes, we would caution against such an attempt at market timing that currently might lead one to exit the investment grade corporate bond market. This is especially true when credit conditions are strong and the loss of value that occurred during the quarter was almost entirely driven by interest rates and not by the general creditworthiness of the investment grade universe. It is important to remember that bonds are a contractual obligation by the issuer – the bonds will continue to inch closer to maturity and pay coupons along the way. An investor who has seen a bond decrease in value will recapture some portion of that value over time in the form of coupon payments and an increase in principal value as the bond rolls down the yield curve toward maturity and its price converges toward par.

During the first quarter we experienced dramatically higher Treasury rates along with wider credit spreads. To put it into historical context, it was the second worst quarter for the Corporate Index since its inception in 1973. It is not easy to step in and buy here amid negative sentiment regarding the Fed and interest rates but we believe that is precisely what investors should be doing.

Credit Conditions

 The investment grade credit markets were in very good health at the end of the first quarter. The secondary market has been liquid and the primary market was fully functioning, even during the volatile period for risk assets that coincided with early days of Russia’s invasion of Ukraine. Cash on investment grade non‐financial firms’ balance sheets was at all‐time highs at the end of 2020 and 2021.i Leverage ratios for IG‐rated issuers spiked during the early innings of the pandemic but leverage has since come down substantially and is now below pre‐pandemic levels.ii In 2020, due to the early severity of the pandemic, there were $186bln in downgrades from investment grade to high yield. That trend reversed sharply in 2021 with just $7bln in downgrades during the entire year while there were $35bln in upgrades from HY to IG. 2022 will go down in history as the “year of the upgrade” and there were $31bln in upgrades during the first quarter of 2022 alone.

J.P. Morgan has identified an additional $230bln of HY‐rated debt that could make its way to investment grade by the end of 2022. There is a high probability that 2022 will shatter records for the most upgrades during a calendar year. As far as the new issue market is concerned, the numbers have been very strong. March was the 4th busiest month on record for the primary market with $229.9bln in volume. There was $453.4bln of new issuance through the end of the first quarter, which was 4% ahead of the pace set in 2021.iii In aggregate, the investment grade universe is strongly positioned from the standpoint of credit worthiness and access to capital. We believe this is supportive of credit spreads.

Inflation, Interest Rates, the Fed: Impact on Credit

 Inflation and interest rates are understandably a hot topic in our discussions with investors. Inflation is a problem, and headline PCE, which is the Fed’s preferred inflation gauge showed a year‐over‐year increase of

+6.4% for its February reading.iv Chairman Powell has responded with forceful rhetoric that the FOMC will do everything in its control to reign in price increases and the market has bought in. The consensus view is that inflation will slow throughout 2022. Along those same lines, it is widely anticipated that economic growth will slow throughout 2022 as well. At this point it seems likely that the Fed will raise its target rate by 50 basis points at its May and June meetings and then it could raise by 25 basis points in July, September, November and December. This is largely priced in at this point.v The risk with the Fed’s stance on inflation is that it could start to aggressively tighten monetary policy just as consumer spending begins to decline thus lighting the fire for a recession. History shows that it is very difficult for monetary policy to fight inflation and avoid a recession at the same time, thus the odds of a recession at some point over the next two years has increased substantially. Note that a recession simply means the economy has had two consecutive quarters of negative GDP growth –it is not a good thing, but a modest shallow recession does not necessarily mean economic disaster.

For credit, slower or negative growth likely means wider spreads but we would expect investment grade to outperform other risk assets in such a scenario. Investment grade balance sheet fundamentals are very strong and margins had been expanding until very recently and are near their peak. At some point, inflation will start to take a bite out of margins for some industries but in aggregate corporate credit is in very good health and well positioned to weather a storm. If the Fed manages to achieve its goal of a soft landing then that would be a scenario where risk assets perform reasonably well, but it could be accompanied by interest rates that inch higher from here, which would be a headwind for longer duration credit. An additional risk is that neither inflation nor economic growth decline in line with expectations throughout the rest of 2022; although we believe that this is the less likely of the two scenarios, it does remain a possibility that this path comes to fruition. If this happens then the Fed will have to become uber‐hawkish and may have no choice but to force the economy into recession to cool inflation.

What Does an Inverted Yield Curve Mean for Credit?

 As a reminder, at CAM we position client portfolios in intermediate maturities. We typically purchase bonds that mature in 8‐10 years and then allow those bonds to roll down the yield curve, holding them for 3‐5 years before we sell and redeploy the proceeds into another bond investment. We do this because the 5/10 portion of both the Treasury curve and the corporate credit curve have been historically typically steep relative to the other portions of both of those curves. We prefer a steep 5/10 Treasury curve but at the end of the 1st quarter that curve was ‐12 basis points. Our strategy still works when there is an inverted Treasury curve because there is a corporate credit curve that trades on top of the Treasury curve that classically steepens when the Treasury curve flattens resulting in extra compensation for incremental duration. See the below chart that compares the Treasury curve at quarter end against the corporate credit curves of two bond issuers:

Note that the curve for Charter is steeper than Progressive. This is typical given that Charter is a lower quality credit than Progressive; the curve should be steeper for incremental credit risk. Curves are moving all the time and change by the day or even by the hour. To provide some recent historical context, the 5/10 Treasury curve was 80+ basis points just one year ago, which was its steepest level at any time in the previous 5 years –things can change quickly. Corporate curves also vary by industry with fast changing industries like technology typically having steeper curves than stable more predictable industries. It is the constant monitoring of these curves and the subsequent implementation of trades where an active manager adds value to the bond investment management process.

There are a variety of reasons that Treasury curves invert but the main reason comes down to Federal Reserve policy and its impact on the front end of the Treasury curve. Increasing the Federal Funds Rate has a disproportionate impact on Treasuries that mature in 5 years or less and especially those that mature in 2 years. Longer term Treasuries like the 10yr are much more levered to investor expectations for economic growth and longer term inflation expectations. We would note that this Treasury curve inversion is still very fresh and corporate credit curves have steepened moderately in the meantime. Over time, if Treasuries remain inverted, we expect to see more steeping of corporate credit curves.

Looking Ahead

 It has been a tough start to the year but it is only April and there is still much to be written before we close the book on 2022. There are significant unknowns and risk factors that loom large as we navigate the rest of the year. The largest geopolitical uncertainty is the Russo‐Ukrainian War but China’s “zero‐Covid” policies are another risk that may not be fully appreciated by the markets as a slow‐down in China could have significant ramifications for global economic growth. Domestically, Federal Reserve policy is at the forefront and there are also mid‐term elections in the fall.

We believe higher Treasury yields and reasonable valuations for credit spreads along with healthy credit conditions for investment grade issuers have made the investment grade asset class as attractive as it has been in several years. The risk to our view is that Treasury yields could go even higher from here creating additional performance headwinds for credit.

We will be doing our best to navigate the credit markets in a successful manner the rest of this year and we appreciate the trust you have placed in us as a manager. Thank you for your business and please do not hesitate to contact us with any questions or comments.

This information is intended solely to report on investment strategies identified by Cincinnati Asset Management. Opinions and estimates offered constitute our judgment and are subject to change without notice, as are statements of financial market trends, which are based on current market conditions. This material is not intended as an offer or solicitation to buy, hold or sell any financial instrument. Fixed income securities may be sensitive to prevailing interest rates. When rates rise the value generally declines. Past performance is not a guarantee of future results. Gross of advisory fee performance does not reflect the deduction of investment advisory fees. Our advisory fees are disclosed in Form ADV Part 2A. Accounts managed through brokerage firm programs usually will include additional fees. Returns are calculated monthly in U.S. dollars and include reinvestment of dividends and interest. The index is unmanaged and does not take into account fees, expenses, and transaction costs. It is shown for comparative purposes and is based on information generally available to the public from sources believed to be reliable. No representation is made to its accuracy or completeness.

 The information provided in this report should not be considered a recommendation to purchase or sell any particular security. There is no assurance that any securities discussed herein will remain in an account’s portfolio at the time you receive this report or that securities sold have not been repurchased. The securities discussed do not represent an account’s entire portfolio and in the aggregate may represent only a small percentage of an account’s portfolio holdings. It should not be assumed that any of the securities transactions or holdings discussed were or will prove to be profitable, or that the investment decisions we make in the future will be profitable or will equal the investment performance of the securities discussed herein

i Goldman Sachs Global Investment Research, March 28 2022, “IG capital management: Deleveraging is the exception, not the rule”

ii Bloomberg, Factset, Goldman Sachs Global Investment Research

iii Bloomberg, March 31 2022, “IG ANALYSIS: Corebridge Debut Closes Out Record $230bln Month”

iv CNBC, April 1 2022, “The Fed’s preferred inflation gauge rose 5.4% in February, the highest since 1983”

v Bloomberg, March 14 2022, “Fed Traders Now Fully Pricing In Seven Standard Hikes for 2022”

18 Mar 2022

CAM Investment Grade Weekly Insights

The trend of wider spreads was broken in a big way this week as credit is poised to finish the week meaningfully tighter.  The OAS on the Bloomberg US Corporate Bond Index closed at 127 on Thursday, March 17, after having closed the week prior at 143.  Spreads hit their widest levels of the year on Monday with a close on the index of 145 and Tuesday wasn’t much better at 144 but then the sentiment shifted in a big way on Wednesday and Thursday as spreads ripped tighter on the back of strong demand from all types of investors.  As expected the FOMC began a tightening cycle on Wednesday with a quarter point raise of the Federal Funds Rate.  The messaging from the Fed was slightly more hawkish than expected which resulted in some weakness in the Treasury market and slightly higher rates.  The Fed appears to be committed to curbing inflation while attempting to engineer a soft landing for the economy.  The Investment Grade Corporate Index had a negative YTD total return of -8.36% through Thursday.  The YTD S&P500 Index return was -8.6% and the Nasdaq Composite Index return was -14.1%.

The primary market was reasonably busy this week with $29 billion in debt having been brought to market.  Per Bloomberg, this boosted the monthly total for March to over $158bln.  There is a reasonably good chance that we could see over $200bln in new issuance before the month is over with consensus estimates calling for $30bln in supply next week.

Per data compiled by Wells Fargo, flows for investment grade were negative on the week.  Outflows for the week of March 10–16 were -$4.3bln which brings the year-to-date total to -$26.9bln.

11 Mar 2022

CAM Investment Grade Weekly Insights

Spreads are wider week over week in what seems to have become a recurring theme.  The tone of the market is mixed as we go to print this Friday afternoon but market participants remain wary of risk.  Geopolitical turmoil in Europe remains at the forefront but there have been other challenges and there are more ahead –the market survived the highest CPI print in over 40 years on Thursday morning and all eyes are looking toward the FOMC meeting next Wednesday.  The OAS on the Bloomberg US Corporate Bond Index closed at 141 on Thursday, March 10, after having closed the week prior at 130.  The Investment Grade Corporate Index had a negative YTD total return of -7.9% through Thursday.  The YTD S&P500 Index return was -10.6% and the Nasdaq Composite Index return was -16.1%.

The primary market had its 8th busiest week on record and volume will approach $70bln by the end of the week.  Magallanes, which is the WarnerMedia SpinCo for assets that AT&T is selling to Discovery Communications, led all issuers this week with a $30bln debt deal across 11 tranches.  This was the fourth largest bond offering in history.  Next week should continue to see a brisk pace of issuance as it is well known that Oracle will soon be in the market to finance its acquisition of Cerner and there are other issuers waiting in the wings as well.  We have mentioned this in previous notes but it bears repeating; even amid widening spreads, geopolitical uncertainty and a pivot in Fed policy, the investment grade new issue market remains wide open and the secondary market is showing signs of good liquidity and two-way flow with low transaction costs.

Per data compiled by Wells Fargo, flows for investment grade were negative on the week.  Outflows for the week of March 3–9 were -$4.7bln which brings the year-to-date total to -$19.3bln.

04 Mar 2022

CAM Investment Grade Weekly Insights

For the second consecutive week, spreads will finish a Thursday evening at the widest levels of the year.  The tone of the market is also feeling heavy this Friday morning as we got to print amid geopolitical fallout from Europe.  The prospect of a nuclear incident at a Ukrainian facility is not something the markets are taking lightly. On the domestic front, the Friday morning jobs report showed that U.S. hiring was strong in February with employment numbers handily beating consensus estimates along with an unemployment rate that edged lower, to 3.8%.  This news likely keeps the Federal Reserve on track to begin its hiking cycle at its meeting later this month.  The OAS on the Bloomberg US Corporate Bond Index closed at 125 on Thursday, March 3, after having closed the week prior at 121.  The Investment Grade Corporate Index has posted a negative YTD total return of -5.8% through Thursday.  The YTD S&P500 Index return was -8.4% and the Nasdaq Composite Index return was -13.5%.

The primary market was extremely active this week with 31 deals totaling over $53bln with at least one deal pending on Friday that will add to this total.  This speaks to the resiliency of the investment grade credit market– even amid geopolitical uncertainty; the market remains open for business in a big way.  Next week’s consensus forecast is calling for things to remain busy with predictions of more than $40bln in new issue.  March is typically a seasonally busy month for issuance and it appears that 2022 is no exception.

Per data compiled by Wells Fargo, flows for investment grade were negative on the week.  Flows for the week of February 24–March 2 were -$2.1bln which brings the year-to-date total to -$14.7bln.

25 Feb 2022

CAM Investment Grade Weekly Insights

Spreads finished Thursday of this week at their widest levels of the year but there has been a significant retracement through Friday morning.  The first half of the trading day on Thursday was extraordinarily weak with poor performance for risk assets as investors digested the news out of Europe before equities and credit staged a stunning reversal that afternoon.  The OAS on the Bloomberg US Corporate Bond Index closed at 124 on Thursday, February 25, after having closed the week prior at 118.  Investment grade has posted its worst start to a year ever with the Corporate Index down -6.5% total returns through Thursday.  The YTD S&P500 Index return was -9.77% and the Nasdaq Composite Index return was -13.69%.

The primary market was less active than expected this week with the backdrop of geopolitical tensions but investment grade companies still managed to issue $18bln of new debt.  Next week’s consensus forecast is calling for more than $25bln in new issue and some sell side prognosticators are predicting an extremely busy calendar for March with as much as $175bln+.  There are some jumbo deals waiting in the wings that could print next month which could balloon that figure even further.

Per data compiled by Wells Fargo, flows into investment grade were modestly positive on the week.  Flows for the week of February 17–23 were +$0.4bln which brings the year-to-date total to -$12.7bln.

11 Jan 2022

2021 Q4 Investment Grade Quarterly

Investment grade corporate credit spreads finished the year little changed. For the full year 2021, the option adjusted spread (OAS) on the Bloomberg US Corporate Bond Index tightened by 4 basis points to 92 after having opened the year at an OAS of 96. The 4th quarter saw more movement, with the spread on the index moving wider, opening the quarter at 84 and closing at 92.

Treasuries finished the 4th quarter nearly unchanged. The 10yr Treasury opened the 4th quarter at 1.49% and closed at 1.51%. There was much more movement within the full year number with the benchmark 10yr opening 2021 at 0.91% and closing as high as 1.74% at the end of the first quarter before receding into the close of the second quarter and then trading higher from there, closing the full year 60 basis points higher at 1.51%.

The Corporate Index eked out a positive return during the fourth quarter, posting a total return of +0.23%. This compares to CAM’s net 4th quarter total return of -0.30%.

For the full year 2021, although spreads were slightly tighter, it was not enough to offset the move higher in interest rates. The Corporate Index posted a full year total return of -1.04%. This compares to CAM’s net full year total return of -1.38%.

Few Things Worked in 2021
Broadly speaking it was a tough year for investment grade credit. The Long portion (10+ years to maturity) of the US Corporate Index underperformed the Intermediate portion by 13 basis points on the back of higher Treasury rates. The “risk-on” trade has been in full effect since mid-2020 and that theme continued in 2021 with lower quality IG credit outperforming higher quality during 2021.

Recall that CAM has a structural underweight in Baa-credit and targets a ceiling of 30% exposure to this riskier segment of the market while the index is >50% Baa-rated. CAM also targets an A rating for its client portfolios
while the index is rated A3/Baa1.

As far as individual sectors go, there were a couple winners. At the sector level, only Energy and the Other Industrial sectors posted positive total returns on the year, of +1.39% and +0.88%, respectively. While Energy represented a major sector with a 7.72% index weighting, Other Industrial is quite small and represented just 0.48% of the Corporate Index. As far as individual industries were concerned, those industries under the Energy umbrella led the way with Independent Energy, Oil Field Services, Refining and Midstream posting total returns of +1.60%, +2.45%, +2.48% and +2.46%, respectively. The best performing individual industry was Airlines with a +4.48% total return.

The sectors that posted the biggest losses were Utilities, Technology and Consumer Noncyclical with returns of -2.15%, -1.98% and -1.30%, respectively. It may seem counterintuitive but while these industries are some of the most stable, high quality was not in favor during 2021 and instead risk taking ruled the day. Outside of the various utility sub-industries, the worst performing individual industries were Tobacco and Cable & Satellite with returns of -2.32% and -2.12%, respectively.

A Year of Little Change
2021 was one of the least volatile years for IG credit—the index OAS traded in a range of just 21 basis points. To find a less volatile year we have to go all the way back to 2006 when the range was just 12 basis points.

Ironically, the low volatility of 2006 continued well into 2007, just prior to the two most chaotic years in the history of investment grade credit. Please note that we do not expect a repeat performance of this in 2022 given the exogenous factors that were in play back in 2008-2009. In fact we predict quite the opposite, and our opinion is that 2022 will be a year of spread stability similar to 2021. There have been sustained periods of time in the history of our market where spreads have traded at levels beneath or near 100, and barring a geopolitical crisis or unexpected shock to the global economy, we see little reason that spreads should move meaningfully over the course of the next year. They may move wider or they may move tighter but we feel pretty comfortable pegging a spread of 100 +/- 20bps type of valuation target for the end of 2022.

Predicting fund flows is always a difficult but, even after $323.8 billion of inflows during 2021 into IG credit, making it the second largest year on record, we expect demand to remain positive going into 2022i. After such a strong performance for equities in 2021, pension funds will continue to look to rebalance and demand from institutional investors both domestic and foreign should remain strong. Additionally, IG credit will likely benefit from “flattish” gross new issuance supply and most Wall Street prognosticators are predicting substantially less net new issue supply as the amount of debt that matures in 2022 is larger than what we have experienced in recent years. Less supply of new bonds creates a more supportive environment for credit spreads in the secondary market and for the market as a whole. One factor that could make a difference at the margin is the amount of high yield debt that is upgraded to investment grade during the course of the year. Current expectations are calling for a robust upgrade cycle in 2022 and these companies will often issue new debt when they achieve investment grade status. Past experience tells us that much of this debt ends up being “leverage neutral” as lower interest rate investment grade debt is used to retire higher interest rate legacy high yield debt. However, the debt is still net new for the investment grade market since these companies were previously part of the high yield market. If we experience even more upgrades than the upper limit of the rosiest predictions then that could make for higher new issue supply numbers within the IG market.

In our view, the biggest potential driver of benign spread volatility during 2022 is that the economy is likely to continue to grow at above average levels and that the typical investment grade company is in good health from a balance sheet perspective. The median real GDP forecast is predicting growth of +3.9% in 2022 which is solidly above trendii. Companies are still sitting on elevated cash balances but as we have written about in past commentaries this will not last forever. As we move into 2022, it becomes increasingly likely that this cash will start being deployed for shareholder returns and M&A will move to the forefront. 2022 is shaping up to be much more of a credit pickers market instead of a market that generically rewards all risk-taking.

The Return of Dispersion

We have seen erosion in the quality of the investment grade universe, especially over the course of the last dozen years. That data set below is representative of just the past 10 years but the trend really started to manifest itself at the end of 2008, when the Corporate Index was just 33.15% Baa-rated compared to today when it is north of 50%.

Since 2008, the proportion of Baa-rated credit has crept higher with each passing year. There is some noise in these numbers, given the wave of downgrades from investment grade to high yield that occurred in 2020 and that is precisely why the percentage of Baa-rated debt decreased from 2019-2020 –those companies exited the investment grade universe entirely and joined the high yield universe. So the IG universe increased its quality by subtraction, not by improving its credit metrics. Many of these companies that were downgraded to junk have since repaired their balance sheets and some will earn upgrades and will be returning to investment grade in 2022, boosting the number of lower rated IG companies by the end of the year. Additionally, there are a relatively large number of rising stars within the high yield ranks currently that were not previously rated IG, many of which will be earning upgrades throughout the year. Taking it altogether, there is a good chance that year end 2022 will mark a new high for the proportion of Baa-rated credit within the Corporate Bond Index.

The purpose of this example is not to show that all Baa-risk is bad, because that is not the case. Consistently, the worst performers in IG credit are those companies that move from Aa or A rated down to Baa. On the other hand, some of the best performing credits are those companies that are currently high yield or split rated (half high yield, half investment grade) with the potential to improve their credit metrics and earn a full investment grade rating. We believe that 2022 will offer opportunity, both in the form of identifying such companies and by avoiding those weakly positioned A-rated credits that will join the ranks of the growing Baa-rated cohort. This is one of the reasons that you will see us occasionally invest in companies with just one IG rating and up to 1 or 2 HY ratings. It is usually because we expect the company to become fully IG-rated and we want to take advantage of associated spread compression for our clients. We also do not hamper ourselves with “automatic sale” rules in the event that a current portfolio holding loses IG ratings by getting downgraded to HY. Instead we will rely on our credit research to determine if it makes sense to continue to hold the bonds of a downgraded company and if it has a chance to regain IG status over our investment time horizon. The Baa-universe is chock full companies with bonds that trade at unattractive valuations from a risk reward standpoint. We are looking to provide our clients with a return that is equal to or greater than the Corporate Index but we want to do so by incurring less volatility –hence our structural underweight of Baa-rated credit versus the index. At the end of the day the only way an investor can identify these opportunities is by blocking and tackling and good old fashioned credit work which is one of the cornerstones of our investment grade program and but one of the ways we will look to add value for our clients in the year ahead.

The Federal Reserve & The “I” Word

At its November meeting, the Fed signaled its intent to complete the tapering of its asset purchases by the end of June. However, the landscape had changed by the time the December 15 meeting came around, and in a move to combat rising inflation, the Fed accelerated its tapering timeline. The Fed now expects to finish its taper by the end of March which would create the potential for a Fed Funds rate hike as soon as its March 16 2022 meetingiii. With the end of tapering occurring in the near term, it will be quite interesting to hear the Fed’s plans for the central bank’s $8.76 trillion asset portfolio. Discussions are ongoing and will continue at the January 2022 FOMC meeting but Chairman Powell and other Fed officials have hinted that shrinking the asset portfolio could be another arrow in the quiver that it may use to rein in inflationiv. It could be that the Fed elects to play it very slow with increases in the Fed Funds Rate, instead relying on balance sheet reduction to slow the economy and cool inflation toward its long term target level of 2%. The Fed believes that inflation will slow in the second half of 2022 and this is in line with the consensus view of most economists. In short, we believe the Fed will use all the tools at its disposal to make this a reality even if it means they must use some measures to slow economic growth.

Wrap It Up
2022 is poised to be an interesting year for the credit markets. Although we don’t expect wild swings in the level of credit spreads there could be some pockets of rate-driven volatility at times throughout the year as the Fed embarks on its first tightening cycle since 2018. Inflation will remain at the forefront and time will tell if those pressures ease in the second half of the year. The pandemic enters its third year and geopolitical uncertainty looms as it pertains to Russian and the Ukraine, both of which could impact risk assets or spark a flight to quality. The case for Investment Grade as an asset class today is for its downside protection, diversification and income generation. The time will come when total returns move back to the forefront but it is hard to make an argument for more than coupon-like returns in the current environment. Investors with strategic goals and medium to long time horizons have recognized the benefits of a permanent allocation to IG credit.

We wish you a happy and healthy 2022. We will be doing our best to navigate the credit markets in a successful manner and we appreciate the trust you have placed in us as a manager of your hard earned capital. As always, thank you for your business and please do not hesitate to reach out to us with any questions or comments.

i Wells Fargo Securities, January 3 2022 “Credit Flows | Special FY 2021 Edition”
ii Bloomberg, January 3 2022 “US GDP Economic Forecast Real GDP (YoY%) (78 responses)
iii Federal Reserve Open Market Committee, December 15 2021 “Statement Release”
iv The Wall Street Journal, January 4 2022 “Fed Weights Proposals for Eventual Reduction in Bond Holding”

This information is intended solely to report on investment strategies identified by Cincinnati Asset Management. Opinions and estimates offered constitute our judgment and are subject to change without notice, as are statements of financial market trends, which are based on current market conditions. This material is not intended as an offer or solicitation to buy, hold or sell any financial instrument. Fixed income securities may be sensitive to prevailing interest rates. When rates rise the value generally declines. Past performance is not a guarantee of future results. Gross of advisory fee performance does not reflect the deduction of investment advisory fees. Our advisory fees are disclosed in Form ADV Part 2A. Accounts managed through brokerage firm programs usually will include additional fees. Returns are calculated monthly in U.S. dollars and include reinvestment of dividends and interest. The index is unmanaged and does not take into account fees, expenses, and transaction costs. It is shown for comparative purposes and is based on information generally available to the public from sources believed to be reliable. No representation is made to its accuracy or completeness.

10 Dec 2021

CAM Investment Grade Weekly Insights

Spreads will finish the week tighter, reclaiming some ground after having experienced headwinds in the week prior which saw the index close two days at 101 –its widest level of 2021.  The OAS on the Bloomberg US Corporate Bond Index closed at 96 on Thursday, December 9, after having closed the week prior at 100.  Treasury volatility has been a common theme in recent weeks and this week was no exception.  The 10yr Treasury is 1.47% on Friday morning after having closed last week at 1.34%.  Through Thursday, the Corporate Index had posted a year-to-date total return of -1.26% and an excess return over the same time period of +1.25%.  The Federal Reserve is currently within its blackout period as the market patiently awaits the next FOMC decision on Wednesday of next week.


The primary market was active this week with Merck leading all issuers with an outsize $8bln print.  In all, over $38bln in new debt was brought to market during the week.  This month can be seasonally slow but that has not been the case this year with a record breaking amount of new issuance during the month of December ($61.7bln) which is impressive to be sure given we are not yet half  way through the month. According to data compiled by Bloomberg, $1,411bln of new debt has been issued year-to-date.  2021 has firmly secured its place in history as the 2nd busiest year for issuance on record but it still trails 2020’s record breaking volume by almost 20%.  Issuance consensus estimates for next week are calling for only $5bln but we are skeptical and would not be surprised if Monday and Tuesday bring some activity.  Wednesday is likely to be very quiet with the FOMC on the tape.

Per data compiled by Wells Fargo, flows into investment grade credit for the week of December 2–8 were +$0.885bln which brings the year-to-date total to +$321bln.

05 Nov 2021

CAM Investment Grade Weekly Insights

Spreads inched tighter throughout the week.  The OAS on the Blomberg Barclays Corporate Index closed at 86 on Friday, November 5, after having closed the week prior at 88.  On Wednesday, in a move that was widely anticipated, the Federal Reserve proceeded with the implementation of its plan to gradually taper the pace of asset purchases. Treasury yields moved lower after the FOMC meeting with the yield on the 10yr Treasury finishing the week at 1.45%, 10 basis points lower from its close the week prior.  Even a solid payrolls report with an upward revision to prior data was not enough to stem the rally in rates.  Through Friday, the Corporate Index had posted a year-to-date total return of -0.14% and an excess return over the same time period of +2.06%.

The primary market saw another somewhat active week with $20bln in new debt having been brought to market.   According to data compiled by Bloomberg, $1,258bln of new debt has been issued year-to-date.

Per data compiled by Wells Fargo, outflows from investment grade credit for the week of October 28–November 3 were -$0.280bln which brings the year-to-date total to +$313bln.  This marked the first outflow since March and only the second recorded outflow in the past calendar year.