Author: Josh Adams - Portfolio Manager

03 Feb 2023

CAM Investment Grade Weekly Insights

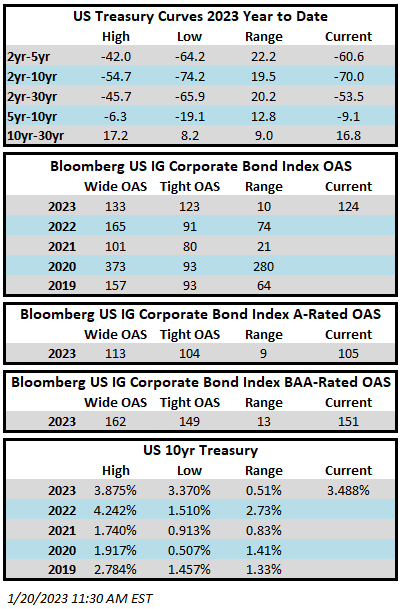
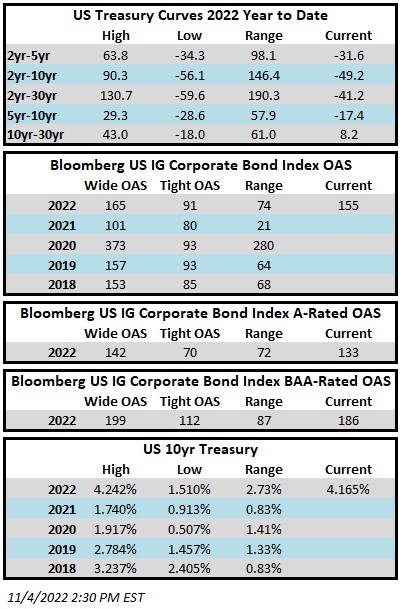
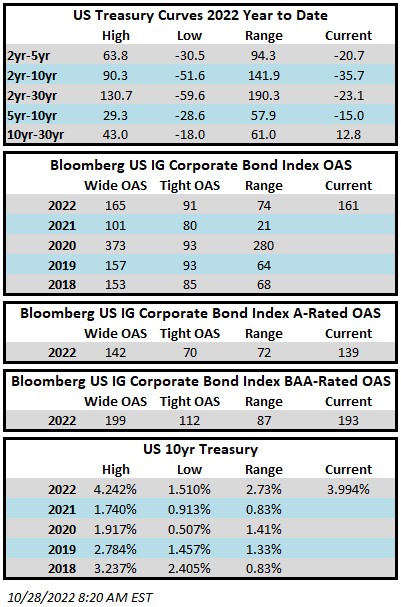
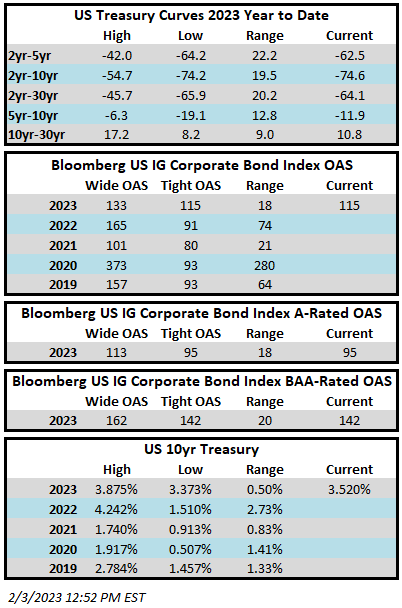
Investment grade credit spreads moved meaningfully tighter this week as demand for IG credit remained consistently strong through the first month of the year.  The Bloomberg US Corporate Bond Index closed at 115 on Thursday February 3 after having closed the week prior at 119.  10yr Treasury closed the week prior at 3.50% and it is trading at 3.52% as we go to print but the benchmark rate did close as low as 3.39% on Thursday evening.  A strong jobs number on Friday morning caused the entire Treasury curve to give up the gains that were made on Thursday.  Through Thursday the Corporate Index had a YTD total return of +5.0% while the YTD S&P500 Index return was +8.9% and the Nasdaq Composite Index return was +16.6%.

There was much to process from a data standpoint this week.  The highlights were the FOMC rate decision on Wednesday which saw the central bank deliver a 25bp increase in Fed funds to a target rate of 4.50%-4.75%.  Chairman Powell’s press conference was relatively neutral and he avoided hawkish overtones but the message was also clear that the Fed will not rest until more progress is made in its fight against inflation.  The ECB was much more hawkish as it delivered a 50bp increase in its Deposit Rate and followed it up by pre-committing to an additional 50bp increase in March –the pre-commitment was somewhat surprising news for the market to digest.  The biggest news of the week was Friday’s U.S. unemployment report which showed that the economy added 517k jobs in January relative to the 188k consensus expectation.  The unemployment rate fell to 3.4%, its lowest level in more than 50 years.  While the increase in average hourly earnings slowed, the strong job growth number makes it more likely that the Fed will deliver another 25bp hike at its next rate decision on March 22. Not to be outdone the BOE also threw its hat in the ring with a 50bp hike of its policy rate but its commentary was more balanced and it did not fully commit to additional rate increases but it also did not take them off the table.

Primary market volume on the week came in at just over $18bln relative to the low end of the $20-$25lbn estimate.  Although volume was a little light relative to estimates, demand was extremely high for the deals that printed this week.  This has led to projections of $30-$35bln of issuance next week.  We anticipate some large deals next week if investor demand continues to remain strong.

Investment grade credit reported another solid week of inflows.  Per data compiled by Wells Fargo, inflows for the week of January 26–February 1 were +4.8bln which brings the year-to-date total to +$22.9bln.

This information is intended solely to report on investment strategies identified by Cincinnati Asset Management. Opinions and estimates offered constitute our judgment and are subject to change without notice, as are statements of financial market trends, which are based on current market conditions. This material is not intended as an offer or solicitation to buy, hold or sell any financial instrument. Fixed income securities may be sensitive to prevailing interest rates. When rates rise the value generally declines. Past performance is not a guarantee of future results. 

20 Jan 2023

CAM Investment Grade Weekly Insights

Investment grade credit spreads moved tighter this week although the move is not yet fully reflected in the index which can lag at times.  The Bloomberg US Corporate Bond Index closed at 124 on Thursday January 19 after having closed the week prior at the same level.  Credit spreads continued to move tighter late Friday morning.  The 10yr Treasury closed the week prior at 3.50% and it is trading at 3.49% as we go to print.  Through this Thursday the Corporate Index had a YTD total return of +4.1% while the YTD S&P500 Index return was +1.6% and the Nasdaq Composite Index return was +3.7%.

There was a slew of economic data this week.  On Tuesday the Empire Survey for manufacturing in the NY region registered the fifth worst reading in its history.  Wednesday brought with it a retail sales release that showed a pullback in consumer spending.  Finally, existing home sales data was released on Friday which posted its 11th consecutive monthly decline and now worst annual drop since 2008.  Taken together, the economic data is showing that the Federal Reserve tightening of financial conditions is having its intended effect of slowing inflation but that it is also taking its toll on the economy.  Recall that the Fed will have its next FOMC rate decision on February 1 and at this point it is still unclear if 25 of 50ps of additional rate hikes will occur at that time.

Primary market volume was underwhelming this week as expected supply from the big six money center banks failed to materialize.  Issuance on the week was only $16bln+ while some estimates had called for as much as $40bln.  The estimates were probably too rosy in our view considering the market was closed on Monday for Martin Luther King Day.  Next week, prognosticators are looking for $20-$25bln in new supply.  The primary calendar will likely be slower the next few weeks until companies have had a chance to report earnings and exit their blackout periods.

Investment grade credit reported another weekly inflow.  Per data compiled by Wells Fargo, inflows for the week of January 12–18 were +3.8bln which brings the year-to-date total to +$12.6bln.


This information is intended solely to report on investment strategies identified by Cincinnati Asset Management. Opinions and estimates offered constitute our judgment and are subject to change without notice, as are statements of financial market trends, which are based on current market conditions. This material is not intended as an offer or solicitation to buy, hold or sell any financial instrument. Fixed income securities may be sensitive to prevailing interest rates. When rates rise the value generally declines. Past performance is not a guarantee of future results. 


13 Jan 2023

CAM Investment Grade Weekly Insights

Investment grade credit spreads move tighter throughout the week.  The Bloomberg US Corporate Bond Index closed at 125 on Thursday January 12 after having closed the week prior at 132.  The 10yr Treasury closed the week prior at 3.56% and it is trading at 3.50% as we go to print on Friday afternoon.  Through this Thursday the Corporate Index had a YTD total return of +3.7% while the YTD S&P500 Index return was +3.8% and the Nasdaq Composite Index return was +5.1%.

There was a treasure trove of economic data this week with the crown jewel being the CPI release on Thursday morning.  Consumer prices rose 6.5% in the past 12 months through the end of December.  The Fed’s preferred metric of core inflation was up 5.7% over the same period which was the smallest increase in over a year.  The majority of market prognosticators believe that the CPI release increases the probability that the Fed will choose to raise its policy rate by 25 basis points on February 1 but 50 basis points remains a possibility.  There was more positive news on the inflation front in the consumer sentiment numbers that were released on Friday morning.  That data showed that respondents expect prices to increase just 4% over the next year.  This was the lowest reading for price expectations since April 2021.  There will be plenty of data to parse in the week ahead and the highlights include retail sales, producer price data and the NAHB housing market index.

The primary market had another strong week with more than $36bln in new supply pushing the total for January to $94.1bln.  Next week is shaping up to strong too as money center banks are expected to tap the debt markets as they exit earnings blackout.  The bond market is closed on Monday in observance of Martin Luther King Day but estimates are still calling for as much as $30-$40bln in new supply during the holiday shortened week.

Investment grade credit reported its largest weekly inflow in over two years.  Per data compiled by Wells Fargo, inflows for the week of January 5–11 were +8.4bln which brings the year-to-date total to +$10.5bln.

This information is intended solely to report on investment strategies identified by Cincinnati Asset Management. Opinions and estimates offered constitute our judgment and are subject to change without notice, as are statements of financial market trends, which are based on current market conditions. This material is not intended as an offer or solicitation to buy, hold or sell any financial instrument. Fixed income securities may be sensitive to prevailing interest rates. When rates rise the value generally declines. Past performance is not a guarantee of future results. 

12 Jan 2023

2022 Q4 INVESTMENT GRADE QUARTERLY

It will be remembered as the year to forget for investment grade corporate credit as the asset class generated the largest negative yearly total return in its history driven by a combination of wider spreads and much higher interest rates.  For the full year 2022, the option adjusted spread (OAS) on the Bloomberg US Corporate Bond Index widened by 38 basis points to 130 after having opened the year at 92.  The 4th quarter was particularly volatile for credit spreads as the OAS on the index traded as wide as 165 in mid-October after which spreads marched steadily tighter into year-end.  Treasuries also experienced a massive amount of volatility in the 4th quarter with the 10yr Treasury trading as high as 4.24% at the end of October and then as low as 3.42% near the beginning of December before finishing the year at 3.88%.  The full year numbers really illustrate the pain-trade for interest rates as the 10yr Treasury posted its largest one-year gain in history of +237 basis points, more than doubling from its starting point of 1.51%.

For the full year 2022, the Corporate Index posted a total return of -15.76%.  CAM’s Investment Grade Program gross of fees total return for the full year 2022 was -13.31% (-13.52% net of fees).  As bad as the year was, the Corporate Index did manage to finish on a high note with a positive 4th quarter total return of +3.63%.  This compares to CAM’s gross 4th quarter return of +2.99% (2.93% net).  Looking at longer time periods, the Corporate Index ended 2022 with 5 and 10-year returns of +0.45% and 1.96%, respectively.  CAM’s investment grade program posted 5 and 10-year gross annualized returns of +0.70% (0.47% net) and 1.90% (1.66% net), respectively.

There was nowhere to hide in 2022, with all buckets of maturities and credit ratings posting negative returns.  Intermediate credit performed relatively better than longer dated credit due to its lower duration.  A-rated credit performed slightly better than the index as a whole and it outperformed both >Aa-rated credit and Baa-rated credit but the returns picture was ugly across the board.

When Will the Tide Turn for Corporate Bonds?

 The fact is that returns for IG credit have already started to improve.  Please note that we are not calling a bottom by any means, we are just observing the data and reasoning that it is entirely possible that the worst is over for this cycle.  When the market closed on November 7, the Corporate Index to that point in the year had posted a negative total return of -20.65%.  The index then rebounded, benefitting from tighter credit spreads and lower interest rates, and finished the year with a negative total return of -15.76%.  From November 7 until year end the index posted a +4.89% total return.  In our experience many investors tend to wait on the sidelines for the perfect entry point, missing much of the low hanging fruit when the tide has turned.

When it comes to bonds, negative returns have typically made for opportunity.  We do not know what the future will bring and past returns are not indicative of future results, but a glimpse of history paints a favorable picture for IG corporates.

2022 was by far the worst year of performance since the inception of the Corporate Bond Index in 1973, eclipsing the second worst year of performance by a whopping -9.90%.  In the past 50 years there have been 11 years where the index has posted negative returns.  Only twice has the index posted consecutive years of negative returns, 1979-1980 and 2021-2022.  The index has never posted 3 consecutive years of negative total returns.  The average return the year after the index has posted a negative return is +8.17%.  This is no guarantee of positive returns in 2023 but it does illustrate the resiliency of investment grade credit as an asset class over the course of history.

Wider credit spreads and much higher Treasuries have led to some of the largest yields that have been available in IG corporates in more than a decade.  The yield to maturity on the Corporate Index finished the year at 5.42% and it traded at just over 6% in the first week of November.  The average yield to maturity on the index going back to the beginning of 2010 was 3.33%.  When the all-in yield for intermediate corporate bonds is >5% it gives the investor a much larger margin of safety, increasing the probability that IG corporate bonds will generate positive total returns in the future even if spreads and/or interest rates go higher.  To put this into context, take the 38 basis point widening in credit spreads that the index experienced in 2022.  If an investor were to purchase the index today at a YTM of 5.42% and spreads moved wider by 38 basis points over the course of the next year but interest rates did not move at all then that investor will have earned an annual total return of >5% despite the move wider in spreads.  Even if interest rates also traded higher by +50bps in addition to the +38bp move wider in spreads then our hypothetical investor would have earned a total return of >4.5%.  We believe IG corporate yields that are meaningfully higher than they have been in the recent past offer an attractive opportunity for investors and the compensation is high enough to offset short term volatility.

U.S. Recession Looms Large

Much has been written about what may be the most widely anticipated recession in history.  According to sources compiled by Bloomberg, forecasters surveyed by the Federal Reserve Bank of Philadelphia put the probability of a downturn in 2023 at more than 40% and economists polled by Bloomberg see the chances of recession in 2023 at 65%.[i]  We hate to be on the same side of what appears to be a crowded trade but we agree that a recession is more likely than not over the course of the next 18 months, either in 2023 or the first half of 2024.  Our belief stems largely from restrictive Federal Reserve policy as well as the FOMC’s commitment to tame inflation.  A dramatic move higher in the Federal Funds Target Rate of +425bps in one calendar year has begun to have its intended effect with certain sectors of the economy, such as housing, experiencing a significant contraction.ii  But the Fed is not done yet, and additional rate hikes are in the queue. We believe that the Fed will maintain tight conditions until it sees significantly diminished demand within the labor market.  In our view, the Fed cannot afford to reverse course too quickly and if anything it is likely to hold the policy rate in restrictive territory for longer than expected.  This bias toward Fed “over-tightening” underpins our recession expectations.

How can investors prepare for a recession?  We are admittedly biased as a corporate bond manager but we think an appropriate allocation to IG credit could be very useful to most investors in order to sufficiently diversify and position their overall investment portfolios for an economic slowdown.  A recession is not guaranteed and we may find instead that the economy simply grows at a low rate for some period of time.  Historically, according to data compiled by Credit Suisse, in a scenario with quarterly GDP growth of 0-1% IG credit has performed well and generated positive spread returns.iii In a scenario where the economy experiences a brief shallow recession with modestly negative growth IG spreads have historically widened, but this does not necessarily mean negative total returns.  IG credit has typically outperformed other risk assets during periods of negative economic growth.iv  By and large, investment grade rated companies took full advantage of the low interest rate environment that was available to them in recent years and as a result most IG balance sheets are flush with liquidity and maturity walls have been pushed out making a modest downturn easily navigable for the vast majority of IG-rated companies.  Credit metrics for the index have deteriorated slightly from the peak which was at the end of the first quarter of 2022, but fundamentals are still very strong.  At the end of the third quarter 2022 net leverage for the index (ex-financials) was 2.9x while EBITDA margin was 28.2% and interest coverage was 15.1x.

Where things start to get a little trickier is if there is a more prolonged deeper recession.  In a “deep recession” scenario we would expect credit spreads to trade meaningfully wider.  An OAS of 200+ on the index versus 130 at the end of the year would be probable in a deep recession scenario.  However, in such a scenario we could also see Treasury yields trade lower which would serve to offset wider credit spreads.  The most important thing for investors is the aforementioned level of yield that is available today, which is much higher than in the recent past, offering a buffer against any short term volatility incurred as the result of a recession.

Inverted Treasury Curves & Our Response

We have touched on this topic in previous commentaries and we continue to get questions from our investors so we think that it would be helpful to revisit.  An inverted curve makes bond investing more challenging but the economics still work.  There are two curves to think about as a corporate bond investor.  The underlying curve is the Treasury curve or risk free rate –this is the base rate and any IG corporate bond that an investor purchases will be at an additional spread on top of the risk free rate.  The spreads investors are paid for owning various maturities of corporate bonds form their own curve which we refer to as the corporate credit curve.  So we have two curves, and in normalized times they are both upward sloping.  The corporate credit curve is always upward sloping other than idiosyncratic cases inspired by market volatility that are quickly arbitraged away.  The Treasury curve is almost always upward sloping but it can invert, especially in economic environments like the one we are in currently.  Think of it this way –the Fed Funds Rate is extremely meaningful to where the 2yr Treasury trades but not very meaningful at all for where the 10yr trades.  This is because the 2yr is a short maturity that has to adjust for Fed Funds but the 10yr trading level is predicated on investor expectations for longer term economic growth and inflation expectations.

As an example, if a company issued new bonds on December 30 an investor would always be compensated with more yield to purchase the 10yr bond of that company relative to the 5yr bond.  This is despite the fact that at the end of 2022 the 10yr Treasury had a yield of 3.87% while the 5yr Treasury had a yield of 4.00% –the 5/10 Treasury curve was inverted by 13 basis points.  In order to make up for the Treasury curve inversion, market participants demand sufficiently more spread compensation to own the 10yr corporate bond relative to the 5yr corporate bond –the corporate credit curve would be even steeper than usual to account for the inverted Treasury curve.

Curve inversion has impacted our strategy at CAM, but only at the margins. In a typical environment we buy bonds that mature in 9-10 years and then we sell around the 5yr mark.  Curve inversion along with other technical factors at play in the market have created an environment where there are many more attractive investment opportunities for us to purchase that mature in 7-9 years but it has also required us to hold our current investments somewhat longer, until the 3-4 year mark in order to affect a more economic sale.  We are still looking at a holding period that averages approximately 5 years for new portfolios, but we are getting to that 5-year holding period with slightly shorter maturities.  At the end of the day much of this is a positive for our investors because shorter maturities carry less interest rate risk.

Curve inversions are typically quite brief in nature with the longest period of inversion on record for 2/10s being 21 months from August 1978 until April 1980.vi  The current 2/10 curve inversion began on July 5 2022 and was at its most deeply inverted point of -84 bps on December 7 2022 relative to -56 bps at year end 2022.

A New Year Brings Opportunity but Same Old Risks Remain

It is time to move on from the bond market rout of 2022 and focus on the opportunities that the drawdown has created.  We have already gone over those points and will not rehash them here; we will only remind investors that change can come quickly.  We would also like to remind investors that bonds sold off for a reason and risks remain.  The Federal Reserve has not yet completed its tightening cycle and we would caution investors from even beginning to think about easing financial conditions.  A recession in the U.S. could be imminent and in the Euro Zone it feels as though the odds of dodging a recession are infinitesimal.  Geopolitical risk remains at the forefront of investor concern as China attempts to successfully navigate its economic reopening and the war in Ukraine rages on.  These risks are balanced against an opportunity set for longer term investors that is compelling due to the risk/reward afforded by IG credit.

2022 was a difficult year for all bond investors.  We appreciate the trust you have placed in us as a manger and we look forward to doing our best to provide you with better returns in 2023.  We welcome any comments or concerns and look forward to an ongoing productive dialogue in the year ahead.

This information is intended solely to report on investment strategies identified by Cincinnati Asset Management. Opinions and estimates offered constitute our judgment and are subject to change without notice, as are statements of financial market trends, which are based on current market conditions. This material is not intended as an offer or solicitation to buy, hold or sell any financial instrument.  Fixed income securities may be sensitive to prevailing interest rates.  When rates rise the value generally declines.  Past performance is not a guarantee of future results.  Gross of advisory fee performance does not reflect the deduction of investment advisory fees.  Our advisory fees are disclosed in Form ADV Part 2A.  Accounts managed through brokerage firm programs usually will include additional fees.  Returns are calculated monthly in U.S. dollars and include reinvestment of dividends and interest. The index is unmanaged and does not take into account fees, expenses, and transaction costs.  It is shown for comparative purposes and is based on information generally available to the public from sources believed to be reliable.  No representation is made to its accuracy or completeness.  Additional disclosures on the material risks and potential benefits of investing in corporate bonds are available on our website: https://www.cambonds.com/disclosure-statements/.


The information provided in this report should not be considered a recommendation to purchase or sell any particular security.  There is no assurance that any securities discussed herein will remain in an account’s portfolio at the time you receive this report or that securities sold have not been repurchased.  The securities discussed do not represent an account’s entire portfolio and in the aggregate may represent only a small percentage of an account’s portfolio holdings.  It should not be assumed that any of the securities transactions or holdings discussed were or will prove to be profitable, or that the investment decisions we make in the future will be profitable or will equal the investment performance of the securities discussed herein.

i Bloomberg, January 3 2023 “The Most-Anticipated Downturn Ever”
ii The Wall Street Journal, December 7 2022 “What’s Going On With the Housing Market?”
iii Credit Suisse, December 7 2022 “CS Credit Strategy Daily (2023 US Cash Outlook)”
iv Credit Suisse, December 7 2022 “CS Credit Strategy Daily (2023 US Cash Outlook)”
v Barclays, December 13 2022 “US Investment Grade Credit Metrics Q3 22 Update”
vi St. Louis Fed, 2022, “10-Year Treasury Constant Maturity Minus 2-Year Treasury Constant Maturity”

09 Dec 2022

CAM Investment Grade Weekly Insights

Investment grade credit spreads were mostly flat throughout the week without much change.  The Bloomberg US Corporate Bond Index closed at 130 on Thursday December 8 after having closed the week prior at 130.  Treasury volatility moderated this week as rates did not move materially for the first time in several weeks.  The 10yr Treasury closed the week prior at 3.49% and it is trading at 3.53% as we go to print.  Through this Thursday the Corporate Index had a YTD total return of -13.6% while the YTD S&P500 Index return was -15.6% and the Nasdaq Composite Index return was -28.8%.

The most meaningful economic data of the week was released this Friday morning.  U.S. producer prices rose more than forecast during the month of November.  This could lend credence to the case for additional Fed rate hikes but it was the smallest annual increase in PPI in 18 months so the Fed will be pleased to see that things are moving in the right direction. Also on Friday morning we learned that consumer sentiment improved and consumer concerns over inflation have eased over the course of the last month.  These data points were merely appetizers as a feast of economic data awaits us next week.  Things get started with the CPI release on Tuesday morning –if inflation comes in hotter than expected then it could make for a very volatile trading session.  On Wednesday afternoon we get an FOMC rate decision followed by rate decisions by the ECB and BOE on Thursday morning.  Each of these three central banks are expected to slow the pace of their rate hikes from 75bps to 50bps and if any of them deviate from this and surprise to the upside it could make for an interesting trading session.

The primary market had a slow week as it appears that most issuers have packed it in for the year.  Just $4.25bln in new debt was priced and if this pattern holds then it could be the lowest volume for a December in more than 15 years according to data compiled by Bloomberg.  The 2022 issuance tally stands at $1,180bln which trails 2021’s pace by ~14%.

Investment grade credit reported an inflow for the week.  Per data compiled by Wells Fargo, outflows for the week of December 1–7 were +1.0bln which brings the year-to-date total to -$160.2bln.

This information is intended solely to report on investment strategies identified by Cincinnati Asset Management. Opinions and estimates offered constitute our judgment and are subject to change without notice, as are statements of financial market trends, which are based on current market conditions. This material is not intended as an offer or solicitation to buy, hold or sell any financial instrument. Fixed income securities may be sensitive to prevailing interest rates. When rates rise the value generally declines. Past performance is not a guarantee of future results. 

02 Dec 2022

CAM Investment Grade Weekly Insights

Investment grade credit spread performance was mixed throughout the week with spreads set to finish the week slightly wider.  The Bloomberg US Corporate Bond Index closed at 132 on Thursday December 2 after having closed the week prior at 130.  Treasuries continued to exhibit the same type of volatility that we have become accustomed to in recent weeks.  The 10yr Treasury closed last week at 3.68% and it is trading at 3.55% as we go to print.  The 10yr closed above 4% as recently as November 9, so this has been a significant move lower in yield over the course of only 15 trading days.  Through this Thursday the Corporate Index had a YTD total return of -14.3% while the YTD S&P500 Index return was -13.2% and the Nasdaq Composite Index return was -26.0%.

There was plenty of economic data to parse this week.  Things really started to ramp on Wednesday with a GDP print that morning that gave market participants some hope that inflation may be turning the corner and headed lower as the numbers showed slowing personal consumption and a core PCE figure that declined in 3Q relative to 2Q.  Chairman Powell gave a speech later that day at the Brookings Institution that indicated that the Fed was set to moderate the pace of rate increases at its meeting on December 14.  This sent stocks higher and Treasury yields lower.  We were surprised by this price action as a 50 basis point hike in December should not have been seen by the market as new information.  We believe that markets for risk assets are simply too eager for the Fed pivot when in fact chair Powell has been crystal clear that the Fed will not look to ease financial conditions through rate cuts until it is obvious that inflation is headed lower, closer to its longer term target.  The Friday nonfarm payroll report was stronger than expected and showed that the labor market continued to be strong in November.  Job gains and robust wage growth are not what the Fed was hoping to see and that data gives further credence to our belief that the Fed will not be in a hurry to cut its policy rate.  An elevated policy rate for a longer time period is not problematic for bond investors as it affords an opportunity to generate more income for new money and incremental purchases but it does make this exercise more difficult when the market is so quick to see any bad news as good news, sending Treasury yields lower in the process.

The primary market had a busy week as issuers priced more than $22bln in new debt.  Amazon led the way as it printed $8.25bln across 4 tranches.  The 2022 issuance tally stands at $1,176bln which trails 2021’s pace by ~13%.

Investment grade credit reported an outflow for the week.  Per data compiled by Wells Fargo, outflows for the week of November 24–30 were -$3.9bln which brings the year-to-date total to -$161.1bln.


This information is intended solely to report on investment strategies identified by Cincinnati Asset Management. Opinions and estimates offered constitute our judgment and are subject to change without notice, as are statements of financial market trends, which are based on current market conditions. This material is not intended as an offer or solicitation to buy, hold or sell any financial instrument. Fixed income securities may be sensitive to prevailing interest rates. When rates rise the value generally declines. Past performance is not a guarantee of future results. 

10 Nov 2022

CAM Investment Grade Weekly Insights

Investment grade credit spreads were unchanged on the week until the CPI print sent spreads tighter on Thursday morning.  If this “risk-on” trade has legs, then spreads will finish the week in solidly positive territory.  The credit market is closed this Friday in observance of Veteran’s Day but equities will remain open.  The Bloomberg US Corporate Bond Index closed at 152 on Wednesday November 9 after having closed the week prior at 152.  Treasury yields are sharply lower on the week with the bulk of that move occurring after CPI at 8:30am this morning.  The 10yr Treasury closed last Friday evening at 4.16% and it is trading at 3.92% as we go to print.  Through Wednesday the Corporate Index had a YTD total return of -19.5% while the YTD S&P500 Index return was -20.3% and the Nasdaq Composite Index return was -33.4%.

It was a lighter week for economic data relative to the last few weeks due in part to the fact that there were only 4 trading days.  The big news of the week was CPI on Thursday, which was weak across the board.  Recall that the last couple of CPI prints came in hotter than expectations.  This is only one data point, so it cannot be called a trend, but it is a welcome relief to bond investors to see this number move in a favorable direction for a change.  The next CPI release is on December 13 and the next FOMC decision is on December 14.  There is also an employment report on December 2 as well as other economic data that will help guide the Fed.  It will be interesting to see if the data allows the Fed to take its foot off the gas and back off from 75bps to 50bps at its December meeting.

The primary market was extremely active this week as 28 companies issued over $45bln of new debt across just three trading days.  It is worth noting that the high yield primary market has thawed as well and it posted its busiest week since June.  There are no new investment grade deals pending as we go to print on Thursday morning.  The 2022 issuance tally stands at $1,125bln in volume which trails 2021’s pace by ~12%.

This information is intended solely to report on investment strategies identified by Cincinnati Asset Management. Opinions and estimates offered constitute our judgment and are subject to change without notice, as are statements of financial market trends, which are based on current market conditions. This material is not intended as an offer or solicitation to buy, hold or sell any financial instrument. Fixed income securities may be sensitive to prevailing interest rates. When rates rise the value generally declines. Past performance is not a guarantee of future results. 

04 Nov 2022

CAM Investment Grade Weekly Insights

Investment grade credit spreads look as though they will finish the week slightly tighter.  The Bloomberg US Corporate Bond Index closed at 155 on Thursday November 3 after having closed the week prior at 158.  Treasury yields moved higher during the week.  The 10yr Treasury closed last Friday evening at 4.01% and it is trading at 4.17% as we go to print this Friday afternoon.  Through Thursday the Corporate Index had a YTD total return of -19.7% while the YTD S&P500 Index return was -20.9% and the Nasdaq Composite Index return was -33.5%.

It was an active week for central bankers and there was plenty of economic data to parse.  The FOMC raised the policy rate by 75bps for the fourth consecutive meeting, moving the benchmark to a target range of 3.75% to 4%.  This move was largely expected by markets but some investors may not have been sufficiently prepared for Powell’s comments which were perceived as hawkish in nature.  In our view this should not have come as a surprise as Fed officials have been consistently hawkish in recent weeks.  Powell did indicate that the committee may look to slow the pace of Fed Funds rate increases but that they are committed to seeing this through to the end in order to tame inflation.  We think that this level of commitment increases the probability that the economy will start to slow significantly in the months ahead.  Not to be outdone by the FOMC, the Bank of England was on the tape Thursday with a 75bps hike but its rhetoric was much more dovish than the U.S. central bank.  The BOE warned investors that market expectations for its terminal rate have overshot, and that while additional rate hikes may be required, the bank will be careful to limit the associated impact on economic growth.  The BOE expects that GDP for the UK will contract for eight consecutive quarters until mid-2024.  The final major piece of data came on Friday morning when the October jobs report showed that the U.S. labor market was still quite healthy.  Although the unemployment rate did tick higher from 3.5% to 3.7%, it is clear that the labor market was still too tight relative to FOMC expectations.  Futures contracts are pricing in a 50-basis point hike at the Fed’s December 14 meeting, but if the data over the next month does not paint a picture of slowing inflation then 75bps could be on the table once again.

Primary market activity in corporate credit was muted during the week.  Borrowers brought just over $12bln in new debt to market relative to expectations that were looking for $15bln on the low-end.  2022 has seen over $1,080bln in new issue volume which trails 2021’s pace by ~12%.

Investment grade funds reported a modest outflow for the week.  Per data compiled by Wells Fargo, inflows for the week of October 27–November 2 were -$0.4bln which brings the year-to-date total to -$147bln.

This information is intended solely to report on investment strategies identified by Cincinnati Asset Management. Opinions and estimates offered constitute our judgment and are subject to change without notice, as are statements of financial market trends, which are based on current market conditions. This material is not intended as an offer or solicitation to buy, hold or sell any financial instrument. Fixed income securities may be sensitive to prevailing interest rates. When rates rise the value generally declines. Past performance is not a guarantee of future results. 

28 Oct 2022

CAM Investment Grade Weekly Insights

Investment grade credit spreads will likely finish the week tighter.  The Bloomberg US Corporate Bond Index closed at 161 on Thursday October 27 after having closed the week prior at 164.  Treasury yields drifted lower throughout the week.  The 10yr Treasury closed last Friday evening at 4.22% and it is trading at 3.99% as we go to print this morning.  Through Thursday the Corporate Index had a negative YTD total return of -19.1% while the YTD S&P500 Index return was -19.1% and the Nasdaq Composite Index return was -30.4%.

It was an extremely active week for economic data and rate decisions by global central banks.  We cannot cover it all in this brief note but we will do our best to hit the highlights.  Early in the week, data releases showed housing prices that slowed more than expected and a consumer confidence number that was underwhelming relative to expectations.  US 30-year mortgage rates topped 7% for the first time since 2001 and mortgage applications continued to slow.  On the bright side, new home sales were a slight beat relative to expectations and the third quarter US GDP report showed that growth rebounded into positive territory after two consecutive quarters of contraction.  On the central bank front, The Bank of Canada surprised investors with a half-percentage point increase in its policy rate from 3.25% to 3.75%.  Investors were expecting the BOC to increase by 75 basis points.  The BOC also made comments that indicate that, while it is not done with rate increases, it is getting closer to the end of its hiking cycle.  Lastly, the European Central Bank raised its policy rate by 75 basis points to 1.5%, its highest level in more than a decade.  ECB President Lagarde said further rate hikes are on the horizon but her tone was cautious given the deteriorating outlook for the Eurozone economy as the region barrels toward a recession.  Overall, the news flow continues to paint a mixed picture and there were pieces of data that both hawks and doves could cling to.

It was an active week in the primary market as 13 borrowers priced more than $34bln in new debt through Thursday.  There is one deal pending on Friday morning that will push that total further as Honeywell is looking to tap the market for up to $2bln spread across several tranches.  Next week will likely bring more muted issuance volumes with the FOMC meeting on Wednesday –market prognosticators are calling for $15-$20bln of issuance weighted toward the front end of the week.  2022 has seen over $1,066bln in new issue volume which trails 2021’s pace by about 13%.

Investment grade funds reported their first inflow in 9 weeks.  Per data compiled by Wells Fargo, inflows for the week of October 20–26 were +$1.6bln which brings the year-to-date total to -$146.6bln.

This information is intended solely to report on investment strategies identified by Cincinnati Asset Management. Opinions and estimates offered constitute our judgment and are subject to change without notice, as are statements of financial market trends, which are based on current market conditions. This material is not intended as an offer or solicitation to buy, hold or sell any financial instrument. Fixed income securities may be sensitive to prevailing interest rates. When rates rise the value generally declines. Past performance is not a guarantee of future results. 

12 Oct 2022

2022 Q3 Investment Grade Quarterly

Negative performance continued to plague the investment grade credit market during the third quarter and 2022 built on its record as the most difficult year of performance that the market has ever experienced. It was a hopeful start to the quarter, as investment grade bonds posted sharply positive returns for the month of July, but August and September were ugly, as Treasury yields climbed higher, creating a major headwind for performance. Credit spreads finished the quarter modestly wider but behaved reasonably well for most of the period and the spread performance of IG‐credit was relatively strong compared to other risk assets, but the magnitude of the sell‐off in Treasuries during the quarter and during the first 9 months of 2022 has led to historically poor performance across fixed income. The option adjusted spread (OAS) on the Bloomberg US Corporate Bond Index widened by 4 basis points during the quarter to 159 after having opened the quarter at an OAS of 155. The 10yr Treasury opened the quarter at 3.01% and finished 82 basis points higher, at 3.83%. The 5yr Treasury opened the quarter at 3.04% and finished 105 basis points higher, at 4.09%. The 2yr Treasury opened the quarter at 2.95% and finished 133 basis points higher, at 4.28%. The very front end of the yield curve has experienced the most dramatic movement year‐to‐date and the 2yr has now climbed 355 basis points during 2022 through the end of the third quarter.

The Corporate Index posted a third quarter total return of –5.06%. CAM’s Investment Grade portfolio net of fees total return for the third quarter was –4.12%.

The drawdown in credit has continued.  We cannot predict when the tide will turn but we are confident that it will do so eventually, and it is only a matter of time.  An increasing amount of hawkishness has been priced into the Treasury markets as the year has worn on.  Eventually, the economic data on inflation will break, whether it is this year, in 2023, or even beyond that.  The valuations and compensation afforded from high quality investment grade credit are as high as they have been in a very long time.  The process of getting to these yields has been painful to endure but the market is now trading at levels that set up well for investors with longer time horizons.  The market could cheapen further but higher Treasury rates and wider credit spreads have given investors a larger margin of safety and increased the likelihood of positive returns in the future.

Cash Alternatives Are Back, Finally

 We are a bond manager and are not in the business of giving investment advice, but this is a topic that has started to come up frequently in our conversations so we thought it would be helpful to discuss.  The rise in short term Treasury rates has given investors the option to generate higher levels of income without taking much duration risk for the first time in a long time.  For example, the 2-year Treasury has not offered yields this high since 2007.  This is a great cash alternative for many investors in our opinion.  Some may prefer to park their short term funds while for others it may make sense to allocate a larger portion of their portfolio.

We have received questions asking why we have not changed our intermediate investment grade strategy, putting all of our investments into short duration assets or even short term Treasuries.  What investors need to understand is that a portfolio that is entirely reliant on short duration securities introduces a risk for those that have medium or longer term time horizons: reinvestment risk.  When the time comes to sell or, for example, when the 2-year Treasury matures, the landscape could look totally different.  Credit spreads could have raced tighter or intermediate Treasury yields could have decreased – or both of these things could have occurred, meaning the investor missed out on larger returns and now they find themselves in a position where they need to redeploy capital into a market with richer valuations.  So we would caution investors from making wholesale tactical changes to their fixed income portfolios.  A Strategic approach may yield better results, because like all risk assets, fixed income benefits an overall portfolio by being diverse in its exposure.  Having different maturities, credit exposures and asset classes within fixed income is in our opinion the best way to build a portfolio with a longer term view.   We do offer a variety of short duration strategies at CAM, but for most investors with longer time horizons a combination of short and intermediate duration strategies will typically be the best fit.

What Now for Low Dollar Bonds?

We have officially exited the longstanding regime of ultralow interest rates.  As rates have rapidly increased, some of our holdings have incurred significant price declines.  This is particularly the case with bonds that we purchased in 2020-2021 that were newly issued at the time.  This was a time period when interest rates were much lower and credit spreads were tighter than they are today. As a result, many of these bonds have coupons that are lower than Treasuries are today, thus they have seen significant price declines, with dollar prices in the high 70s or low 80s (price declines of more than 15-20% since issuance).  In almost all of these cases, our ongoing analysis has shown that the company that issued the bonds is operating well from the standpoint of creditworthiness.  In other words, the price declines have not stemmed from concerns over credit risk but rather the declines have been all about duration and higher interest rates.  We have received questions from investors about our expectation for price recoveries in these bonds.

Ultimately, the prices of these bonds stand to benefit the most from the passage of time and a reversal of the currently inverted yield curve.  There are two curves that we deal with as a bond manager: the corporate credit curve and the Treasury curve.  The corporate credit curve represents the extra spread that an investor receives for purchasing a corporate bond instead of a Treasury –it is the spread on top of the underlying Treasury.  The corporate credit curve remains steep at the moment, as it almost always is.  For A-rated credit at the end of the third quarter it was not uncommon for us to observe a 5/10 curve of 50 basis points for many A-rated credits.  That is, you could sell a 5yr bond of a company at a spread of 50 basis points over the 5yr Treasury and then use those proceeds to buy the 10 year bond of the same company at a spread of 100 basis points over the 10yr Treasury. The corporate credit curve is even steeper for BAA-rated credits because riskier credits require steeper curves as investors demand more compensation to own the bonds of a lower quality credit. The problem with doing an extension trade at the moment is that at the end of the quarter the 5/10 Treasury curve was inverted to the tune of -26 basis points, which takes a big bite out of the compensation afforded by an extension trade because we are selling off of a higher 5-year Treasury (4.09%) and purchasing a bond that trades off a lower 10-year Treasury (3.83%). We would still be increasing yield by doing this trade, because of the steepness of the corporate credit curve, it is just much less of a yield increase than we would get in a typical environment where we have an upward sloping Treasury curve and an upward sloping credit curve. Thus, in order for these deeply discounted bonds to recover value it requires Treasury yield curve normalization. Historically, yield curve inversions have been brief in nature. The longest period of inversion was 21 months, beginning August 1978 until April 1980 . We don’t know when the yield curve will normalize but we expect that it will over time.

The best prospect for value recovery in a deeply discounted bond that still has good credit metrics is to trust the bond math and to embrace the passage of time as our friend. With each passing day, a bond gets shorter and closer to its maturity and the credit spread gets tighter, all else being equal. The passage of time will also allow the Treasury curve to normalize and give investors a chance to recover principal and to execute more favorable extension trades where both the value of selling and buying are maximized. Finally, as the bond is held, the investor receives coupon payments which serve to help offset the decline in price.

How Are We Responding?

We will always stay true to our mandate as a manager of intermediate maturities, but we will also adapt to market conditions and we have responded to 2022’s market volatility in a number of ways.  The single biggest dislocation we have observed in our portion of the market is that bonds that mature in 7.5-8.5 years have consistently offered exceptional value relative to other portions of the yield curve.  We are still buying 9-10 year maturities when it makes sense to do so but we have been able to consistently find value in shorter maturities which has allowed us to take less duration risk while increasing yield.   For example, it has become commonplace for the ~8yr bond of a company to trade at a wider spread than the ~10yr bond of the same company, which is something that should not happen with a high degree of frequency.  This type of dislocation is something that has always occasionally occurred in the market but it is typically idiosyncratic in nature and quickly arbitraged away by market participants.  What we are observing in 2022 is that this has become widespread which has presented an opportunity for an investor like us because when we buy an 8-year maturity we have a 3 to 4 year time horizon before we are looking to sell.  10-year bonds are trading rich to 8-year bonds usually because of some type of market technical.  We believe that it is most likely occurring because the 10-year bond is being bid-up by short term investors that are primarily concerned with short term liquidity.  These investors believe that the 10-year bond is more liquid and could be easier to sell a week or a month from now if needed.  We are longer term investors and we are not concerned about liquidity a week or a month from now, we care more about liquidity 3 or 4 years from now.  When our 8-year bond rolls down the yield curve and becomes a 5-year bond we are highly confident that we will have plenty of liquidity when the time comes to sell our bonds.  Thus we will happily take advantage of this dislocation for our client accounts.

Not only have we been able to buy shorter maturities, but we have also become more patient when evaluating the sale of existing holdings.  Much of this patience is borne out of necessity as a result of the currently inverted yield curve but some of it is also related to fund flows and technical factors at play in the market.  Traditionally, we would look to exit most securities right around the time that they have 5 years left to maturity.  For extremely high quality A-rated paper you could see us sell with 5.5 years left to maturity while some lower quality BAA-rated paper may need to roll down to 4-4.5 years in order to maximize value.  What we are seeing in the current environment is that there is simply too much “juice” left in many of our 5 year holdings so we are continuing to hold them beyond the typical 5-year time period.  We are willing to wait; allowing that bond to roll down to 3 or 4 years to maturity–it is entirely about being opportunistic and maximizing value for our investors.  As the Treasury yield curve normalizes, we would expect that the market will revert to an environment where it makes more sense to sell nearer the 5-year mark.

We have also been able to take even less credit risk than we typically would.  To be clear, we already position our investment grade strategy as “up-in-quality” relative to its benchmark and that high quality bias comes from the fact that we cap our BAA-rated exposure at 30% while the Corporate Index was 48.93% BAA-rated at the end of the 3rd quarter.  Even though we have a meaningful underweight in BAA-rated credit, we maintain a focus of adding value for our investors through credit research and identification of those BAA-rated credits that are mispriced or that are poised to improve their credit metrics.  Traditionally, we have not necessarily shied away from risk taking in lower quality credit so long as it was for the right reasons and that the compensation was appropriate for the risk incurred.  We always intend to stick to our cap of a 30% weighting for this portion of the market but we have always been willing to take credit risk based on thorough research.  What we are finding in the current environment, however, is that we simply do not need to take much risk in order to find compelling value.  There are plenty of very solid BAA-rated credits that offer spreads that are quite attractive in our view.  We are positioning the portfolio for a recessionary period and shying away from those credits that are most exposed and we are in a position where we are able to dial-back risk without giving up yield.

Fed Fait Accompli

The Federal Reserve has been active in 2022, to say the least. Six rate hikes in six months is unprecedented, and the market has never experienced so many hikes in such a short period of time. The Fed has been clear in its communication in recent weeks. It is fully committed and will not stop until inflation shows signs of slowing. Our only prediction about where the Fed goes from here is that we continue to expect tightening through further increases in Fed Funds until the data on inflation and labor shows signs of cooling. This data is entirely backward looking in nature. This could be problematic for the economy because rate hikes take time to work their way through the economy. With the Fed focused on backward looking data, it introduces a risk that financial conditions will tighten too much and the potential for overtightening diminishes the probability of a soft landing. At the very least, it appears likely that the economy will slow throughout 2023. Growth may even turn negative, thrusting the economy into recession. If there is any good news that investors can take from the Fed’s quick action to this point is that we are likely closer to the end of tightening conditions than we were just a short six months ago.

Slipping Into Darkness

The economy is still reasonably strong by many measures but cracks are starting to form in the foundation, and housing could be leading the way. Housing is an important sector for the economy and it makes up 15-18% of GDP on average. Recently released data showed that during July housing prices experienced their first monthly decline since January 2019. It should come as no surprise that housing has shown signs of slowing as mortgage rates have climbed throughout 2022 and this his had a severe impact on home affordability. According to the US NAR Homebuyer Affordabilty Index, the monthly payment on a median priced single family home ($410,600) went from $1,011 in January of 2021 to $1,933 at the end of June 2022. Mortage rates were up another 1% from June through September so this payment will be even higher when the August and September data is released, with the montly payment on a median home having more than doubled in less than two years. Builders have started to report increasing cancellations and inventory has risen . It is only a matter of time until this data starts to filter through to lower home prices and ultimately to lower GDP.

We have also begun to see earnings revisions in other cyclically sensitive portions of the economy with companies in the chemical and semiconductor industries pointing to slowing demand, especially out of Europe. Retailers like Nike have reported bloated inventories and aggressive promotions. Large stalwart companies like Walmart and Amazon are slowing or altogether pausing hiring. It is too early to tell for sure but the negative data points are piling up, and we do not view these as the signs of a soft landing. We do not necessarily believe a severe recession is the base case but it is becoming more likely that the economy will slip into a recession at some point in 2023 or 2024.

What’s Ahead for Credit?

The good news is that the vast majority of the investment grade universe has balance sheets that will hold up reasonably well in a scenario where the economy experiences a modest recession. Investment grade companies were busy in 2020 and 2021, issuing debt at record low interest rates, decreasing their interest expense burdens and pushing out maturity walls. Most companies do not need to issue new debt to fund capital budgeting projects or to refinance existing debt balances. Cash balances have declined from their 2021 peak but remain elevated by historical standards. Interest coverage ratios are near a 13-year high. We are seeing some deterioration: revenue and earnings are slowing and for some companies profit margins are deteriorating, but these are coming off of very high levels.  Many investment grade companies have multiple levers to pull in the face of a slowing economy and they have shown a willingness to make conservative choices with regard to capital budgeting and share buybacks.  Credit fundamentals remain strong and point to our aforementioned narrative that the selloff in credit during 2022 has been much more about interest rates than it has been about creditworthiness.

As far as spreads are concerned, the OAS on the index recently hit a year-to-date wide of 164 on September 29. If there is a modest recession then spreads could trade out to 200 and they could temporarily trade even wider in a severe recession or in the event that we get an exogenous shock to the markets but investors are being reasonably well compensated from a yield perspective. The yield on the Corporate Bond Index finished the quarter at 5.69%, which provides some cushion against the potential for wider spreads.

Keep on Trucking

The volatility in the market has presented a real opportunity for investors. Yields have risen and investors do not need to be nearly as creative in their quest to generate income. Investment grade credit is a straightforward, easily understood, asset class. Due diligence and credit research are required to identify the companies that have the best creditworthiness and from there a manager can determine opportunities in the market based on their own measure of risk and reward. We are no longer in an environment of ultralow interest rates and tight credit spreads where investors may feel compelled to consider increasingly complex asset classes or products in order to generate income. Investment grade companies, by and large, will not have difficulty navigating a recessionary environment. Spreads could go wider and Treasury yields could even retest the high end of their range but the market has cheapened so much in such a short period of time that it is hard to ignore the level of compensation that is offered by the asset class. We think that investors that stay the course will be rewarded over a longer time horizon.

We thank you for your business and your continued interest. We look forward to hearing from you to discuss the credit markets and to help with any questions you may have.

This information is intended solely to report on investment strategies identified by Cincinnati Asset Management. Opinions and estimates offered constitute our judgment and are subject to change without notice, as are statements of financial market trends, which are based on current market conditions. This material is not intended as an offer or solicitation to buy, hold or sell any financial instrument. Fixed income securities may be sensitive to prevailing interest rates. When rates rise the value generally declines. Past performance is not a guarantee of future results. Gross of advisory fee performance does not reflect the deduction of investment advisory fees. Our advisory fees are disclosed in Form ADV Part 2A. Accounts managed through brokerage firm programs usually will include additional fees. Returns are calculated monthly in U.S. dollars and include reinvestment of dividends and interest. The index is unmanaged and does not take into account fees, expenses, and transaction costs. It is shown for comparative purposes and is based on information generally available to the public from sources believed to be reliable. No representation is made to its accuracy or completeness.

The information provided in this report should not be considered a recommendation to purchase or sell any particular security. There is no assurance that any securities discussed herein will remain in an account’s portfolio at the time you receive this report or that securities sold have not been repurchased. The securities discussed do not represent an account’s entire portfolio and in the aggregate may represent only a small percentage of an account’s portfolio holdings. It should not be assumed that any of the securities transactions or holdings discussed were or will prove to be profitable, or that the investment decisions we make in the future will be profitable or will equal the investment performance of the securities discussed herein.

i St. Louis Fed, 2022, “10‐Year Treasury Constant Maturity Minus 2‐Year Treasury Constant Maturity”
ii National Association of Homebuilders, 2022, “Housing’s Contribution to Gross Domestic Product” https://www.nahb.org/newsand‐
economics/housing‐economics/housings‐economic‐impact/housings‐contribution‐to‐gross‐domestic‐product
iii The Wall Street Journal, September 27 2022, “Home Pries Suffer First Monthly Decline in Years”
iv Bloomberg, August 9 2022, “Builders Are Stuck With Too Many Houses as US Buyers Pull Back”
v The Wall Street Journal, September 29 2022, “Micron Issues Another Muted Outlook After Missing Expected Sales Results”
vi Barron’s, September 16 2022, “Huntsman Falls Sharply After Cutting Profit Forecast”
vii Charged Retail Tech News, October 4 2022, “Nike is Aggressively Offloading Inventory Before the Holiday Season”
viii The Wall Street Journal, September 22 2022, “Walmart to Slow Holiday Hiring”
ix The New York Times, October 4 2022, “Amazon Freezes Corporate Hiring in Its Retail Business”
x J.P. Morgan North America Corporate Research , September 8, 2022, “HG Credit Fundamentals: 2Q 2022 Review”