Click here to read the Spanish version / Haga clic aquí para leer la versión en español
The first quarter of the year saw enthusiastic investor demand for investment grade corporate bonds and tighter credit spreads. Spread performance was offset by Treasury yields that drifted higher throughout the quarter as economic data and Federal Reserve messaging made it increasingly clear that the Fed would be more deliberate with rate-cuts than what the market had anticipated at the beginning of 2024. Taking it all together, it was a modestly negative quarter of total returns for IG credit but this is an asset class that best lends itself to a longer term view. We believe that the current environment presents an opportunity. Elevated Treasury yields and strong credit metrics across the IG universe have the potential to generate attractive risk-adjusted returns for IG credit investors over a longer time horizon.

First Quarter Review
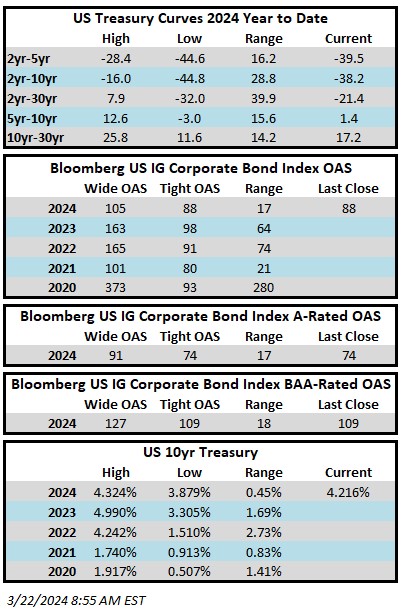
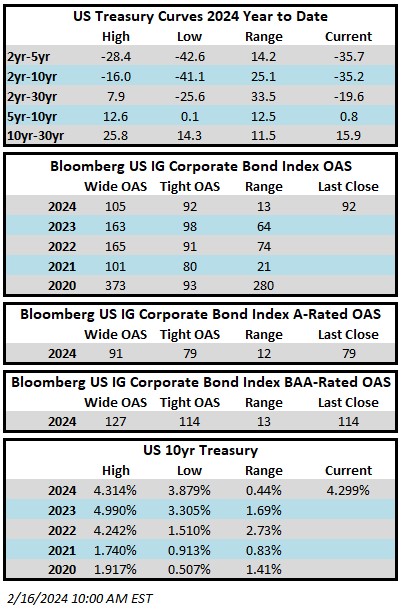
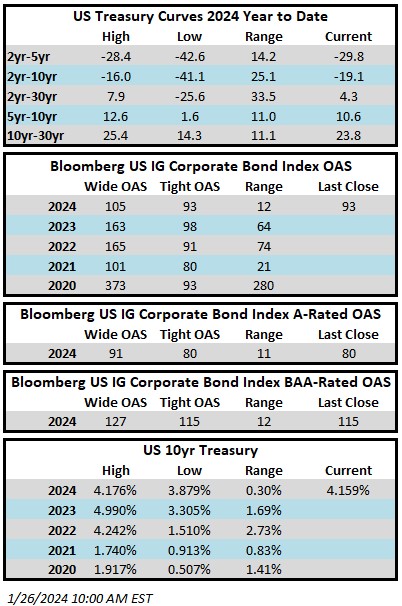
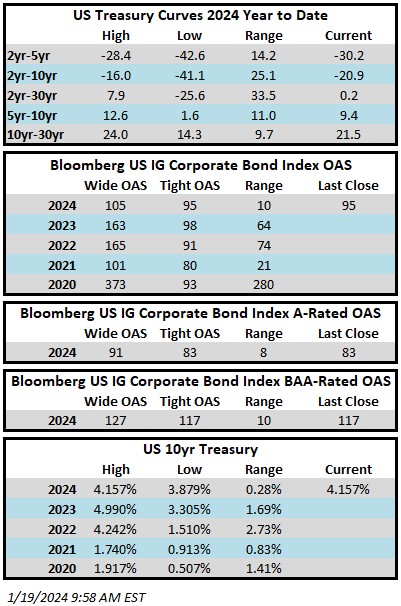
The option adjusted spread (OAS) on the Bloomberg US Corporate Bond Index opened the year at 99 and it briefly traded wider during the first 7 trading days of the year before the mood improved to the point that it would never again trade cheap to its opening level for the duration of the first quarter. The index traded as tight as 88 near the end of March, its narrowest level since November 2021, before finishing the quarter at an OAS of 90. Perhaps the most surprising aspect of this movement toward tighter spreads is that it occurred amid a record breaking deluge of new issue supply as borrowers printed $529 billion in new IG-rated corporate debt during the quarter.i
Sometimes a large amount of new issuance within a small window of time can have the effect of pushing credit spreads wider as investors sell existing holdings to make room for new issue allocations. For example, in 2020 and 2022, when 1Q new issue supply exceeded $450mm, it was accompanied by a meaningful move wider in credit spreads. However, that was not the case in 2024 as investor demand was robust and IG fund flows were solidly positive which was supportive of both tighter spreads and a robust market for new issuance.

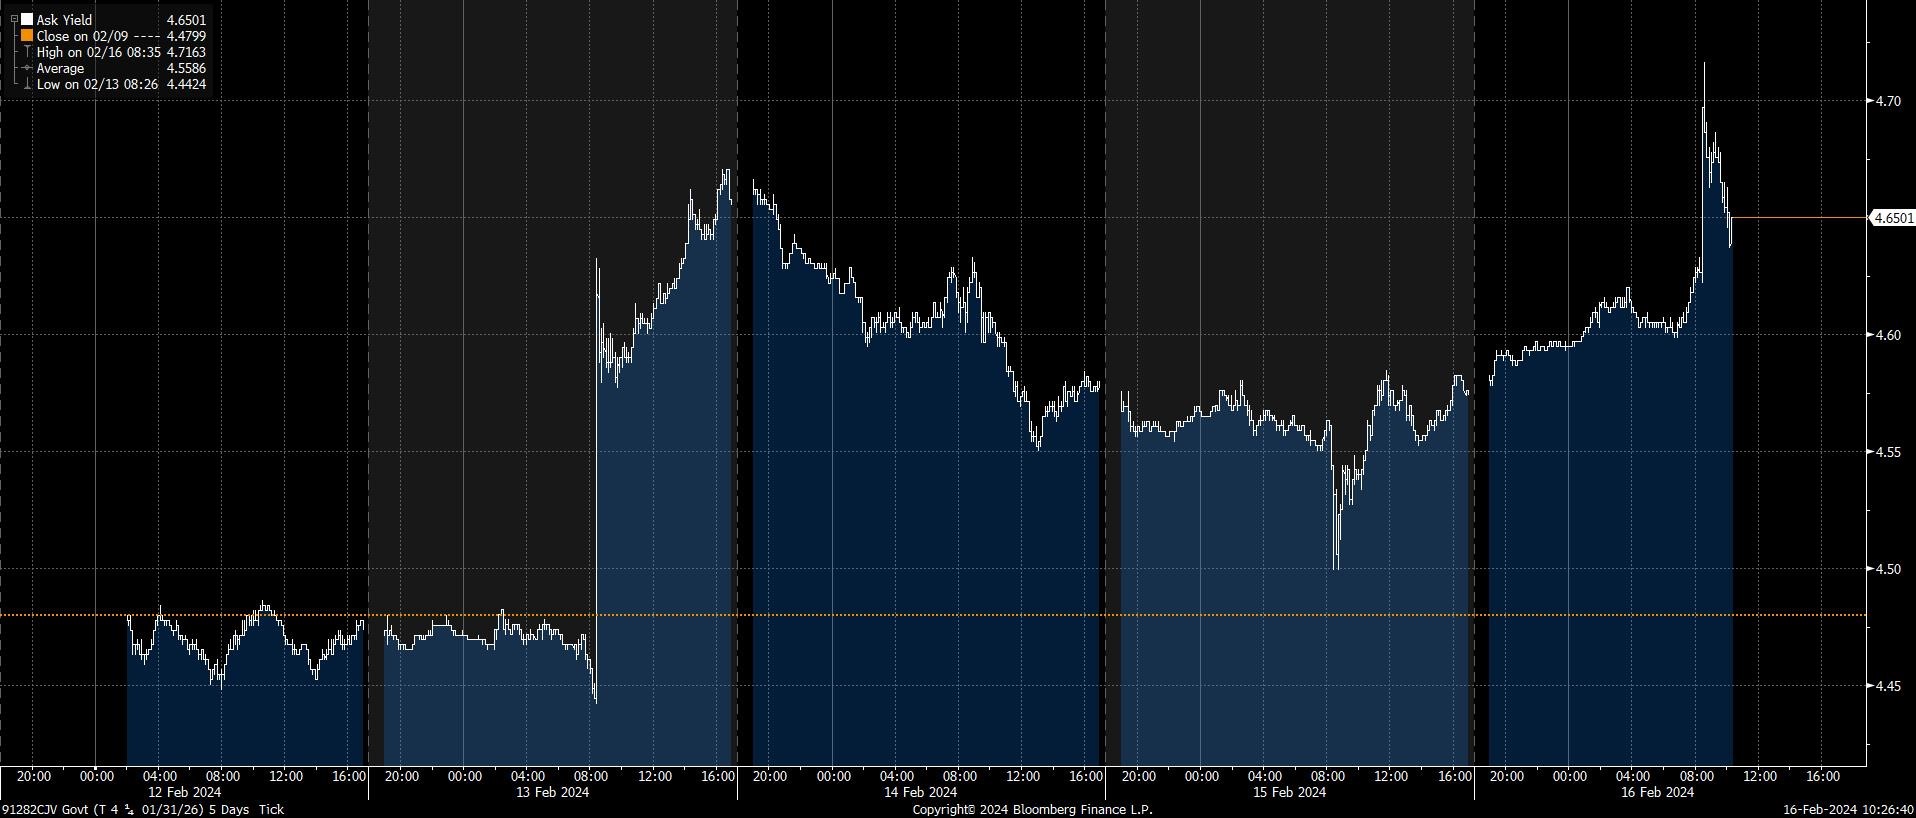
Moving on to Treasury yields, they were higher across the board in the first period of the year which sapped some momentum from total returns.

Although we don’t like to see rates move higher because of the short term headwinds it creates for performance, we think that higher yields present an opportunity for investors to be compensated for taking intermediate duration risk. Yields remain elevated relative to the recent past –the yield to maturity (YTM) for the Corporate Index closed the first quarter at 5.30% which was 180 basis points higher than its average YTM of 3.50% over the past 10 years.

The Market Fought, but the Fed Always Wins
In our January commentary we wrote that we believed that the bar was high for near term rate cuts and our view remains the same. At the beginning of the year Fed Funds Futures were implying seven 25bp rate cuts in 2024 for a total of 1.75%. Investors speculated that the first cut would occur at the March meeting with an additional cut at every meeting thereafter (the FOMC holds 8 regularly scheduled meetings per year).ii This is what interest rate futures were pricing in early January despite the fact that in December the Fed released its “Summary of Economic Projections” (SEP) which included the dot plot showing just 0.75% worth of rate cuts in 2024. To be fair, the Fed bears some responsibility for the market exuberance in January thanks to its dovish messaging on the heels of the December FOMC meeting.
As the first quarter wore on, the market slowly came around to the idea that the Fed may tread lightly, decreasing its policy rate more cautiously than expected. As it does every three months, the Fed issued an updated SEP at its March 2024 meeting which was slightly more hawkish than the December release but it still showed 0.75% worth of rate cuts in 2024. At the end of the first quarter, Fed Funds Futures mirrored the most recent March dot plot implying a 56.9% chance of a cut at the June meeting with 2 additional cuts to follow at the September and December meetings.iii This is a much more realistic view of what is likely to occur in our opinion. Without some kind of exogenous shock, or in the absence of data that shows that the economy is significantly slowing, we expect that the Fed will be patient as it looks to ease restrictive policy. Although it is not our base case, we think that there is a reasonable chance that the Fed may not cut at all in 2024. We think that the most likely outcome is that the Fed will deliver one or two 25bp cuts in the second half of the year. The Fed faces a difficult conundrum –it cannot move too quickly in the face of a resilient U.S. economy that is still creating jobs; but the longer it keeps rates at elevated levels, the greater the probability that it tumbles the economy into some type of recession. We have a high degree of conviction that the Fed would very much like to decrease the policy rate as soon as it possibly can but we lack confidence that the data will allow them to do so. Therefore, we believe that a modest recession before the end of 2025 is more likely than not due to an extended version of “higher for longer” monetary policy.
Value of Active Management
We believe that a Fed that is biased toward decreasing its policy rate is a positive for our strategy. We are an intermediate manager with the bulk of our portfolio positioned in bonds that mature in 5 to 10 years. Our base case is the following scenario: The Federal Funds rate decreases over time while Treasuries that range in maturity from 2 to 5 years decrease in concert. At the same time intermediate Treasuries that mature in 5 to 10 years move back toward a normalized upward sloping level. This scenario would allow the yield curve to regain some of its classical steepness and CAM’s portfolio would benefit from the “roll-down” effect as bonds move down the yield curve, inching closer to maturity with each passing day.

The above chart goes back 20 years from the end of the first quarter of 2024. As you can see, the 5/10 Treasury curve is almost always positive and it has averaged 56.6bps of steepness over that time period relative to its closing level of -1bp at the end of March. If a 10-year bond is purchased with the intention of holding it for 5 years before selling, and the 5/10 Treasury curve averages 50bps over that period, the bond will yield 10bps of compensation annually in the form of roll-down. Curves are not static and in our opinion are best understood in terms of averages.
When discussing IG credit it is important to remember that there are two curves an investor should care about. There is the aforementioned Treasury curve and then there is the corporate credit curve that trades on top of Treasuries. This is the extra compensation that an investor receives for taking the additional credit risk of owning a corporate bond over a Treasury bond. Like Treasury curves, corporate credit curves are ever evolving and changing all of the time, thus they can present opportunity for the active investor. Unlike the Treasury curve, which can invert, the corporate credit curve is almost never inverted, though it can be inverted for specific bond issuers in spots from time to time due to credit conditions or technical factors. Active managers will eventually take advantage of these inversions until they no longer exist.
At the end of the first quarter the typical corporate credit curve for the A-rated companies that we are looking at for our portfolios ranged from 20 to 30 basis points with outliers on either side of that.iv So if we pick a midpoint of 25bps then that means a 5-year bond of an issuer that trades at a spread of 50/5yr could expect to see the 10-year bond for that same issuer trade at a spread of 75/10yr. If a 10-year bond were purchased with the expectation of selling it at the 5-year mark, it would yield 5bps of roll-down credit spread compression for each year it is held. This is just the compensation afforded by the corporate credit curve. In normalized environments with an upward sloping Treasury curve, roll-down from the 5/10 TSY curve would provide additional benefits on top of compensation received from the credit curve. This one-two punch can amplify total returns, benefiting investors during periods of curve steepness.
As an active manager we are always looking for ways to maximize client positioning along the credit and Treasury curves. Sometimes this means we will favor shorter maturities within that 5-10yr band and other times we will be on the longer end of that range. In some environments, like the one we are in currently, the economics will dictate that we hold existing bonds longer, until they have 3 or 4 years left to maturity in order to maximize the effectiveness of a sale-extension trade. Although we sell 98%+ of our holdings prior to maturity, occasionally the bond math will indicate that we are better off holding a bond to maturity than we would be if we sold it and bought something else. As an active manager we are focused on the bond market all day every day constantly evaluating opportunities and looking to maximize the value of each individual client holding.
Creditworthiness: Strong to Quite Strong
We pride ourselves on our bottom up research process and believe it is one of the most important attributes that we bring to the table as a manager. We cannot control the direction of interest rates but we can exhibit a great deal of control over the credit worthiness of the bonds of the companies that we include in client portfolios. Investment grade companies are rated IG for a reason –yes, IG-rated companies do sometimes default on their debt obligations, but it is usually a multi-year process of credit degradation and a prudent manager will sell before the worst case of a default comes to fruition. In other words, when looking at investment grade credit, there are not many bad bonds, but there are a lot of bad prices. There are many bonds in the IG universe that are simply priced too rich and that do not offer adequate compensation per unit of risk. We always seek to populate client portfolios with bonds that are appropriately valued in an effort to reduce volatility and limit the prospect of spread widening during difficult market periods.
Although we are focused on individual credit analysis, looking at credit metrics for the IG-universe as a whole is instructive when we are trying to illustrate the current health of the overall market and it also helps us judge the relative value of investment opportunities. At the end of the 4th quarter of 2023, credit metrics across IG were strong.* EBITDA margins in particular continued to look impressive relative to history and are near all-time highs while EBITDA growth turned back to positive after a quarter of declines.

Net debt leverage for the non-financial IG index has been stable for 5 consecutive quarters and has improved since the first half of 2022. The only major credit metric that has declined in recent quarters is interest coverage and that is largely because companies have been issuing new debt with higher coupons than the debt that has been maturing.v In the first quarter of 2024, the average coupon of IG new issues was 5.33% which was 202bp higher than the average coupon of maturing bonds which was 3.31%.vi For context, compare that to 7.24% which was the average 30yr fixed mortgage rate for a residential buyer at the end of the first quarter: the cost of capital for IG-rated companies looks very reasonable.vii Simply put, investors do not need to take a lot of credit risk or interest rate risk to generate healthy returns in IG-rated credit –aggregate credit metrics are at healthy levels and the index yield is >5%.
Looking Ahead
The last several years have been a historic time in the credit markets. From March 2020 until March 2022 we experienced arguably the easiest Fed policy in history with 0% Fed Funds accompanied with unprecedented economic stimulus. Then the Fed increased its policy rate 11 times in 18 months to its current range of 5.25%-5.5% –the fastest pace of tightening in over 40 years.viii We are at the precipice of history once again as the Fed is tasked with finishing the war against inflation while restoring its policy rate to a more normative level. It is an environment of uncertainty –where will the economy go from here? We will continue to focus on our bread and butter and that is populating client portfolios with the bonds of companies that are well poised to navigate a variety of economic environments. We thank you for your interest and continued partnership as we navigate the balance of 2024.
This information is intended solely to report on investment strategies identified by Cincinnati Asset Management. Opinions and estimates offered constitute our judgment and are subject to change without notice, as are statements of financial market trends, which are based on current market conditions. This material is not intended as an offer or solicitation to buy, hold or sell any financial instrument. Fixed income securities may be sensitive to prevailing interest rates. When rates rise the value generally declines. Past performance is not a guarantee of future results. Gross of advisory fee performance does not reflect the deduction of investment advisory fees. Our advisory fees are disclosed in Form ADV Part 2A. Accounts managed through brokerage firm programs usually will include additional fees. Returns are calculated monthly in U.S. dollars and include reinvestment of dividends and interest. The index is unmanaged and does not take into account fees, expenses, and transaction costs. It is shown for comparative purposes and is based on information generally available to the public from sources believed to be reliable. No representation is made to its accuracy or completeness.
The information provided in this report should not be considered a recommendation to purchase or sell any particular security. There is no assurance that any securities discussed herein will remain in an account’s portfolio at the time you receive this report or that securities sold have not been repurchased. The securities discussed do not represent an account’s entire portfolio and in the aggregate may represent only a small percentage of an account’s portfolio holdings. It should not be assumed that any of the securities transactions or holdings discussed were or will prove to be profitable, or that the investment decisions we make in the future will be profitable or will equal the investment performance of the securities discussed herein. As part of educating clients about CAM’s strategy we may include references to historical rates and spreads. Hypothetical examples referencing the level of, or changes to, rates and spreads are for illustrative and educational purposes only. They are not intended to represent the performance of any particular portfolio or security, nor do they include the impact of fees and expenses. They also do not take into consideration all market and economic conditions that influence our decision-making. Therefore, client accounts may or may not experience scenarios similar to those referenced herein.
Additional disclosures on the material risks and potential benefits of investing in corporate bonds are available on our website: https://www.cambonds.com/disclosure-statements/
i Bloomberg, March 28 2024 “High-Grade Bond Sales on Easter Pause After Record First Quarter”
ii Bloomberg WIRP, December 29 2023 “Fed Funds Futures”
iii Bloomberg WIRP, March 29 2024 “Fed Funds Futures”
iv Raymond James & Associates, March 28 2024 “Fixed Income Spreads”
v Barclays Bank PLC, March 13 2024 “US Investment Grade Credit Metrics, Q24 Update: No Concerns”
vi J.P. Morgan, April 3 2024 “US High Grade Corporate Bond Issuance Review”
vii Bloomberg ILM3NAVG Index, March 28 2024 “Bankrate.com US Home Mortgage 30 Year Fixed National Avg”
viii CNBC, December 13 2023 “The Federal Reserve’s period of rate hikes may be over. Here’s why consumers are still reeling”