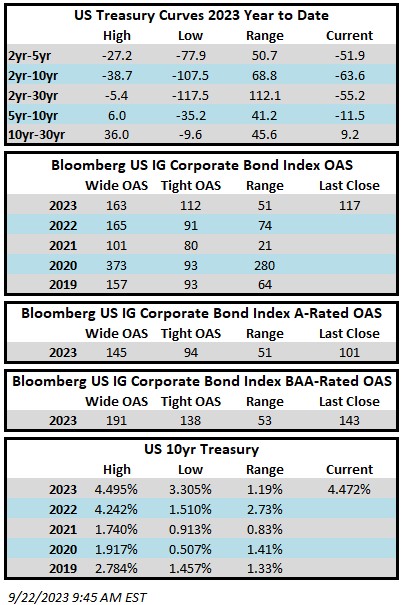
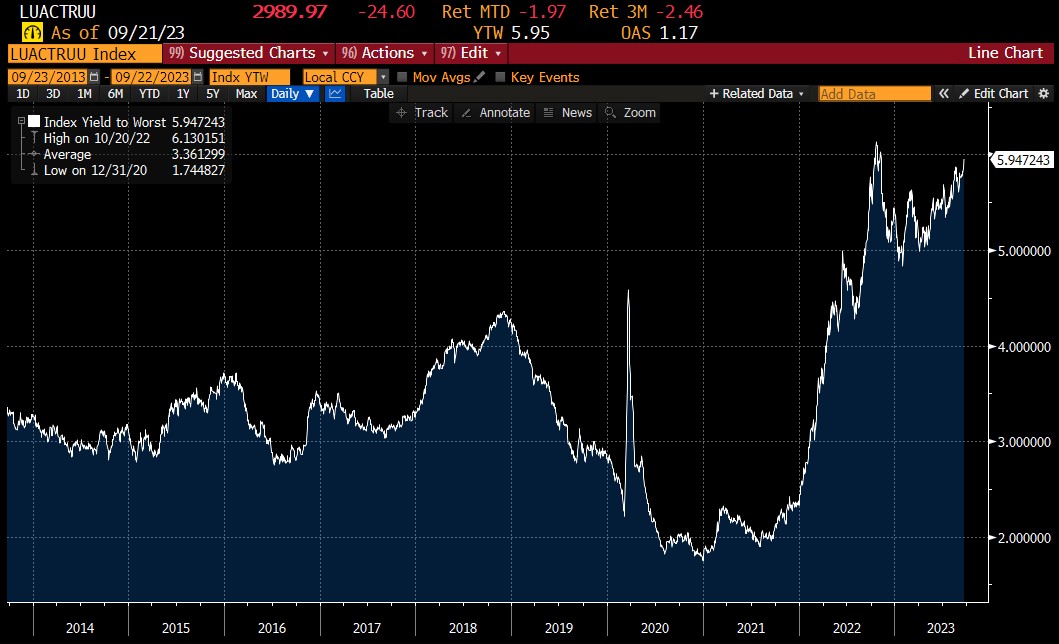
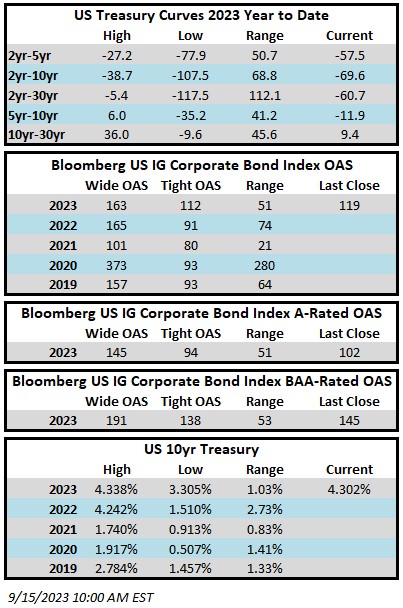
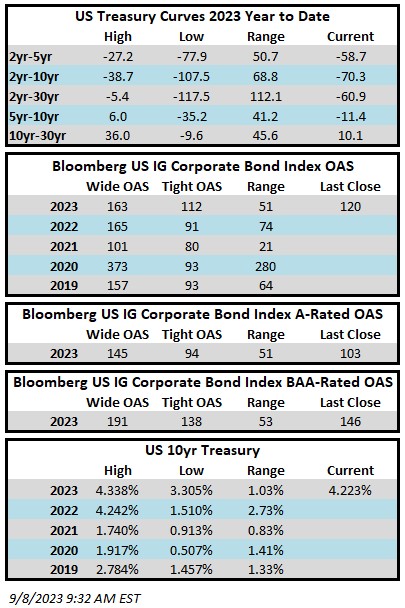
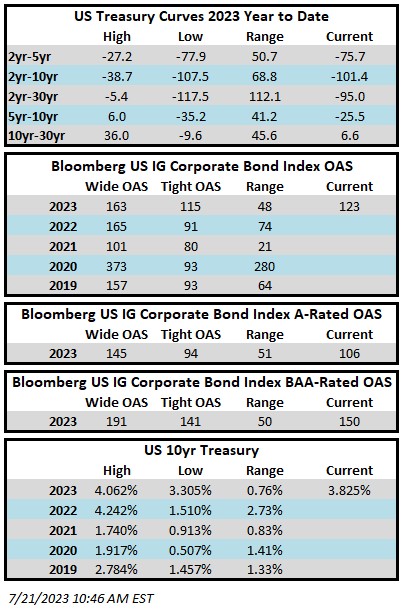
Click here to read the Spanish version / Haga clic aquí para leer la versión en español. Investment grade credit spreads were tighter during the third quarter, but Treasury yields moved higher, which acted as a meaningful headwind for returns. During the quarter, the Option Adjusted Spread (OAS) on the Bloomberg US Corporate Bond Index tightened by 2 basis points to 121 after opening the period at 123. Intermediate Treasury curves steepened during the period, with relatively little change in the 2yr Treasury, while the 5yr and 10yr Treasury yields moved significantly higher. Higher rates are bad news for short term returns, but for the long run, curve steepening is something that we like to see as it creates a friendlier environment for bond investors. Positive sloping curves maximize the efficiency and return potential of a bond rolling down the yield curve as it approaches maturity.

The Corporate Index posted a quarterly total return of -3.09%. CAM’s Investment Grade Program net of fees total return for the quarter was -2.36%. Year-to-date total returns remained positive for both the index and CAM through quarter end.

Market Update
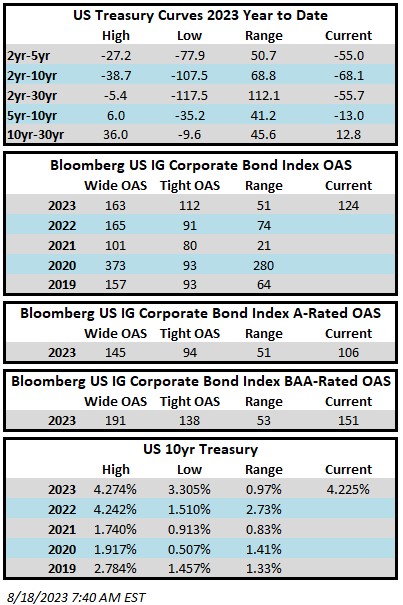
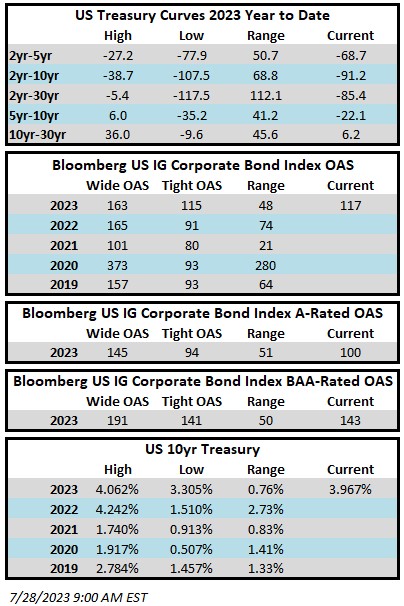
The yield to maturity (YTM) for the Bloomberg U.S. Corporate Index ended the quarter at 6.04%. Here are some statistics to provide context:
- The 5yr average YTM was 3.48%. The index closed >6% fewer than 0.7% of trading days.
- The 10yr average YTM was 3.38%. The index closed >6% fewer than 0.4% of trading days.
- The 15yr average YTM was 3.69%. The index closed >6% fewer than 5.2% of trading days.
- The 20yr average YTM was 4.12%. The index closed >6% fewer than 7.6% of trading days.
With yields near cycle highs and company fundamentals in solid shape, we think that IG credit offers an attractive value proposition. We also believe that downside for the asset class is limited at these elevated yields. Treasury yields could go higher from here or there could be a hard landing that might send credit spreads wider, but the impact of those moves on returns is diminished when the starting point is a >6% yield, which provides meaningful cushion for bond investors.

We believe credit spreads were fairly valued at quarter end. The OAS on the index finished the quarter at 121 relative to its 5 and 10 year averages of 123 and 124, respectively. Investors are cautious about the direction of the U.S. economy which is why we believe that further spread tightening from current levels could be difficult. However, there are a couple of scenarios that could drive spreads tighter: 1.) The yield curve continues to steepen to the point that it is no longer inverted and/or 2.) Inflation continues to decline coincident with a soft landing for the U.S. economy. There is a third scenario as well, which contemplates a lack of new bond supply into year-end which could create a supply/demand mismatch: if new issuance is insufficient to satisfy investor demand, then secondary spreads could grind tighter in the absence of negative economic data. Conversely, spreads could go wider if tight monetary policy tips the economy into a recession. We believe the most likely outcome is that spreads will trade within a relatively tight range until there is more certainty among investors regarding the direction of the economy and inflation expectations. Bottom line, with elevated Treasury yields and fair compensation for credit risk, we believe investment grade credit remains attractive.

Asset Allocation – Stocks vs. Bonds
Throughout 2023, Treasuries have climbed higher, while equities have continued to chug along, posting impressive returns. This price action has brought the concept of the equity risk premium (ERP) into to the spotlight. The ERP is the extra return that an investor earns from stocks compared to bonds for taking additional risk in the equity market. To put it in mathematical terms, the ERP is the difference between the S&P 500’s earnings yield and the yield on the 10yr Treasury. The following ERP chart is expressed in terms of basis points.

Currently, the ERP is at its lowest level at any point in the past 20 years. Does this strengthen the case for investment grade bonds, which earn a spread in excess of the risk free rate? We think so, but it is worth noting that the ERP can go negative – it was deeply negative for an extended period during the dot-com bubble period of 1998 into early 2001.
Cash Remains Attractive, But Less So
The most frequent question we have continued to field from individual investors over the course of the past year goes something like this.
“Yields at 6% look great to me, but why would I allocate to intermediate corporate bonds when I can buy a 2-year Treasury at 5% or an 18 month CD at 5.25%?”
To be clear, we think that investors should absolutely be taking advantage of dislocation at the front end of the yield curve, but they should not do so at the expense of their longer term goals. These high short rates are a phenomenon of the Fed hiking cycle and the inverted curve could dissipate quickly when the Fed reverses course. An investor that over-allocates to the front end of the curve puts themselves at risk of missing out on larger returns slightly further out the curve. The goal for most investors should be to allocate their portfolio in a manner that benefits from elevated short term rates while maintaining an exposure to the intermediate part of the yield curve so that the portfolio can reap the rewards of a curve that eventually re-steepens from its current inverted state. An investor that waits for the first Fed rate cut or waits for this trade to be obvious could miss out on a lot of low hanging fruit as far as returns are concerned.
The subject of reinvestment risk remains highly topical in our conversations with investors. Please reach out to one of our client consultants if you would like to discuss this further or you can view some of our past content here.

Corporate Credit Curve – A Waiting Game
The corporate credit curve is integral to our strategy at CAM. The following graph shows the change from the beginning of the year through the end of the third quarter for both the Treasury curve and the corporate yield curve. Our focus at CAM is on intermediate maturities that range from 5 to 10 years.

Both corporate and Treasury curves have moved much higher so far in 2023. It is important to note that while the Treasury curve has remained inverted, the corporate curve has maintained its steepness. For example, even though the 5/10 Treasury curve was inverted by -4bps at quarter end, an investor could expect to earn +21bps in additional yield (on average) by extending from a 5yr corporate bond to a 10yr corporate bond. This equates to a 5/10 corporate credit curve of +25bps. For our existing investors, we are currently holding some maturities longer than we would typically – as we are patiently waiting for the corporate credit curve to steepen. A steeper curve allows us to extract more value for our investors from extension trades. As the Fed tightening cycle reaches its logical conclusion, we expect steepening in both the underlying Treasury curve and the corporate credit curve. As these curves steepen, investors that have been with us for some time will start to see us resume our extension trades. The following graph from the St. Louis Fed provides a good illustration of how much steeper the corporate credit curve has been for most of the past decade relative to where it is today.

The Fed – Are We There Yet?
The Federal Reserve delivered a +0.25% hike at its July meeting, but held rates steady at its September meeting. The Fed meets two more times this year, the first day of November and again in mid-December. The FOMC’s dot plot shows an expectation of one more +25bp hike this year and -50bps worth of cuts next year. At quarter-end, investors were assigning a 39.1% probability of an additional rate hike by year-end according to Fed Funds Futures.
The Fed message has been consistent lately, hammering home the “higher for longer” mantra. We don’t believe that it is particularly meaningful if the Fed hikes once more or even twice. Instead, we think bond investors should rejoice at the likelihood that the Fed may finally be near the end of its hiking cycle.

Keep Grinding
It was a quarter to forget for IG credit returns but the longer term value proposition remains. Even despite massive movement in Treasuries the asset class has remained in positive territory year-to-date. We will continue to manage your capital to the best of our ability, searching for superior risk adjusted returns amid an increasingly volatile landscape. Thank you for your continued interest and confidence.
This information is intended solely to report on investment strategies identified by Cincinnati Asset Management. Opinions and estimates offered constitute our judgment and are subject to change without notice, as are statements of financial market trends, which are based on current market conditions. This material is not intended as an offer or solicitation to buy, hold or sell any financial instrument. Fixed income securities may be sensitive to prevailing interest rates. When rates rise the value generally declines. Past performance is not a guarantee of future results. Gross of advisory fee performance does not reflect the deduction of investment advisory fees. Our advisory fees are disclosed in Form ADV Part 2A. Accounts managed through brokerage firm programs usually will include additional fees. Returns are calculated monthly in U.S. dollars and include reinvestment of dividends and interest. The index is unmanaged and does not take into account fees, expenses, and transaction costs. It is shown for comparative purposes and is based on information generally available to the public from sources believed to be reliable. No representation is made to its accuracy or completeness.
The information provided in this report should not be considered a recommendation to purchase or sell any particular security. There is no assurance that any securities discussed herein will remain in an account’s portfolio at the time you receive this report or that securities sold have not been repurchased. The securities discussed do not represent an account’s entire portfolio and in the aggregate may represent only a small percentage of an account’s portfolio holdings. It should not be assumed that any of the securities transactions or holdings discussed were or will prove to be profitable, or that the investment decisions we make in the future will be profitable or will equal the investment performance of the securities discussed herein.
Additional disclosures on the material risks and potential benefits of investing in corporate bonds are available on our website: https://www.cambonds.com/disclosure-statements/.