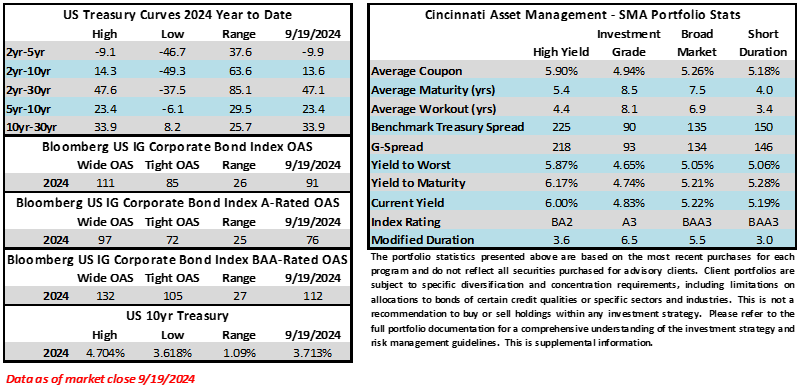
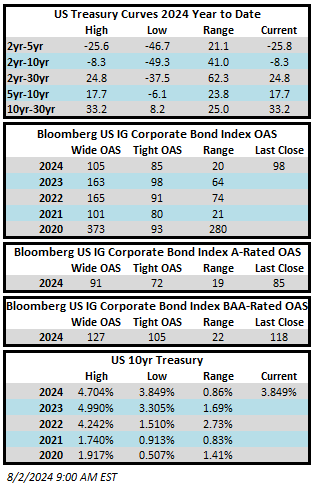
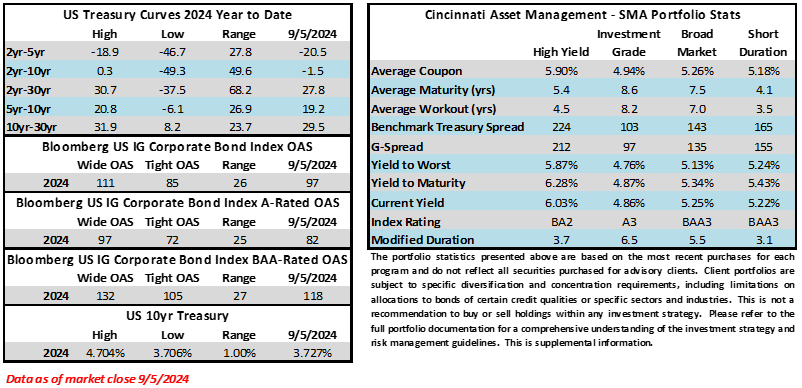
Author: Josh Adams - Portfolio Manager

17 May 2024

CAM Investment Grade Weekly Insights

Credit spreads have exhibited little change this week.  The Bloomberg US Corporate Bond Index closed at 87 on Thursday May 16 after closing the week prior at the same level.  The 10yr Treasury yield is lower this week, trading at 4.42% this Friday afternoon after closing last week at 4.50%. Through Thursday, the corporate bond index YTD total return was -0.74% while the yield-to-maturity for the benchmark was 5.44% relative to its 5-year average of 3.69%.


Economics

It was an action-packed week for data with a hot Producer Price Index (PPI) print kicking things off on Tuesday.  Market participants were on guard following PPI as many were expecting a similar surprise to the upside for the Wednesday CPI release. Instead, we got a relatively benign CPI number with weaker than expected inflation.  Wednesday also saw a retail sales release which showed a decline in April and it was also accompanied by downward revisions for sales during the first quarter.  The inflation and sales releases are dovish indicators and Treasury yields subsequently declined after those Wednesday releases, recouping some of the sell-off in rates that occurred after the hot PPI release early on Tuesday.  The next couple weeks are relatively light on the data front and the next Fed meeting on June 12 will be here before we know it.

Issuance

The IG primary market saw good activity on the week as 21 companies sold just over $28bln in new debt.  Syndicate desks are looking $25bln next week but that number could surprise to the upside as earnings season is winding down and there is no major economic data that will preclude issuers from tapping the market on any given day.  Year-to-date issuance stands at $719.8bln, well ahead of last year’s pace.

Flows

According to LSEG Lipper, for the week ended May 15, investment-grade bond funds reported a net outflow of -$1.04bln.  IG funds have seen positive flows 18 of the past 20 weeks.  YTD flows into IG stand at +$33.6bln.


This information is intended solely to report on investment strategies identified by Cincinnati Asset Management. Opinions and estimates offered constitute our judgment and are subject to change without notice, as are statements of financial market trends, which are based on current market conditions. This material is not intended as an offer or solicitation to buy, hold or sell any financial instrument. Fixed income securities may be sensitive to prevailing interest rates. When rates rise the value generally declines. Past performance is not a guarantee of future results.

06 May 2024

COMENTARIO DEL CUARTO TRIMESTRE

En el primer trimestre del año se produjo una demanda entusiasta de los inversores por bonos corporativos con grado de inversión y diferenciales de crédito más ajustados. El desempeño de los diferenciales se vio contrarrestado por los rendimientos de los bonos del Tesoro, que subieron a lo largo del trimestre a medida que los datos económicos y los mensajes de la Reserva Federal dejaron cada vez más claro que esta sería más deliberada con los recortes de tasas de lo que el mercado había anticipado a principios de 2024. En conjunto, fue un trimestre modestamente negativo en términos de rentabilidad total para el crédito de grado de inversión, pero se trata de una clase de activo que se presta mejor a una visión a más largo plazo. Creemos que el entorno actual presenta una oportunidad. Los elevados rendimientos de los bonos del Tesoro y los sólidos indicadores crediticios en todo el universo de IG tienen el potencial de generar retornos atractivos ajustados al riesgo para los inversores en crédito de IG en un horizonte temporal más largo.

Resumen del primer trimestre

El diferencial ajustado por opciones (Option Adjusted Spread, OAS) en el índice de bonos corporativos de los EE. UU. de Bloomberg abrió el año en 99 y brevemente se negoció más ampliamente durante los primeros 7 días hábiles del año antes de que el estado de ánimo mejorara hasta el punto de que nunca volvería a cotizar barato en su nivel de apertura durante el primer trimestre. El índice cotizó tan ajustado como 88 cerca de finales de marzo, su nivel más estrecho desde noviembre de 2021, antes de terminar el trimestre con un OEA de 90. Quizás el aspecto más sorprendente de este movimiento hacia diferenciales más ajustados es que se produjo en medio de una avalancha récord de oferta de nuevas emisiones, cuando los prestatarios imprimieron $529 mil millones de dólares en nueva deuda corporativa con calificación IG durante el trimestre.

A veces, una gran cantidad de nuevas emisiones en un breve periodo puede tener el efecto de aumentar los diferenciales de crédito a medida que los inversores venden sus participaciones existentes para dejar espacio para asignaciones de nuevas emisiones. Por ejemplo, en 2020 y 2022, cuando la oferta de nuevas emisiones en el primer trimestre superó los $450 millones de dólares, estuvo acompañada de un aumento significativo de los diferenciales de crédito; sin embargo, ese no fue el caso en 2024, ya que la demanda de los inversores fue sólida y los flujos de fondos de IG fueron sólidamente positivos, lo que respaldó diferenciales más ajustados y un mercado sólido para nuevas emisiones.

Pasando a los rendimientos de los bonos del Tesoro, fueron más altos en todos los ámbitos en el primer periodo del año, lo que minó algo de impulso de los rendimientos totales.

Aunque no nos gusta que las tasas suban debido a los obstáculos a corto plazo que esto crea para el rendimiento, creemos que los rendimientos más altos presentan una oportunidad para que los inversores sean compensados por asumir riesgos de duración intermedia. Los rendimientos siguen siendo elevados en relación con el pasado reciente: el rendimiento al vencimiento (Yield To Maturity, YTM) del índice corporativo cerró el primer trimestre en 5.30 %, 180 puntos básicos por encima de su YTM promedio de 3.50 % en los últimos 10 años.

El mercado luchó, pero la Reserva Federal siempre gana

En nuestro comentario de enero escribimos que creíamos que el listón era alto para los recortes de tasas a corto plazo y nuestra opinión sigue siendo la misma. A principios de año, los futuros sobre fondos de la Reserva Federal implicaban siete recortes de tasas de 25 puntos básicos en 2024 para un total del 1.751. Los inversores especularon que el primer recorte se produciría en la reunión de marzo y un recorte adicional en cada reunión posterior (el Comité Federal de Mercado Abierto [Federal Open Market Committee, FOMC] celebra 8 reuniones periódicas al año)2. Esto es lo que estaban descontando los futuros de tasas de interés a principios de enero, a pesar de que en diciembre la Reserva Federal publicó su “Resumen de Proyecciones Económicas” (Summary of Economic Projections, SEP), que incluía el gráfico de puntos que mostraba solo un 0.75 % de recortes de tasas en 2024. Para ser justos, la Reserva Federal tiene cierta responsabilidad por la exuberancia del mercado en enero gracias a su mensaje moderado tras la reunión del FOMC de diciembre.

A medida que avanzaba el primer trimestre, el mercado poco a poco empezó a aceptar la idea de que la Reserva Federal podría actuar con cautela y reducir su tasa de política con más cautela de lo esperado. Como hace cada tres meses, la Reserva Federal emitió un SEP actualizado en su reunión de marzo de 2024, que fue ligeramente más agresivo que el de diciembre, pero aun así mostró recortes de tasas del 0.75 % en 2024. Al final del primer trimestre, los futuros de fondos de la Reserva Federal reflejaron el gráfico de puntos más reciente de marzo, lo que implica una probabilidad del 56.9 % de un recorte en la reunión de junio, con 2 recortes adicionales a seguir en las reuniones de septiembre y diciembre3. En nuestra opinión, esta es una visión mucho más realista de lo que es probable que ocurra. Sin algún tipo de impacto exógeno, o en ausencia de datos que muestren que la economía se está desacelerando de manera significativa, esperamos que la Reserva Federal sea paciente mientras busca aliviar su política restrictiva. Aunque no es nuestro escenario base, creemos que existe una posibilidad razonable de que la Reserva Federal no haga ningún recorte en 2024. Creemos que el resultado más probable es que la Reserva Federal aplique uno o dos recortes de 25 puntos básicos en la segunda mitad del año. La Reserva Federal se enfrenta a un dilema difícil: no puede actuar demasiado rápido ante una economía estadounidense resiliente que sigue creando empleos; pero cuanto más tiempo mantenga las tasas en niveles elevados, mayor será la probabilidad de que la economía caiga en algún tipo de recesión. Tenemos un alto grado de convicción de que a la Reserva Federal le gustaría mucho reducir la tasa de política tan pronto como sea posible, pero no confiamos en que los datos le permitan hacerlo. Por lo tanto, creemos que es más probable que se produzca una recesión modesta antes de finales de 2025 que se deba a una versión ampliada de una política monetaria de “más alto durante más tiempo”.

Valor de la gestión activa

Creemos que una Reserva Federal que esté sesgada hacia la reducción de su tasa de interés oficial es positiva para nuestra estrategia. Somos un gestor intermedio y la mayor parte de nuestra cartera está posicionada en bonos con vencimiento entre 5 y 10 años. Nuestro caso base es el siguiente escenario: la tasa de los fondos de la Reserva Federal disminuye con el tiempo, mientras que los bonos del Tesoro con vencimientos entre 2 y 5 años disminuyen en conjunto; al mismo tiempo, los bonos del Tesoro intermedios que vencen en 5 a 10 años regresan a un nivel normalizado con pendiente ascendente. Este escenario permitiría que la curva de rendimiento recuperara parte de su inclinación clásica y la cartera de CAM se beneficiaría del efecto de “reducción” a medida que los bonos bajan por la curva de rendimiento, acercándose poco a poco al vencimiento cada día que pasa.

El gráfico anterior se remonta a 20 años atrás, hasta finales del primer trimestre de 2024. Como puede ver, la curva del Tesoro 5/10 es casi siempre positiva y ha promediado 56.6 puntos básicos (basis points, bp) de inclinación durante ese periodo en relación con su nivel de cierre de -1 pb a finales de marzo. Si se compra un bono a 10 años con la intención de conservarlo durante 5 años antes de venderlo, y la curva del Tesoro 5/10 promedia 50 bp durante ese periodo, el bono producirá 10 bp de compensación de manera anual en forma de reducción. Las curvas no son estáticas y, en nuestra opinión, se entienden mejor en términos de promedios.

Cuando se habla de crédito IG, es importante recordar que hay dos curvas que deberían interesar a un inversor. Está la curva del Tesoro antes mencionada y luego está la curva de crédito corporativo que cotiza por encima de los bonos del Tesoro; esta es la compensación adicional que recibe un inversor por asumir el riesgo crediticio adicional de poseer un bono corporativo en lugar de un bono del Tesoro. Al igual que las curvas del Tesoro, las curvas de crédito corporativo están en constante evolución y cambian todo el tiempo, por lo que pueden presentar oportunidades para el inversor activo. A diferencia de la curva del Tesoro, que puede invertirse, la curva de crédito corporativo casi nunca se invierte, aunque puede invertirse para emisores de bonos específicos de vez en cuando debido a condiciones crediticias o factores técnicos. Los gestores activos eventualmente aprovecharán estas inversiones hasta que dejen de existir.

Al final del primer trimestre, la curva de crédito corporativo típica para las empresas con calificación A que estamos analizando para nuestras carteras oscilaba entre 20 y 30 puntos básicos, con valores atípicos a ambos ladosiv. Entonces, si elegimos un punto medio de 25 bp, eso significa que un bono a 5 años de un emisor que cotiza con un diferencial de 50/5 años podría esperar que el bono a 10 años de ese mismo emisor se negocie con un diferencial de 75/10 años. Si se comprara un bono a 10 años con la expectativa de venderlo en el plazo de 5 años, produciría 5 bp de reducción del diferencial de crédito por cada año que se mantenga. Esta es solo la compensación que ofrece la curva de crédito corporativo. En entornos normalizados con una curva del Tesoro con pendiente ascendente, la reducción de la curva 5/10 TSY proporcionaría beneficios adicionales además de la compensación recibida de la curva de crédito. Este doble golpe puede amplificar la rentabilidad total, beneficiando a los inversores durante los periodos de curvatura más pronunciada.

Como gestor activo, siempre buscamos formas de maximizar el posicionamiento de los clientes a lo largo de las curvas de crédito y del Tesoro. A veces esto significa que favoreceremos vencimientos más cortos dentro de ese rango de 5 a 10 años y otras veces estaremos en el extremo más largo de ese rango. En algunos entornos, como en el que nos encontramos actualmente, la economía dictará que mantengamos los bonos existentes por más tiempo, hasta que les queden 3 o 4 años hasta su vencimiento, para maximizar la efectividad de una operación de extensión de venta. Aunque vendemos más del 98 % de nuestras participaciones antes del vencimiento, ocasionalmente las matemáticas de los bonos indicarán que es mejor mantener un bono hasta el vencimiento que si lo vendiéramos y compráramos otra cosa. Como gestor activo, nos centramos en el mercado de bonos todo el día, todos los días, evaluando de manera constante las oportunidades y buscando maximizar el valor de la tenencia de cada cliente individual.

Solvencia crediticia: fuerte a bastante fuerte

Nos enorgullecemos de nuestro proceso de investigación ascendente y creemos que es uno de los atributos más importantes que aportamos como gestor. No podemos controlar la dirección de las tasas de interés, pero podemos exhibir un gran control sobre la solvencia crediticia de los bonos de las empresas que incluimos en las carteras de clientes. Las empresas con grado de inversión reciben calificación IG por una razón: sí, las empresas con calificación IG a veces incumplen sus obligaciones de deuda, pero generalmente es un proceso de degradación crediticia que dura varios años y un gestor prudente venderá antes de que se produzca el peor de los casos de incumplimiento; en otras palabras, cuando se analiza el crédito con grado de inversión, no hay muchos bonos malos, pero sí muchos precios malos. Hay muchos bonos en el universo IG que simplemente tienen precios demasiado altos y que no ofrecen una compensación adecuada por unidad de riesgo. Siempre buscamos poblar las carteras de clientes con bonos que estén valorados de manera adecuada en un esfuerzo por reducir la volatilidad y limitar la perspectiva de ampliación de los diferenciales durante periodos difíciles del mercado.

Aunque nos centramos en el análisis de crédito individual, observar las métricas crediticias para el universo IG en su conjunto es instructivo cuando intentamos ilustrar la salud actual del mercado en general y también nos ayuda a juzgar el valor relativo de las oportunidades de inversión. Al final del cuarto trimestre de 2023, las métricas crediticias en todo IG eran sólidas<sup>1</sup>. Los márgenes de ganancias antes de intereses, impuestos, depreciación y amortización (Earnings Before Interest, Taxes, Depreciation, and Amortization, EBITDA) en particular continuaron luciendo impresionantes en relación con la historia y están cerca de máximos históricos, mientras que el crecimiento de EBITDA volvió a ser positivo después de un trimestre de caídas.

El apalancamiento de la deuda neta para el índice IG no financiero se ha mantenido estable durante 5 trimestres consecutivos y ha mejorado desde el primer semestre de 2022. La única métrica crediticia importante que ha disminuido en los últimos trimestres es la cobertura de intereses y eso se debe en gran medida a que las empresas han estado emitiendo nueva deuda con cupones más altos que la deuda que vencíav. En el primer trimestre de 2024, el cupón promedio de las nuevas emisiones de IG fue del 5.33 %, 202 bp más que el cupón promedio de los bonos que vencen, que fue del 3.31 %vi. Para ponerlo en contexto, compare con el 7.24 %, que era la tasa hipotecaria fija promedio a 30 años para un comprador residencial al final del primer trimestre: el costo de capital para las empresas con calificación IG parece muy razonablevii. En pocas palabras, los inversores no necesitan asumir mucho riesgo crediticio o de tasa de interés para generar retornos saludables en el crédito con calificación IG: las métricas crediticias agregadas se encuentran en niveles saludables y el rendimiento del índice es >5 %.

Mirada hacia el futuro

Los últimos años han sido un momento histórico en los mercados crediticios. Desde marzo de 2020 hasta marzo de 2022 experimentamos posiblemente la política de la Reserva Federal más fácil de la historia, con un 0 % de fondos de la Reserva Federal acompañado de un estímulo económico sin precedentes. Luego, la Reserva Federal aumentó su tasa de política 11 veces en 18 meses hasta su rango actual de 5.25 % a 5.5 %, el ritmo más rápido de ajuste en más de 40 añosviii. Una vez más estamos al borde del precipicio de la historia, ya que la Reserva Federal tiene la tarea de terminar la guerra contra la inflación y al mismo tiempo restaurar su tasa de política a un nivel más normativo. Es un entorno de incertidumbre: ¿hacia dónde irá la economía a partir de ahora? Continuaremos centrándonos en nuestro pan de cada día y eso es poblar las carteras de clientes con bonos de empresas que están bien preparadas para navegar en una variedad de entornos económicos. Le agradecemos su interés y su colaboración continua mientras navegamos por el resto del año 2024.

.

Esta información solo tiene el propósito de dar a conocer las estrategias de inversión identificadas por Cincinnati Asset Management. Las opiniones y estimaciones ofrecidas están basadas en nuestro criterio y están sujetas a cambios sin previo aviso, al igual que las declaraciones sobre las tendencias del mercado financiero, que dependen de las condiciones actuales del mercado. Este material no tiene como objetivo ser una oferta ni una solicitud para comprar, mantener ni vender instrumentos financieros. Los valores de renta fija pueden ser vulnerables a las tasas de interés vigentes. Cuando las tasas aumentan, el valor suele disminuir. El rendimiento pasado no es garantía de resultados futuros. El rendimiento bruto de la tarifa de asesoramiento no refleja la deducción de las tarifas de asesoramiento de inversión. Nuestras tarifas de asesoramiento se comunican en el Formulario ADV Parte 2A. En general, las cuentas administradas mediante programas de firmas de corretaje incluyen tarifas adicionales. Los rendimientos se calculan mensualmente en dólares estadounidenses e incluyen la reinversión de dividendos e intereses. El índice no está administrado y no considera las tarifas de la cuenta, los gastos y los costos de transacción. Se muestra con fines comparativos y se basa en información generalmente disponible al público tomada de fuentes que se consideran confiables. No se hace ninguna afirmación sobre su precisión o integridad.

La información suministrada en este informe no debe considerarse una recomendación para comprar o vender ningún valor en particular. No hay garantía de que los valores que se tratan en este documento permanecerán en la cartera de una cuenta en el momento en que reciba este informe o que los valores vendidos no hayan sido vueltos a comprar. Los valores de los que se habla no representan la cartera completa de una cuenta y, en conjunto, pueden representar solo un pequeño porcentaje de las tenencias de cartera de una cuenta. No debe suponerse que las transacciones de valores o participaciones analizadas fueron o demostrarán ser rentables, o que las decisiones de inversión que tomemos en el futuro serán rentables o igualarán el rendimiento de la inversión de los valores discutidos en este documento. Como parte de la educación de los clientes sobre la estrategia de CAM, podemos incluir referencias a tasas y diferenciales históricos. Los ejemplos hipotéticos que hacen referencia al nivel o cambios en las tasas y diferenciales tienen únicamente fines ilustrativos y educativos. No pretenden representar el desempeño de ninguna cartera o valor en particular, ni incluyen el impacto de las tarifas y gastos; tampoco toman en consideración todas las condiciones económicas y de mercado que influyen en nuestra toma de decisiones. Por lo tanto, las cuentas de los clientes pueden experimentar o no escenarios similares a los mencionados en este documento.

En nuestro sitio web se encuentran disponibles las divulgaciones adicionales sobre los riesgos materiales y los posibles beneficios de invertir en bonos corporativos: Enlace de Divulgación de CAM.

i Bloomberg, 28 de marzo de 2024 “High‐Grade Bond Sales on Easter Pause After Record First Quarter” (“Ventas de bonos de alta
calidad en pausa de Pascua después de un primer trimestre récord”)
ii Bloomberg WIRP, 29 de diciembre de 2023 “Fed Funds Futures” (“Futuros de los fondos de la Reserva Federal”)
iii Bloomberg WIRP, 29 de marzo de 2024 “Fed Funds Futures” (“Futuros de los fondos de la Reserva Federal”)
iv Raymond James & Associates, 28 de marzo de 2024 “Fixed Income Spreads” (“Diferenciales de renta fija”)

v Barclays Bank PLC, 13 de marzo de 2024 “US Investment Grade Credit Metrics, Q24 Update: No Concerns” (“Métricas crediticias de
grado de inversión de los EE. UU., actualización del trimestre de 2024: sin preocupaciones”)
vi JP Morgan, 3 de abril de 2024 “US High Grade Corporate Bond Issuance Review” (“Revisión de la emisión de bonos corporativos de
alto grado de los EE. UU.”)
vii Índice Bloomberg ILM3NAVG, 28 de marzo de 2024 “Bankrate.com US Home Mortgage 30 Year Fixed National Avg”
(“Bankrate.com: promedio nacional de la hipoteca de vivienda en los EE. UU. a 30 años fija”)
viii CNBC, 13 de diciembre de 2023 “The Federal Reserve’s period of rate hikes may be over. Here’s why consumers are still reeling”
(“El periodo de subidas de tasas de la Reserva Federal puede haber terminado. Aquí le contamos por qué los consumidores siguen
conmocionados”)

03 May 2024

CAM Investment Grade Weekly Insights

Credit spreads stuck to a tight range during the week and are looking as though they will finish the period relatively unchanged from where they began.  The Bloomberg US Corporate Bond Index closed at 87 on Thursday May 2 after closing the week prior at the same level.  The 10yr Treasury yield is lower this week, trading at 4.51% this Friday afternoon after closing last week at 4.66%. Through Thursday, the corporate bond index YTD total return was -2.20% while the yield-to-maturity for the benchmark was 5.60% relative to its 5-year average of 3.67%.

Economics

It was a busy week for data with the two main events being the FOMC on Wednesday and the April payroll report on Friday.  The Fed release was in-line with expectations although Chairman Powell was clear that the committee does not anticipate additional rate hikes. The prospect for additional hikes was a theme that some investors had been latching onto in recent weeks so it was reassuring for the dovish camp to hear Powell address this specifically.  The Fed then got the type of data point they have been looking for with Friday’s jobs report: average hourly earnings came in cooler than expectations and job gains for April slowed to 175,000 versus the survey estimate of 240,000.  This was the lightest monthly print for payrolls since October of last year.  Next week is an extremely light week for economic data with the only meaningful prints in the latter half of the week with jobless claims and consumer confidence releases.

Issuance

It was a reasonably busy week for issuance considering the backdrop of earnings and the FOMC meeting as IG-rated companies printed $19bln of new debt.  Syndicate desks are looking for a busier week next week with an estimate of $30bln.  The window for new issuance will start to open up as earnings season winds down and with the lack of the aforementioned “market-moving” economic releases.  Year-to-date issuance stands at $636bln.

Flows

According to LSEG Lipper, for the week ended May 1, investment-grade bond funds reported a net inflow of +$812mm.  IG funds have seen positive flows 17 of the past 18 weeks.  YTD flows into IG stand at +$33.7bln.


This information is intended solely to report on investment strategies identified by Cincinnati Asset Management. Opinions and estimates offered constitute our judgment and are subject to change without notice, as are statements of financial market trends, which are based on current market conditions. This material is not intended as an offer or solicitation to buy, hold or sell any financial instrument. Fixed income securities may be sensitive to prevailing interest rates. When rates rise the value generally declines. Past performance is not a guarantee of future results.

26 Apr 2024

CAM Investment Grade Weekly Insights

Credit spreads battled through some volatility this week before moving tighter near the end of the period.  The Bloomberg US Corporate Bond Index closed at 89 on Thursday April 25 after closing the week prior at 92.  The 10yr Treasury yield is up slightly on the week, trading at 4.67% this Friday afternoon after closing last week at 4.62%. Through Thursday, the corporate bond index YTD total return was -3.22% while the yield-to-maturity for the benchmark was 5.75% relative to its 5-year average of 3.66%.

Economics

Most of the big economic news of the week occurred in the second half of the period.  Durable goods orders were released on Wednesday with a headline number for March that was in-line with consensus but accompanied by a significant revision downward in February’s number.  GDP data on Thursday was very weak relative to expectations, coming in at +1.6% versus the survey of +2.5% which caused a sizeable selloff in equities and ironically sent Treasury yields higher as the inflationary component of GDP advanced higher relative to expectations.  Friday saw the release of personal spending data as well as PCE data with both coming in hot versus economist estimates.  Taking it all together, there was something for both hawks and doves but none of these numbers are likely to be a game changer for the Fed in its zeal to cut rates.  The FOMC releases its May rate decision next Wednesday and interest rate futures are currently implying just a 2.6% probability of a cut as we go to print this Friday afternoon.  The ride on the road to policy easing continues to be a long and complicated journey.

Issuance

It was the slowest week of the year for new issue with only four borrowers tapping the market for a total of $11.6bln.  The consensus estimate of $20-$25bln was obviously too optimistic especially considering 32% of the S&P 500 reported earnings this week.  Next week is another busy one for earnings and with a Fed meeting on Wednesday prognosticators are only looking for $15bln in new supply.  Year-to-date issuance stands at $616.8bln, up >40% relative to 2023.

Flows

According to LSEG Lipper, for the week ended April 24, investment-grade bond funds reported a net outflow of -$607mm.  This was the first outflow of 2024, breaking a streak of 18 consecutive weeks of inflow for IG funds.  YTD flows into IG stand at +$32.9bln.

This information is intended solely to report on investment strategies identified by Cincinnati Asset Management. Opinions and estimates offered constitute our judgment and are subject to change without notice, as are statements of financial market trends, which are based on current market conditions. This material is not intended as an offer or solicitation to buy, hold or sell any financial instrument. Fixed income securities may be sensitive to prevailing interest rates. When rates rise the value generally declines. Past performance is not a guarantee of future results.

19 Apr 2024

CAM Investment Grade Weekly Insights

Spreads finally took a breather this week as the market moved modestly wider throughout the period.  The Bloomberg US Corporate Bond Index closed at 92 on Thursday April 18 after closing the week prior at 89.  The 10yr Treasury yield is higher again this week and is trading at 4.63% this Friday morning after closing last week at 4.52%. Higher Treasury yields have been a headwind for IG returns so far this year –through Thursday, the index YTD total return was -3.07% while the yield-to-maturity for the benchmark was 5.73% relative to its 5-year average of 3.65%.

Economics

Things got off to a hot start right away on Monday morning as March retail sales data beat expectations in a big way.  Some economists have argued that an early Easter may have pulled some spending forward from April into March but there is no denying that it was a very solid number and yet another data point showing a resilient economy. Federal Reserve chairman Jerome Powell may finally be coming around to the realization that the Fed will have difficulty justifying near term rate cuts.  At an economic forum on Tuesday, Powell commented on rate cuts: “The recent data have clearly not given us greater confidence and indicate that it is likely to take longer than expected to achieve that confidence.” Not all the data was rosy this week as Thursday’s existing home sales release showed a 4.3% decline from February, the biggest monthly drop in over a year.  Additionally, higher Treasury yields caused the average rate on the standard 30-year fixed rate mortgage to surge to 7.1%. Next week we get plenty of data with the grand finale on Friday morning when Core PCE will hit the tape.

Issuance

Issuance was on the screws relative to estimates on the week as volume came in at just over $31bln, although there was not much diversity with the financial sector accounting for 90% of that number.  Syndicate desks are looking for $20-$25bln of new bonds next week.  Year-to-date issuance stands at $605.2bln, up +42% relative to 2023.  It “feels” like new issue concessions showed some improvement on the week but the reality is that it has not yet shown up in the numbers.  Even still, data did show that 66% of deals priced this week rallied in the secondary market.

Flows

According to LSEG Lipper, for the week ended April 17, investment-grade bond funds reported a net inflow of +$170mm.  This was the 18th consecutive weekly inflow for IG funds.  YTD flows into IG stand at +$33.5bln.

This information is intended solely to report on investment strategies identified by Cincinnati Asset Management. Opinions and estimates offered constitute our judgment and are subject to change without notice, as are statements of financial market trends, which are based on current market conditions. This material is not intended as an offer or solicitation to buy, hold or sell any financial instrument. Fixed income securities may be sensitive to prevailing interest rates. When rates rise the value generally declines. Past performance is not a guarantee of future results.

12 Apr 2024

CAM Investment Grade Weekly Insights

Spreads inched tighter during the week with the Bloomberg US Corporate Bond Index at its narrowest level of the year.  The index closed at 87 on Thursday April 11 after having closed the week prior at 89.  The 10yr is trading at 4.52% this Friday morning after closing last week at 4.40%. Through Thursday, the index YTD total return was -2.40% while the yield-to-maturity for the benchmark was 5.62% relative to its 5-year average of 3.65%.

Economics

It was an active week for economic data with the highlight of the week being another firmer than anticipated CPI print on Wednesday.  This caused a sell-off in Treasuries with the 2-year leading the way as its yield finished the day 23bps higher.  At the end of Wednesday, rates across the board were at the highest levels of 2024 but have since come off the highs and the entire curve is rallying to the tune of about 10bps as we go to print this Friday morning.  These short term moves should not distract corporate bond investors from the bigger picture: this is an asset class that is well poised to deliver solid returns in the future, in our opinion.  This entire year we have been saying that we felt that the bar was quite high for the Fed to begin cutting rates because the economy was simply too strong and the economic data too good.  We were quite puzzled in January when interest rate futures were pricing 6 or 7 cuts despite a Fed dot plot that indicated 3 cuts at the median.  The market has now come around to our view with futures pricing just shy of 2 cuts in 2024 as of this Friday morning.  It is clear from its messaging that the Fed wants to cut and we know it is coming at some point.  We believe that cuts would be a positive for our strategy as we think that it would be an important catalyst for Treasury curves to regain some upward positive slope.  The Fed will cut when the data that it depends on will allow it to cut.  It is as simple as that.  In the interim, we believe that this backup in rates has created an opportunity for long term credit investors.  We would not be surprised if we were to look back a year or two from now and long for the yields that are available to corporate credit investors today.


Issuance

Issuance was in-line with estimates on the week as companies priced $20.2bln of new debt.  Next week dealers are estimating $30bln of new supply with banks leading the way as they report earnings and exit their blackout periods.  Year-to-date issuance stands at $573.7bln, up 39% relative to 2023.

Flows

According to LSEG Lipper, for the week ended April 10, investment-grade bond funds reported a net inflow of +$3.2bln.  This was the 17th consecutive weekly inflow for IG funds.  YTD flows into IG stand at +$33.3bln.

This information is intended solely to report on investment strategies identified by Cincinnati Asset Management. Opinions and estimates offered constitute our judgment and are subject to change without notice, as are statements of financial market trends, which are based on current market conditions. This material is not intended as an offer or solicitation to buy, hold or sell any financial instrument. Fixed income securities may be sensitive to prevailing interest rates. When rates rise the value generally declines. Past performance is not a guarantee of future results.

10 Apr 2024

2024 Q1 Investment Grade Quarterly

Click here to read the Spanish version / Haga clic aquí para leer la versión en español

The first quarter of the year saw enthusiastic investor demand for investment grade corporate bonds and tighter credit spreads.  Spread performance was offset by Treasury yields that drifted higher throughout the quarter as economic data and Federal Reserve messaging made it increasingly clear that the Fed would be more deliberate with rate-cuts than what the market had anticipated at the beginning of 2024.  Taking it all together, it was a modestly negative quarter of total returns for IG credit but this is an asset class that best lends itself to a longer term view.  We believe that the current environment presents an opportunity.  Elevated Treasury yields and strong credit metrics across the IG universe have the potential to generate attractive risk-adjusted returns for IG credit investors over a longer time horizon.

First Quarter Review

The option adjusted spread (OAS) on the Bloomberg US Corporate Bond Index opened the year at 99 and it briefly traded wider during the first 7 trading days of the year before the mood improved to the point that it would never again trade cheap to its opening level for the duration of the first quarter.  The index traded as tight as 88 near the end of March, its narrowest level since November 2021, before finishing the quarter at an OAS of 90.  Perhaps the most surprising aspect of this movement toward tighter spreads is that it occurred amid a record breaking deluge of new issue supply as borrowers printed $529 billion in new IG-rated corporate debt during the quarter.i

Sometimes a large amount of new issuance within a small window of time can have the effect of pushing credit spreads wider as investors sell existing holdings to make room for new issue allocations.  For example, in 2020 and 2022, when 1Q new issue supply exceeded $450mm, it was accompanied by a meaningful move wider in credit spreads. However, that was not the case in 2024 as investor demand was robust and IG fund flows were solidly positive which was supportive of both tighter spreads and a robust market for new issuance.

Moving on to Treasury yields, they were higher across the board in the first period of the year which sapped some momentum from total returns.

Although we don’t like to see rates move higher because of the short term headwinds it creates for performance, we think that higher yields present an opportunity for investors to be compensated for taking intermediate duration risk.  Yields remain elevated relative to the recent past –the yield to maturity (YTM) for the Corporate Index closed the first quarter at 5.30% which was 180 basis points higher than its average YTM of 3.50% over the past 10 years.

The Market Fought, but the Fed Always Wins

In our January commentary we wrote that we believed that the bar was high for near term rate cuts and our view remains the same.  At the beginning of the year Fed Funds Futures were implying seven 25bp rate cuts in 2024 for a total of 1.75%.  Investors speculated that the first cut would occur at the March meeting with an additional cut at every meeting thereafter (the FOMC holds 8 regularly scheduled meetings per year).ii  This is what interest rate futures were pricing in early January despite the fact that in December the Fed released its “Summary of Economic Projections” (SEP) which included the dot plot showing just 0.75% worth of rate cuts in 2024.  To be fair, the Fed bears some responsibility for the market exuberance in January thanks to its dovish messaging on the heels of the December FOMC meeting.

As the first quarter wore on, the market slowly came around to the idea that the Fed may tread lightly, decreasing its policy rate more cautiously than expected.  As it does every three months, the Fed issued an updated SEP at its March 2024 meeting which was slightly more hawkish than the December release but it still showed 0.75% worth of rate cuts in 2024.  At the end of the first quarter, Fed Funds Futures mirrored the most recent March dot plot implying a 56.9% chance of a cut at the June meeting with 2 additional cuts to follow at the September and December meetings.iii  This is a much more realistic view of what is likely to occur in our opinion.  Without some kind of exogenous shock, or in the absence of data that shows that the economy is significantly slowing, we expect that the Fed will be patient as it looks to ease restrictive policy.  Although it is not our base case, we think that there is a reasonable chance that the Fed may not cut at all in 2024.  We think that the most likely outcome is that the Fed will deliver one or two 25bp cuts in the second half of the year.  The Fed faces a difficult conundrum –it cannot move too quickly in the face of a resilient U.S. economy that is still creating jobs; but the longer it keeps rates at elevated levels, the greater the probability that it tumbles the economy into some type of recession.  We have a high degree of conviction that the Fed would very much like to decrease the policy rate as soon as it possibly can but we lack confidence that the data will allow them to do so.  Therefore, we believe that a modest recession before the end of 2025 is more likely than not due to an extended version of “higher for longer” monetary policy.

Value of Active Management

We believe that a Fed that is biased toward decreasing its policy rate is a positive for our strategy.  We are an intermediate manager with the bulk of our portfolio positioned in bonds that mature in 5 to 10 years.  Our base case is the following scenario: The Federal Funds rate decreases over time while Treasuries that range in maturity from 2 to 5 years decrease in concert.  At the same time intermediate Treasuries that mature in 5 to 10 years move back toward a normalized upward sloping level.  This scenario would allow the yield curve to regain some of its classical steepness and CAM’s portfolio would benefit from the “roll-down” effect as bonds move down the yield curve, inching closer to maturity with each passing day.

The above chart goes back 20 years from the end of the first quarter of 2024.  As you can see, the 5/10 Treasury curve is almost always positive and it has averaged 56.6bps of steepness over that time period relative to its closing level of -1bp at the end of March.  If a 10-year bond is purchased with the intention of holding it for 5 years before selling, and the 5/10 Treasury curve averages 50bps over that period, the bond will yield 10bps of compensation annually in the form of roll-down.  Curves are not static and in our opinion are best understood in terms of averages.

When discussing IG credit it is important to remember that there are two curves an investor should care about.  There is the aforementioned Treasury curve and then there is the corporate credit curve that trades on top of Treasuries.  This is the extra compensation that an investor receives for taking the additional credit risk of owning a corporate bond over a Treasury bond.  Like Treasury curves, corporate credit curves are ever evolving and changing all of the time, thus they can present opportunity for the active investor.  Unlike the Treasury curve, which can invert, the corporate credit curve is almost never inverted, though it can be inverted for specific bond issuers in spots from time to time due to credit conditions or technical factors.  Active managers will eventually take advantage of these inversions until they no longer exist.

At the end of the first quarter the typical corporate credit curve for the A-rated companies that we are looking at for our portfolios ranged from 20 to 30 basis points with outliers on either side of that.iv  So if we pick a midpoint of 25bps then that means a 5-year bond of an issuer that trades at a spread of 50/5yr could expect to see the 10-year bond for that same issuer trade at a spread of 75/10yr.  If a 10-year bond were purchased with the expectation of selling it at the 5-year mark, it would yield 5bps of roll-down credit spread compression for each year it is held.  This is just the compensation afforded by the corporate credit curve.  In normalized environments with an upward sloping Treasury curve, roll-down from the 5/10 TSY curve would provide additional benefits on top of compensation received from the credit curve.  This one-two punch can amplify total returns, benefiting investors during periods of curve steepness.

As an active manager we are always looking for ways to maximize client positioning along the credit and Treasury curves.  Sometimes this means we will favor shorter maturities within that 5-10yr band and other times we will be on the longer end of that range.  In some environments, like the one we are in currently, the economics will dictate that we hold existing bonds longer, until they have 3 or 4 years left to maturity in order to maximize the effectiveness of a sale-extension trade.  Although we sell 98%+ of our holdings prior to maturity, occasionally the bond math will indicate that we are better off holding a bond to maturity than we would be if we sold it and bought something else.  As an active manager we are focused on the bond market all day every day constantly evaluating opportunities and looking to maximize the value of each individual client holding.

Creditworthiness: Strong to Quite Strong

We pride ourselves on our bottom up research process and believe it is one of the most important attributes that we bring to the table as a manager.  We cannot control the direction of interest rates but we can exhibit a great deal of control over the credit worthiness of the bonds of the companies that we include in client portfolios.  Investment grade companies are rated IG for a reason –yes, IG-rated companies do sometimes default on their debt obligations, but it is usually a multi-year process of credit degradation and a prudent manager will sell before the worst case of a default comes to fruition.  In other words, when looking at investment grade credit, there are not many bad bonds, but there are a lot of bad prices.  There are many bonds in the IG universe that are simply priced too rich and that do not offer adequate compensation per unit of risk.  We always seek to populate client portfolios with bonds that are appropriately valued in an effort to reduce volatility and limit the prospect of spread widening during difficult market periods.

Although we are focused on individual credit analysis, looking at credit metrics for the IG-universe as a whole is instructive when we are trying to illustrate the current health of the overall market and it also helps us judge the relative value of investment opportunities.  At the end of the 4th quarter of 2023, credit metrics across IG were strong.*  EBITDA margins in particular continued to look impressive relative to history and are near all-time highs while EBITDA growth turned back to positive after a quarter of declines.

Net debt leverage for the non-financial IG index has been stable for 5 consecutive quarters and has improved since the first half of 2022.  The only major credit metric that has declined in recent quarters is interest coverage and that is largely because companies have been issuing new debt with higher coupons than the debt that has been maturing.v  In the first quarter of 2024, the average coupon of IG new issues was 5.33% which was 202bp higher than the average coupon of maturing bonds which was 3.31%.vi  For context, compare that to 7.24% which was the average 30yr fixed mortgage rate for a residential buyer at the end of the first quarter: the cost of capital for IG-rated companies looks very reasonable.vii  Simply put, investors do not need to take a lot of credit risk or interest rate risk to generate healthy returns in IG-rated credit  –aggregate credit metrics are at healthy levels and the index yield is >5%.

Looking Ahead

The last several years have been a historic time in the credit markets.  From March 2020 until March 2022 we experienced arguably the easiest Fed policy in history with 0% Fed Funds accompanied with unprecedented economic stimulus.  Then the Fed increased its policy rate 11 times in 18 months to its current range of 5.25%-5.5% –the fastest pace of tightening in over 40 years.viii  We are at the precipice of history once again as the Fed is tasked with finishing the war against inflation while restoring its policy rate to a more normative level.  It is an environment of uncertainty –where will the economy go from here?  We will continue to focus on our bread and butter and that is populating client portfolios with the bonds of companies that are well poised to navigate a variety of economic environments.  We thank you for your interest and continued partnership as we navigate the balance of 2024.

This information is intended solely to report on investment strategies identified by Cincinnati Asset Management. Opinions and estimates offered constitute our judgment and are subject to change without notice, as are statements of financial market trends, which are based on current market conditions. This material is not intended as an offer or solicitation to buy, hold or sell any financial instrument.  Fixed income securities may be sensitive to prevailing interest rates.  When rates rise the value generally declines.  Past performance is not a guarantee of future results.  Gross of advisory fee performance does not reflect the deduction of investment advisory fees.  Our advisory fees are disclosed in Form ADV Part 2A.  Accounts managed through brokerage firm programs usually will include additional fees.  Returns are calculated monthly in U.S. dollars and include reinvestment of dividends and interest. The index is unmanaged and does not take into account fees, expenses, and transaction costs.  It is shown for comparative purposes and is based on information generally available to the public from sources believed to be reliable.  No representation is made to its accuracy or completeness. 

The information provided in this report should not be considered a recommendation to purchase or sell any particular security.  There is no assurance that any securities discussed herein will remain in an account’s portfolio at the time you receive this report or that securities sold have not been repurchased.  The securities discussed do not represent an account’s entire portfolio and in the aggregate may represent only a small percentage of an account’s portfolio holdings.  It should not be assumed that any of the securities transactions or holdings discussed were or will prove to be profitable, or that the investment decisions we make in the future will be profitable or will equal the investment performance of the securities discussed herein.    As part of educating clients about CAM’s strategy we may include references to historical rates and spreads.  Hypothetical examples referencing the level of, or changes to, rates and spreads are for illustrative and educational purposes only.  They are not intended to represent the performance of any particular portfolio or security, nor do they include the impact of fees and expenses.  They also do not take into consideration all market and economic conditions that influence our decision-making.  Therefore, client accounts may or may not experience scenarios similar to those referenced herein.

Additional disclosures on the material risks and potential benefits of investing in corporate bonds are available on our website: https://www.cambonds.com/disclosure-statements/

i Bloomberg, March 28 2024 “High-Grade Bond Sales on Easter Pause After Record First Quarter”

ii Bloomberg WIRP, December 29 2023 “Fed Funds Futures”

iii Bloomberg WIRP, March 29 2024 “Fed Funds Futures”

iv Raymond James & Associates, March 28 2024 “Fixed Income Spreads”

v Barclays Bank PLC, March 13 2024 “US Investment Grade Credit Metrics, Q24 Update: No Concerns”

vi J.P. Morgan, April 3 2024 “US High Grade Corporate Bond Issuance Review”

vii Bloomberg ILM3NAVG Index, March 28 2024 “Bankrate.com US Home Mortgage 30 Year Fixed National Avg”

viii CNBC, December 13 2023 “The Federal Reserve’s period of rate hikes may be over.  Here’s why consumers are still reeling”

22 Mar 2024

CAM Investment Grade Weekly Insights

Spreads stuck to a tight range this week and are looking to finish the period at the narrowest levels of 2024.  The Bloomberg US Corporate Bond Index closed at 88 on Thursday March 21 after having closed the week prior at 89.  The 10yr is trading at 4.22% this Friday morning after closing last week at 4.31%. Through Thursday, the Investment Grade Corporate Index YTD total return was -1.00%.  The story remains the same: spreads are tight but yields are elevated.  The yield to maturity for the Bloomberg US Corporate Bond index as of Thursday evening was 5.34%.

Economics

It was a light week for economic data but an extremely busy week for central banks throughout the globe.  There were rate decisions from Australia, the BOJ, the BOE and of course the FOMC, among others.  Chairman Powell walked a tightrope in his press conference and the market interpreted the Fed release as slightly dovish.  The Fed made it clear that rate cuts are still on the agenda with its updated dot projections.  The market is currently coalescing around 3 cuts for a total of 75bps beginning at the June meeting.  This is far from certain in our view and only time (and ensuing economic data) will tell.  As of this morning, interest rate futures are implying a 65% chance of a cut in June.

Issuance

Issuance was in-line with estimates on the week as companies priced more than $27bln of new debt.  For the year, the torrid pace of issuance has now officially passed the half trillion mark, with 2024 setting a new record for how quickly $500bln was breached.  Next week dealers are estimating $20bln of new supply.  This number is certainly achievable, especially if Monday is busy, but we would not be surprised if the issuance tally is underwhelming relative to expectations.  It is typically a seasonally slow week and the bond market closes early on Friday leaving Monday and Tuesday as the most favorable days for new issue prints.

Flows

According to LSEG Lipper, for the week ended March 20, investment-grade bond funds reported a net inflow of +$1.4bln.  This was the 14th consecutive weekly inflow for IG funds.  YTD flows into IG stand at +$23.9bln.

This information is intended solely to report on investment strategies identified by Cincinnati Asset Management. Opinions and estimates offered constitute our judgment and are subject to change without notice, as are statements of financial market trends, which are based on current market conditions. This material is not intended as an offer or solicitation to buy, hold or sell any financial instrument. Fixed income securities may be sensitive to prevailing interest rates. When rates rise the value generally declines. Past performance is not a guarantee of future results.

15 Mar 2024

CAM Investment Grade Weekly Insights

Spreads moved tighter throughout the week.  The Bloomberg US Corporate Bond Index closed at 91 on Thursday March 15 after having closed the week prior at 95.  The 10yr is trading at 4.31% this Friday morning after closing last week at 4.07%. Through Thursday, the Investment Grade Corporate Index YTD total return was -1.40%.  Although spreads are near the tight end of their historical range, yields remain significantly higher than they have been in the recent past and meaningfully higher than they have been for most of the past two decades.  The yield to maturity for the Bloomberg US Corporate Bond index as of Thursday evening was 5.4%, relative to its 10 and 20-year averages of 3.49% and 4.15%, respectively.

Economics

It was a mixed week for economic data but, overall, the economy remains resilient and the job market hasn’t yet lost its luster.  On Tuesday, the core CPI gauge exceeded expectations for the second straight month.  Headline CPI was up +3.2% year over year in February, slightly ahead of the +3.1% recorded for January.  On Thursday, the data had something for both Hawks and Doves.  PPI came in hot with pries paid during the month of February exceeding estimates while an employment report showed that fewer people were applying for jobless benefits.  On the other side of the coin, tepid February retail sales data showed that consumer spending slowed relative to estimates.  Market expectations have continued to shift –last week at this time interest rate futures were showing that investors were looking for 3 or 4 rate cuts in 2024 while this week the consensus has shifted more toward only 3 cuts.  Next week is extremely light on the data front with the exception of the main event on Wednesday as all eyes will be on the FOMC rate decision.  The Fed will also release its first update to the vaunted dot plot since December of 2023.


Issuance

In was another solid week of issuance as companies priced over $37bln of new debt, in line with sell side estimates.  2024 continues to be the busiest year in the history of the investment grade primary market with supply running at ~$476bln YTD, which is +36% higher than 2023’s pace.  Next week is expected to see supply slow slightly with dealers estimating $25-$30bln of new supply.

Flows

According to LSEG Lipper, for the week ended March 13, investment-grade bond funds reported a net inflow of +$1.61bln.  This was the thirteenth consecutive weekly inflow for IG funds.  YTD flows into IG stand at +$22.5bln relative to +$13.1bln for the same period last year.  Demand for IG credit has been strong as investors look to lock-in yields ahead of potential Fed rate-cuts.

This information is intended solely to report on investment strategies identified by Cincinnati Asset Management. Opinions and estimates offered constitute our judgment and are subject to change without notice, as are statements of financial market trends, which are based on current market conditions. This material is not intended as an offer or solicitation to buy, hold or sell any financial instrument. Fixed income securities may be sensitive to prevailing interest rates. When rates rise the value generally declines. Past performance is not a guarantee of future results.

08 Mar 2024

CAM Investment Grade Weekly Insights

Spreads were relatively unchanged during the week as the index sat 7bps off its tightest levels of the year through Thursday’s close.  The Bloomberg US Corporate Bond Index closed at 96 on Thursday March 8 after having closed the week prior at 97.  The 10yr is trading at 4.07% this Friday morning after closing last week at 4.18%. Through Thursday, the Investment Grade Corporate Index YTD total return was -0.54%.

Economics

The two highlights of the week were Jay Powell’s testimony to Congress on Wednesday morning and the nonfarm payrolls report on Friday.  Chairman Powell stayed on message while addressing lawmakers.  He continued to emphasize the Fed’s commitment to data dependency while indicating it is likely that the FOMC will begin to cut rates in 2024.  The jobs number on Friday was the type of print that had something for both the “cut now camp” and the “no cuts in 2024 camp.”  The report showed that the U.S. unemployment rate climbed to a two year high for the month of February while wage growth slowed.  Still, payrolls continued to grow at a healthy rate and the unemployment rate remains quite low by historical standards.  Post jobs report, interest rate futures were fully pricing in a 25bp rate cut in June and a total of 100bps by the end of 2024.

Issuance

In what seems to be a recurring theme, it was another banner week for issuance as more than $50bln of new debt priced for the third consecutive week.  2024 continues to be the busiest year in the history of the investment grade primary market with supply running at ~$440bln YTD, which is +30% YoY.  Next week is expected to feature brisk activity as well with estimates looking for $30-$35bln of new debt.

Flows

According to LSEG Lipper, for the week ended March 6, investment-grade bond funds reported a net inflow of +$4.5bln.  This was the twelfth consecutive weekly inflow for IG funds and the largest inflow in over a year.


This information is intended solely to report on investment strategies identified by Cincinnati Asset Management. Opinions and estimates offered constitute our judgment and are subject to change without notice, as are statements of financial market trends, which are based on current market conditions. This material is not intended as an offer or solicitation to buy, hold or sell any financial instrument. Fixed income securities may be sensitive to prevailing interest rates. When rates rise the value generally declines. Past performance is not a guarantee of future results.