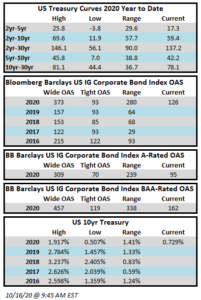
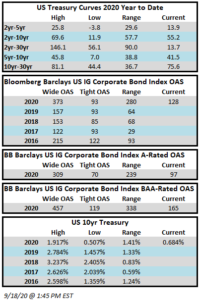
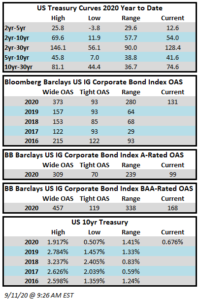
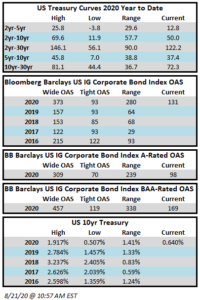
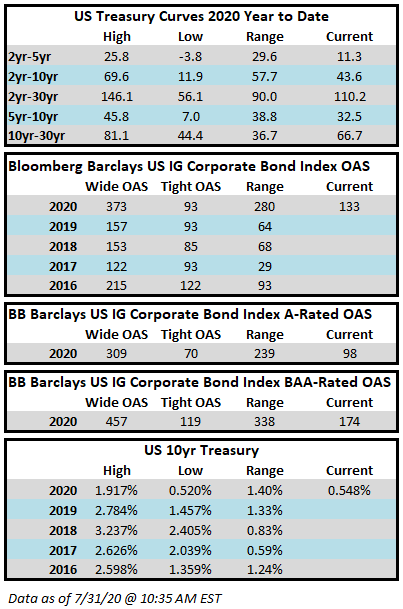
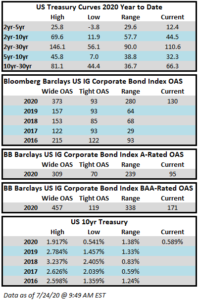
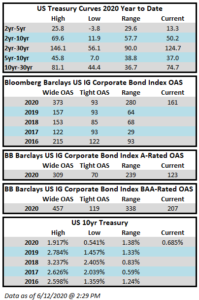
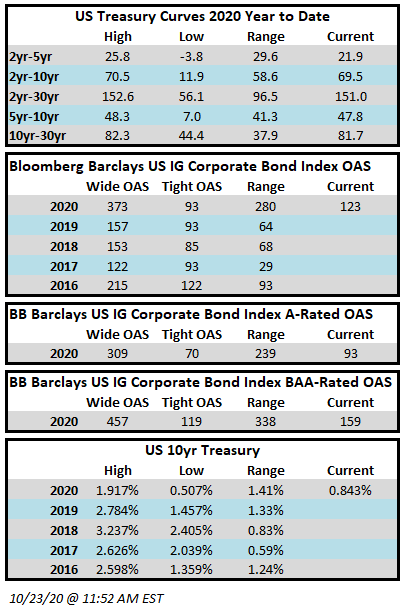
Author: Josh Adams - Portfolio Manager

22 Mar 2019

CAM Investment Grade Weekly Insights

CAM Investment Grade Weekly
03/22/2019

The investment grade credit markets closed at YTD tights on Thursday evening, riding a wave of strong sentiment from a surprisingly dovish Fed statement on Wednesday.  The story changed on Friday, however, with a decidedly softer tone fueled by concerns about the lack of growth globally.  Credit is mixed as we go to print on Friday with major stock indices firmly in the red on the day.  The 10yr Treasury will finish the week almost 10 basis points lower than where it started, which will likely mark a YTD low for the benchmark rate.  After peaking at 3.24% in November of 2018, the 10yr has now completely retraced its steps to 2.43%, which is almost exactly where it opened in 2018.  The extreme volatility that we have seen in rates over the past six months offers us a reminder of just how difficult it can be to accurately predict interest rate moves and this unpredictability is the reason that we at CAM focus on credit risk and the intermediate portion of the yield curve as opposed to trying to predict where rates will go next by making duration bets.

It was another solid week of issuance for corporate bowers, as companies brought $21.55bln in new corporate debt during the week.  $88.125bln of debt has been priced in the month of March and the year-to-date tally of new issuance is $292.298bln according to data compiled by Bloomberg.  The pace of 2019 IG issuance is trailing 2018 by 9%.

According to Wells Fargo, IG fund flows during the week of March 14-March 20 were +$4.5 billion. This brings YTD IG fund flows to +$62.222bln.  2019 flows to this juncture are up 2.43% relative to 2018.

15 Mar 2019

CAM Investment Grade Weekly Insights

CAM Investment Grade Weekly
03/15/2019

The investment grade credit markets look to finish the week marginally tighter.  After opening the week at 123, the OAS on the corporate index closed on Thursday at 121, near the YTD low of 120.  The 10yr Treasury is 4 basis points lower on the week as we go to print and it is 15 basis points lower than where it closed on the first trading day of March.


It was yet another solid week of issuance as IG firms issued just over $25bln in new corporate debt during the week.  New issue concessions remain razor thin and in some cases turned negative as investors “pay up” for the liquidity that it is afforded by the availability of new debt.  At the midpoint of the month, $64bln in new debt has been issued which brings the YTD tally to $268.498bln according to data compiled by Bloomberg.

According to Wells Fargo, IG fund flows during the week of March 7-March 13 were +$4.9 billion. This brings YTD IG fund flows to +$49.968bln.  2019 flows to this juncture are up 1.39% relative to 2018.

(WSJ) $10 Billion Corporate Debt Sale Highlights Credit Market’s Recovery

  • The world’s largest maker of automotive batteries is set to sell more than $10 billion worth of speculative-grade debt Friday to fund its purchase by an investor-group led by Brookfield Business Partners LP, underscoring the recent resurgence in demand for low-rated bonds and loans.
  • Power Solutions, the automotive-battery business currently owned by Johnson Controls International, is poised to sell roughly $3.7 billion worth of secured and unsecured bonds, denominated in both dollars and euros, along with around $6.5 billion in loans, also split between euro and U.S. dollar tranches.
  • The long-anticipated sale is on track to be relatively easy for a large group of underwriting banks, as investors have eagerly embraced what many see as a stable business that is able to shoulder the large amount of debt being placed on it.
  • The expected completion of the Power Solutions deal is a testament to the improved tone in high-yield debt markets, several investors said. Though fears of an economic slowdown led to a sharp decline in bond and loan sales in the final months of 2018, issuance picked up in the middle of January and has been fairly steady since then.
  • Through Wednesday, businesses had sold a total of $106.9 billion of speculative-grade bonds and loans this year, according to LCD, a unit of S&P Global Market Intelligence. That is down from $162 billion in the same period last year.
  • Some investors cautioned that the likely success of the Power Solutions deal doesn’t necessarily mean other businesses will find it as easy to sell such a large amount of debt in the current market. Even using conservative assumptions, analysts expect the company should be able to generate ample free cash flow in the coming years. Its secured bonds and loans, in particular, appealed to investors who have been eager to buy debt at the higher end of the speculative-grade ratings scale.
  • Not everything about the deal pleased investors. Prospective buyers were able to make some changes to the package of investor protections, known as covenants, an unusual outcome for such an in-demand deal. Yet the result, some said, still gives the company’s owners plenty of room to pay themselves dividends and remove collateral from the business, in keeping with the long-term trend toward weaker covenants.


(Bloomberg) U.S. Junk Bonds May Be Signaling That It’s Time to Be Cautious

  • There are early signs that it’s time to be cautious now in U.S. junk bonds.
  • Investors seem reluctant to buy the weakest high-yield corporate securities, a potential signal of trouble ahead, according to Citigroup Inc. strategists. Ratings firms are downgrading speculative-grade companies at the fastest rate relative to upgrades since the start of 2016, according to data compiled by Bloomberg. And to sell their bonds, a handful of issuers including Scientific Games International Inc. have had to pay higher yields this month than dealers had expected.
  • For now, many investors are shrugging off those concerns. Junk bonds have reached record highs this year and are the best performing U.S. fixed-income sector, gaining more than 6.4 percent through Wednesday. A Bank of America Corp. survey of U.S. credit-fund managers found the lowest level of alarm about high-yield and investment-grade corporate bonds since 2014.
  • A handful of companies including Arrow Bidco LLC and Community Health Systems Inc. are feeling the impact of those concerns. The borrowers had to pay more than dealers expected to entice investors to buy bonds in recent weeks.
  • There are other reasons for investors to be cautious now. Economists surveyed by Bloomberg expect growth to slow in the U.S. over the next three years. U.S. corporate earnings growth could come under pressure as tax benefits subside, which should reset junk bond prices and generate “meaningful” negative excess returns in the coming weeks and months, Bank of America said. Corporate bankruptcy filings in the U.S. have jumped, according to a Bloomberg index.
  • Warning signs aren’t limited to the U.S. The European Central Bank has slashed its economic expansion forecasts for the region, China has lowered its goal for economic growth, and an increasing number of corporate borrowers there are struggling to repay debt obligations.
  • There are still positives for corporate-debt investors. More companies have been getting upgraded to investment grade than getting cut to junk, a trend that’s expected to continue this year, according to Barclays Plc strategists led by Bradley Rogoff. The highest ratings tier now makes up almost 46 percent of the overall junk market, near an all-time high. The size of the junk bond market has been shrinking for more than a year, in part because companies have borrowed more in the loan market, making the securities scarcer. And default rates remain low, although they are rising.


01 Mar 2019

CAM Investment Grade Weekly Insights

CAM Investment Grade Weekly
03/01/2019

The investment grade credit markets are barreling toward year-to-date tights as the week comes to a close.  The OAS on the corporate index closed at 121 at the end of February, which marks a new low for spreads in 2019.  Risk assets continue to perform well even as Treasuries have inched higher.  The 10yr Treasury is 9 basis points higher as we go to print and sits just a few basis points lower than the 2019 high water mark.

In what seems to be a recurring them, it was yet another solid week of issuance as companies raised nearly $25bln in new debt during the last week of the month.  Concessions on new issuance remain thin as most order books are well oversubscribed to the tune of 3-5x deal sizes.  $98.21bln of new corporate debt was priced during the month of February, bringing the YTD total to $202.573bln.

According to Wells Fargo, IG fund flows during the week of February 21-February 27 were +$5.6 billion. This brings YTD IG fund flows to +$35.345bln.  Flows at this point in the year are modestly outpacing 2018 numbers.


22 Feb 2019

CAM Investment Grade Weekly Insights

CAM Investment Grade Weekly
02/22/2019

The investment grade credit markets look to end the week on a positive tone, but spreads are largely unchanged for the third consecutive week.  The OAS on the index closed at 125 on February 4th and has traded within just a 2 basis point range since then and most of that time was spent within a 1 basis point range.  The OAS on the index was 125 at the market close on February 21st and we remain wrapped around that number as we go to print this morning.


It was another solid week of issuance as companies raised over $25bln in new debt during the holiday shortened week.  Investor demand for new deals remains very strong and concessions on new debt have continued to grind lower.  As far as basis points go, mid-single digit new issue concessions are the name of the game in the current environment.  Over $73bln in new bonds has come to market in February and the YTD total is now $178bln.

According to Wells Fargo, IG fund flows during the week of February 14-February 20 were +$1.6 billion. This is a more modest pace of flows compared to prior weeks and it brings YTD IG fund flows to +$30bln.  Flows at this point in the year are modestly outpacing 2018 numbers by the tune of 2%.

A Blurb about BBB’s – CAM is significantly structurally underweight and quite cautious when it comes to BBB credit.  However, we can pick and choose the credits that we would like to own so we are not nearly as worried as some market commentators and those in the financial press seem to be with regard to the growth of the BBB portion of the index.  Here are a few interesting recent developments that show that not all the growth in BBB credit should be viewed as negative and that there are some very large BBB-rated issuers who may become A-rated in the near term.

  • HCA 1st lien debt was upgraded to investment grade by Moody’s in January. HCA was previously the single largest issuer in the high yield index.  As a result of receiving its second BBB-rating, $13.2bln of HCA debt moved from junk to investment grade with low-BBB ratings.
  • Also in January, payment processor Fiserv, Inc. announced that it would be acquiring First Data. Junk rated First Data is one of the 50 largest issuers in the high yield index.  The deal is structured in a manner so that Fiserv will retain its mid-BBB investment grade ratings.  Fiserv plans to re-finance $5.31bln of junk rated debt – and the new debt will be BBB rated.  The NewCo will have more BBB debt, but it is largely the result of refinancing junk rated debt while creating a larger company with more scale, better growth prospects and greater free cash flow generation.
  • On February 21st, Verizon held an investor day. Verizon has been actively paying down debt in recent quarters and its CFO highlighted this when talking about its capital allocation plans.

    “Our long-term leverage target is to have net unsecured debt to adjusted EBITDA between 1.75 and 2.0….This metric improved by 0.3 times last year to 2.1. …. And we believe this target is consistent with a low-single-A credit profile.”

Verizon already has an A- rating at Fitch and it is high-BBB at both Moody’s and S&P so it needs only one of them to upgrade it to single-A before it is “officially” an A-rated credit.  An upgrade is a distinct possibility if the company remains on a deleveraging path.  Verizon is the second largest BBB-rated bond issuer in the corporate index and an upgrade would result in over $73bln of index eligible debt leaving the BBB-rated portion of the index and entering the A-rated portion.

Bottom line, headlines about BBB-rated credit are just that –to get the real story one must dig into the details.

(Bloomberg) ‘Disastrous’ Kraft Heinz Quarter Foments Street Doubt on M&A

  • CAM NOTE: This is yet another example of a highly levered BBB-rated company impairing shareholders in order to pay down debt. It is our view that equity holders are the ones most at risk when it comes to BBB-rated credit, as bond holders have priority in the capital structure waterfall.  CAM has no exposure to Kraft Heinz.
  • Kraft Heinz Co.’s “disastrous” earnings announcement prompted analysts to question the packaged-food giant’s growth prospects and its capacity to move ahead with plans for a significant acquisition.
  • The shares plummeted as much as 28 percent to $34.70. Kraft’s plunge erased about $16 billion in market value. For perspective, that’s more than the entire value of packaged-food peers JM Smucker Co. or Campbell Soup Co.
  • Analysts at Goldman Sachs, Barclays, JPMorgan, Stifel, Piper Jaffray, Barclays and UBS cut their ratings on the stock following what Stifel described as a “barrage of bad news:” Quarterly profit missed estimates, the outlook for 2019 was disappointing, and Kraft Heinz cut its dividend, lowered profit-margin expectations and took a $15.4 billion writedown on key brands.
  • “The dividend cut and the margin rebase reflect serious balance sheet concerns,” Robert Moskow, an analyst at Credit Suisse AG, wrote in a note detailing his decision to slash his price target to a street-low of $33 from $42. The update “also pokes an enormous hole in management’s contention that it can execute a meaningful acquisition any time soon.”


15 Feb 2019

CAM Investment Grade Weekly Insights

CAM Investment Grade Weekly
02/15/2019

Investment grade spreads tightened modestly throughout the first half of the week before a deluge of new issue supply led the market to take a breather on Thursday.  While the tone is positive on Friday morning, the corporate index looks like it will finished the week relatively close to unchanged.


The real story this week was the aforementioned new issue supply.  Over $38bln of new debt priced in just three trading days, through Wednesday while no deals priced on Thursday or Friday.  Altria led the way this week as it priced $11.5bln on Tuesday and then AT&T came with $5bln on Wednesday.  3M Co, Goldman Sachs, Boeing and Tyson Foods were among the other companies that printed multi-billion dollar deals during the week.

According to Wells Fargo, IG fund flows during the week of February 7-February 13 were +$2.9 billion. This brings YTD fund flows to +$13.312bln.

As far as new supply is concerned, monthly volume projections for February are still calling for ~$90bln of issuance during the month.  As we roll past the mid-month mark, we have seen just over $48bln in new supply.

08 Feb 2019

CAM Investment Grade Weekly Insights

CAM Investment Grade Weekly
02/08/2019

It was a mixed week for Investment Grade Credit. The spread on the Corporate Index marched tighter on Monday and Tuesday before closing wider on both Wednesday and Thursday. The wider close on Wednesday snapped a remarkable streak of 22 straight trading days where the index closed tighter than the prior day. Still, even with two days of slightly wider spreads, the index remains one basis point tighter than where it opened the week and investor sentiment in the corporate credit space remains strong.

The market tone to start the day on Friday is, like the two prior days, somewhat softer. All told, we view this as healthy after the unabated “student body left” tightening that we experienced for 3+ weeks. Ebbs and flows in the market tend to create opportunities for patient investors with longer time horizons.

According to Wells Fargo, IG fund flows during the week of January 31-February 6 were +$5.9 billion. This was the largest inflow since October 2017 according to the data that is tracked by Wells Fargo, bringing YTD fund flows to +$10.759bln.

Issuance slowed this week compared to last, as $10.350bln in new corporate bonds were priced, bringing the year-to-date total to $114.713bln. Monthly volume projections for February are calling for ~$90bln of issuance during the month, according to data compiled by Bloomberg. New issue concessions continue to hover in the low single digits as investor demand for new issues remains robust.


(Bloomberg) Greed Is Back as Debt Markets Face an $8.6 Trillion Hangover

  • Prayers for a sudden return to dovish monetary policies have been answered, and now investors are living with the aftermath: a world awash with $8.6 trillion in negative-yielding debt.
  • That’s one reason money managers are wading once more into the fringes of fixed-income markets across the globe.
  • Consider the action over the past week: Serial defaulter Ecuador managed to sell $1 billion in new bonds even as the government is in talks for International Monetary Fund financing. Crisis-prone Greece received blockbuster orders for its 2.5 billion-euro ($2.9 billion) sale. And the decidedly frontier republic of Uzbekistan, encouraged by risk-on markets, is meeting investors for a debut international offering.
  • No wonder the world’s largest funds are betting the explosive rally in developing-economy debt still has legs.
  • Meanwhile, U.S. high-yield is in the throes of a rebound, as traders bet easier monetary policy will prolong the business cycle. Lower-rated borrowers are in vogue after the asset class posted the biggest monthly gain in seven years.


(WSJ) The Bond and Stock Markets Need to Talk

  • Investors buying bonds should start checking what their colleagues in the stock market are doing.
  • Yields on 10-year U.S. government bonds hover below 2.7%. This is extremely low considering that sovereign debt tracks where the central bank is expected to set interest rates—which the Federal Reserve now pegs between 2.25% and 2.5%—plus a premium for locking up the money long term.
  • The Treasury yield is even more strikingly at odds with the S&P 500, which has climbed back from its December lows during the fourth-quarter earnings season. The technology-heavy Nasdaq is even close to exiting its recent bear market.
  • In the U.S., it is likely bond investors who have got too pessimistic: Derivatives markets price in a 98% chance that interest rates will be at their current level or lower in a year’s time, according to CME Group. Only three months ago, they predicted that the Fed would tighten policy at least twice this year.
  • One possibility is that the legendary pessimism of fixed-income investors is correct and stocks are treading on perilous ground because the U.S. economy is in worse shape than it looks.
  • Yet if January’s improvement in economic data is pointing in the right direction, writing off rate rises with such certainty is perilous. Fed chairman Jerome Powell’s transformation from hawk to dove in January is likely explained—at least in part—by the equity rout late in 2018. If stocks keep rallying, he may very well nudge rates up again at least once.
  • European stock investors, by contrast, should heed the advice of the bond market: The region’s equities have slightly outperformed U.S. ones in recent months, glossing over Europe’s greater vulnerability to the Chinese slowdown. And with rates already at record lows, the European Central Bank has little ammunition left.
  • Treasurys aren’t in for a dramatic selloff, because inflation is being kept in long-term check by weak labor bargaining power. However, investors’ confidence that the Fed will sit on its hands for a full year looks misplaced.


31 Jan 2019

CAM INVESTMENT GRADE WEEKLY INSIGHTS

It was another strong week for IG credit. The OAS on the Bloomberg Barclays Corporate Index opened the week at 147 and tightened to 143 through the close on Thursday evening. The tone remains positive in the market this Friday morning as the 2019 risk rally continues. The OAS on the index finished 2018 at 153 and closed as wide as 157 on January 3rd, during the first holiday shortened week of 2019. Since January 3rd, the spread on the corporate index has closed tighter 8 of the last 10 trading days, moving from 157 to 143. For historical context, the three and five year average OAS for the index is 124 and 126, respectively, while the average since OAS since 1988 inception is 134.

According to Wells Fargo, IG fund flows during the week of January 10-January 16 were +$547mm. Per Wells data, YTD fund flows stand at +$2.7 billion. To recap 2018’s action, flows during the month of December were the second largest notional outflow on record at -$26bln and the largest since June of 2013 when -$27.4bln flowed from IG funds.

The primary market is alive and well, as $25.65bln in corporate bonds were printed during the week. According to data compiled by Bloomberg, borrowers are paying less than 5bps in new issue concession, down from as much as 25bps at the beginning of the year. Narrowing concessions support the thesis that the market is wide open and investor demand is robust. Corporate issuance in the month of January has now topped $77bln.

29 Jan 2019

Q4 2018 Investment Grade Commentary

The final quarter of 2018 was extremely volatile, and no asset class was spared, whether it was corporate credit, Treasuries, commodities or equities. The spread on the corporate index finished the quarter a whopping 47 basis points wider, having opened the quarter at 106 before finishing at 153, the widest level of 2018. Treasury bonds were one of the few positive performing asset classes during the fourth quarter as the 10-year Treasury started the quarter at 3.06%, before finishing the year substantially lower, at 2.69%. The 10-year began 2018 at 2.41%, and it rose as high as 3.24% on November 8, before dropping 58 basis points during the last 8 weeks of the year. On the commodity front, West Texas Crude peaked at $76.41 on October 3, before it endured an elevator-like collapse to $45.41, a 40% move in less than a full quarter. Equities also suffered in the final quarter of 2018. The S&P500 was flirting with year-to-date highs at the beginning of the fourth quarter before losing more than 13.5% of its value in the last quarter of the year. All told, the S&P500 finished the year in the red, with a total return of -4.4%.

2018 was the worst year for corporate credit since 2008, when the corporate index returned -4.94%. For the fourth quarter, the Bloomberg Barclays Corporate Index posted a total return of -0.18%. This compares to CAM’s quarterly gross total return of +0.71%. For the full year 2018, the corporate index total return was -2.51% while CAM’s gross return was -1.44%. CAM outperformed the corporate index for the full year due in part to our cautious stance toward BBB-rated credit and due to our duration, which is shorter relative to the index. BBB-rated credit underperformed A-rated credit in 2018. In late January and early February, the spread between the A-rated portion of the index and the BBB portion was just 43 basis points, but that spread continued to widen throughout the year and especially late in the year. The spread between A-rated and BBB-rated finished the year at 79 basis points as lower rated credit performed especially bad on a relative basis amidst the heightened volatility of year end.

Revisiting BBB Credit, again…

We have written much about the growth in BBB credit and our structural underweight relative to the index. CAM seeks to cap its exposure to BBB-rated credit at 30% while the index was 51.21% BBB at year end 2018. Our underweight is born out of the fact that we are looking to 1.) Position the portfolio in a more conservative manner that targets a high credit quality with at least an A3/A- rating and 2.) While it is our long-established style to position the portfolio conservatively, we do not believe there are currently enough attractive opportunities within the BBB universe that would even warrant a consideration for increased exposure to BBB credit.

The BBB growth storyline has received tremendous focus from the mainstream financial press in recent months. Hardly a day goes by without multiple stories or quips from market commentators. Some have gone as far as to predict that the growth in lower quality investment grade bonds will “trigger the next financial crisis”i or that it is akin to “subprime mortgages in 2007.”ii While we at CAM are extremely cautious with regard to lower quality credit, these statements and headlines are hyperbole in our view. We welcome the increased attention on the bond market from the financial press as we often feel like our market is ignored despite the fact that the total value of outstanding bonds in the U.S. at the end of 2017 was $37.1 trillion while the U.S. domestic equity market capitalization was smaller, at $32.1 trillion. iii What the press and pundits are missing is that, if BBB credit truly hits the skids, it has the potential to be far more damaging to equity holders than it does to bondholders. A few of the reasons an investor may own investment grade corporate bonds as part of their overall asset allocation are for preservation of capital, income generation and most importantly, for diversification away from riskier assets, primarily equities. High quality investment grade corporate bonds are meant to be the ballast of a portfolio. Bondholders are ahead of equity holders and get paid first in the capital structure waterfall. Many BBB-rated companies pay dividends or spend some of their cash flow from operations on share repurchases. Equity holders of these companies should be aware that dividends and share buybacks are levers that can be pulled if necessary in order to pay off debt that the company borrowed from bond holders. To that end, the following chart shows the 10 largest BBB-rated corporate bond issuers in The Bloomberg Barclays U.S. Corporate Index. We calculated how much each of these companies has spent on dividends and share repurchases during the last 12 months through 09/30/2018. If any of these companies were to endure financial stress (and some already are under stress) then we would expect that the majority, if not all of the funds that were previously allocated to dividends and share repurchases would instead be diverted to debt repayment.

CAM currently has exposure to just three of these ten largest BBB issuers. As an active manager that is not beholden to an index, CAM can pick and choose which credits it adds to its portfolio based on risk/reward and valuation relative to credit metrics.

Here are a few examples of how the bondholders of some of these companies were given priority over equity holders in 2018:

•Anheuser-Busch InBev reported disappointing third quarter results that showed a lack of progress in deleveraging the balance sheet stemming from its 2016 acquisition of SAB Miller. In conjunction with its lackluster earnings print, management slashed the dividend by 50% in order to divert more funds toward debt repayment. Anheuser-Busch InBev stock traded off sharply on the news and the stock posted a price change of -38.04% in 2018. Comparatively, one of the most actively traded bonds in the capital structure, ABIBB 3.65% 02/01/2026, posted a total return of -4.74% in 2018, per Bloomberg.

• CVS was once a prolific buyer of its own shares. The company bought back an average of $4bln per year of its own shares over the five year period from 2013-2017, but it did not buy back any shares in 2018. That is because CVS closed on the acquisition of Aetna in 2018, which required it to bring a $40 billion dollar bond deal in March; the largest deal of 2018 and the third largest bond deal of all time. In order to provide an incentive for bondholders to purchase its new debt offering, CVS had to promise that it would divert free cash flow to debt repayment in lieu of share repurchases. Although CVS stock underperformed the S&P500 by more than 3% in 2018, this example is not one of a company that is undergoing stress but a very typical example of a company which undergoes transformational M&A and pauses shareholder rewards in order to repair the balance sheet. Bondholders would have demanded much more compensation from CVS’s new debt deal if it did not halt its share buybacks.

• General Electric’s issues are well publicized and yet another example of cash being diverted toward debt repayment. First, the company slashed its dividend by 50% in November 2017, moving it from $0.24 to $0.12 per share. The second cut came in October 2018, as GE all but eliminated the dividend, moving it to a mere penny per share. GE intermediate bonds, specifically the GE 4.65% 10/17/2021, were performing extremely poorly until mid-November but then they rebounded in price on news of GE’s commitment to debt repayment. The bonds ended the year with a total return of -2.34% per Bloomberg, but this pales in comparison to the performance of GE equity, which finished the year down -56.62%.

The purpose of these examples is not to make the case for bonds over stocks, but to illustrate that BBB-rated companies have levers to pull in order to assist in the repayment of debt. In times of stress, shareholder rewards are typically the first things to go so that cash flow can then be diverted to balance sheet repair. At CAM we feel that an actively managed bond portfolio that picks and chooses BBB credit in a prudent manner can navigate potential landmines in lower quality credit and can selectively choose BBB-rated issues which can aid in outperformance.

As we look toward 2019, we expect continued volatility, especially in lower quality credit, but we think that our portfolio is well positioned due to its high quality bias. Two of our top macroeconomic concerns are Fed policy and the continued economic impact of global trade wars. As far as the Federal Reserve is concerned, it just completed the fourth rate hike of 2018 and the 9th of this tightening cycle. FOMC projections were updated at the December meeting and now show two rate hikes in 2019 and one more after that in 2020 or 2021. This suggests that we are nearing the end of this tightening cycle. What concerns us is that European and Chinese growth are both slowing, and if the U.S. economy slows as well we could see a situation where we have a domestic U.S. economy that is not supportive of further hikes. In other words, there is a risk that the Fed goes too far in its quest to tighten, bringing about a recession, which is negative for risk assets. Corporate bonds in general are more attractive today than their recent historical averages. The spread on the corporate index finished the year at 153, while the three and five year averages were 124 and 125 respectively. Going back to 1988, which was index inception, the average spread on the index was 133. New issue supply could play an outsized role in the spread performance of corporates in 2019. 2018 new issue supply was down 10.7% from 2017 and most investment banks are calling for a further decrease of 5-10% in new issue volume in 2019.iv If this decrease in issuance comes to fruition but is coincident with good demand for IG credit then we could find ourselves in a situation where there is not enough new issue supply to satiate credit investors, which would make for an environment that is very supportive of spreads. In what seems to be a recurring theme in our commentaries, caution will continue to rule day for our portfolio as we head into 2019. We will continue to prudently manage risk within our portfolios and strive for outperformance but not at the sake of taking undue chances by reaching for yield.

We wish you a happy and prosperous new year and we thank you for your business and continued interest.

This information is intended solely to report on investment strategies identified by Cincinnati Asset Management. Opinions and estimates offered constitute our judgment and are subject to change without notice, as are statements of financial market trends, which are based on current market conditions. This material is not intended as an offer or solicitation to buy, hold or sell any financial instrument. Fixed income securities may be sensitive to prevailing interest rates. When rates rise the value generally declines. Past performance is not a guarantee of future results. Gross of advisory fee performance does not reflect the deduction of investment advisory fees. Our advisory fees are disclosed in Form ADV Part 2A. Accounts managed through brokerage firm programs usually will include additional fees. Returns are calculated monthly in U.S. dollars and include reinvestment of dividends and interest. The index is unmanaged and does not take into account fees, expenses, and transaction costs. It is shown for comparative purposes and is based on information generally available to the public from sources believed to be reliable. No representation is made to its accuracy or completeness.

i USA Today, September 14, 2018, “Ten year after financial crisis: Is corporate debt the next bubble?”

ii DiMartino, Danielle (DiMartinoBooth). “A lot of BBB is toxic. I am watching this more closely than anything. You must put “investment grade” in quotes. This is the sector that has grown to be a $3 trillion monster. Where’s the parallel? Subprime mortgages circa 2007.” November 29, 2018, 9:00 AM. Tweet.

iii SIFMA. September 6, 2018. “SIFMA U.S. Capital Markets Deck.”

iv Bloomberg, January 2, 2019, “High-Grade Bond Sales Hurt by Repatriation, Higher Costs in 2018”

07 Dec 2018

CAM INVESTMENT GRADE WEEKLY INSIGHTS

It was another volatile week in the credit markets with wider spreads and lower rates. Through the close on Thursday evening, the Bloomberg Barclays Corporate Index was 8 basis points wider on the week while the 10yr Treasury is 9 basis points lower on the week as we go to print on Friday morning. The corporate index has now reached its widest levels year to date and is trading at an OAS of 145, its widest level since August of 2016. To put this into perspective, the index has had an average OAS of 108 over the past 12 months and 125 over the past 5 years. The long term average OAS is 133 dating back to 1988.

According to Wells Fargo, IG fund flows during the week of November 29-December 5 were +$0.5 billion. Per Wells data, YTD fund flows are +$82.665bln.

Investment grade borrowers printed a mere $4bln during a week where spreads inched wider day by day. The credit markets were also closed on Wednesday as a national day of mourning for formal President George H.W. Bush. According to Bloomberg, YTD corporate issuance has been $1.070 trillion.  Issuance is now down 11% YTD when compared to 2017 numbers.

30 Nov 2018

CAM INVESTMENT GRADE WEEKLY INSIGHTS

Credit markets are struggling to find footing, as the Bloomberg Barclays Corporate Bond Index opened Friday at an OAS of 135 which is the widest level of 2018. Investment grade credit has drifted wider since November 8, when the index closed at an OAS of 113. The move wider in credit over that timeframe has almost entirely been offset by rates, at least for the intermediate portion of the curve, as the 10yr Treasury has moved from 3.23% to 3.01%. Note that the front end of the yield curve has flattened substantially during the month of November and the spread between the 2yr and 5yr Treasury is down to a mere 3.3 basis points as we go to print. The investment grade corporate bond market currently has little appetite for idiosyncratic risk and we are seeing that reflected in the spreads of bonds for companies under duress, like General Electric, which continues to trade wider, seemingly day after day. BBB credit too has underperformed relative to single-A credit. Since November 8, the Corporate Index is 22 wider, while the BBB-rated portion of the index is 28 wider. The A-rated portion of the index has outperformed over that time period, having moved 17 wider.

According to Wells Fargo, IG fund flows during the week of November 22-November 28 were -$3.2 billion, which was the second largest outflow YTD. Per Wells data, YTD fund flows are +$82.148bln.

The IG primary market was fairly active this week and the primary market remains open to issuers of all stripes even in the face of widening spreads. According to Bloomberg, new corporate issuance on the week was $30.325bln while issuance for the month of November topped $84bln. YTD corporate issuance has been $1.066 trillion.


(WSJ) Bond Indexes Bend Under Weight of Treasury Debt

  • The surge in U.S. government borrowing is beginning to warp bond indexes, posing a challenge for investors looking for the best returns when interest rates are rising.
  • The problem: Treasurys tend to offer investors lower yields and produce weaker returns than other kinds of bonds, such as high-quality company debt or securities backed by mortgage payments. Yet as the government steps up borrowing to fund last year’s tax cuts, index funds end up holding more Treasurys, squeezing out the securities that pay higher rates of interest.
  • The U.S. government is borrowing $129 billion this week, up 28% from the same series of note auctions a year ago. The increased borrowing means Treasurys now amount to almost 40% of the value in the leading bond market investment benchmark—the Bloomberg Barclays U.S. aggregate index—which fund managers use to gauge their success. That is up from around 20% in 2006, before the start of the financial crisis.
  • Some analysts said investors should consider the growing weight of Treasurys in indexes before purchasing mutual funds. Actively managed bond funds have performed better than their index-tracking peers recently, a trend some analysts credit to their efforts to pare back Treasury holdings. Rising rates erode the value of outstanding bonds, because newly issued debt offers higher payouts. And Federal Reserve officials have penciled in additional increases into 2020.
  • “The value from active management is going to be more important,” said Kathleen Gaffney, director of diversified fixed income at Eaton Vance , who bought dollar-denominated corporate bonds in emerging markets because U.S. corporate yields remain low by historic measures. “You’re not going to want market risk.”
  • Through the first six months of this year, active managers topped indexes in five of 14 categories including municipal bonds and short- and intermediate taxable bonds, according to data from S&P Dow Jones Indices. That is coming off a 2017 in which actively managed funds had their best year since 2012, when active managers beat passive funds in nine of 13 categories the firm then measured.
  • Should yields continue to rise, advocates of active portfolio management say investors would be better served by a human being shielding them from the parts of the bond market most likely to suffer losses versus an index which includes all bonds, without regard to their potential risks. “Most of the stuff I own’s probably not in the agg,” said Jerry Paul, who has recently purchased preferred stocks for his ICON Flexible Bond Fund, which has returned 0.3% this year, beating the Bloomberg Barclays index.
  • Many expect to persist. The Treasury Department projected to run trillion-dollar deficits for the foreseeable future. As issuance increases, funds that use the Bloomberg Barclays aggregate index as a guidepost for portfolio composition will wind up owning increasingly large amounts of Treasury debt. Independent bond analyst David Ader predicts Treasurys will make up half of the U.S. bond market and the indexes that track it by 2028.
  • Still, because many individuals invest in bond funds to protect against losses in their stock portfolios, there are advantages to indexes that reflect the constituency of bond market borrowers instead of optimizing returns, said Josh Barrickman, who manages Vanguard Group’s bond index fund. While corporate bonds, for example, offer higher yields than Treasurys, U.S. government debt tends to post high returns during periods when investors shun risk, he said.
  • The changing composition of bond market indexes can exert a powerful force over what resides within their bond mutual funds without their becoming aware of it, according to fund managers and analysts. Treasury Department data shows that the category of investors that represents mutual funds bought about one half of the $2 trillion of U.S. government notes and bonds sold at auction last year. That is up from about one-fifth of the $2.2 trillion sold in 2010.
  • As the supply of Treasury debt rises, the government will have to spend more to pay interest. Some investors say the rising supply of bonds has also helped push yields higher, which can pressure stocks by offering investors a way to get more yield with less risk.
  • “It’s going to reflect itself as a drag on the economy and on potential equity market returns,” said Craig Bishop, a bond strategist with RBC Wealth Management.
  • Should slowing growth lead business conditions to worsen, corporations have the option of borrowing less. Not so the U.S. government. Because legally mandated spending on unemployment insurance and other safety net programs tends to rise when growth slows, wider budget deficits and more Treasury debt could ensue. That means many bond investors could face conditions where there is no alternative to holding a rising share of government debt.


(Bloomberg) Salesforce Soars as Management Mutes Market Skepticism


  • Salesforce.com Inc. rose as much as 9.5 percent Wednesday, the most since February 2016, after third-quarter sales and a top-line beat report muted some of Wall Street’s concerns about the broader demand environment. Several analysts raised their price target on the stock, including Alliance Bernstein, who believes the report should help lift software stocks. Meanwhile, Raymond James cut their bullish target as Salesforce.com shares “aren’t immune from broader macro trends.”


(Bloomberg) Ford Digs Further Out of Trump’s Doghouse as GM Takes Its Turn


  • Ford Motor Co. and General Motors Co. both need to overhaul their U.S. manufacturing base to cope with consumers’ drastic switch to SUVs from sedans. Only one is poised to make that adjustment without ticking off the president.
  • In a significant rework of its U.S. production plans, Ford will eliminate shifts at factories in Trump country. But it plans to retain all the 1,150 workers affected by shifting their jobs to Michigan and Kentucky plants making big SUVs or supplying transmissions to pickups. That’s fortunate not only for employees, but for Ford’s relations with a touchy White House.
  • GM, on the other hand, is caught with way too much capacity to make out-of-vogue sedans, so it has little choice but to go the more painful route of shuttering factories and firing workers. Inevitable or not, the decision has infuriated Donald Trump. He’s renewed a threat to slap auto imports with 25 percent tariffs and enlisted federal agencies to look for ways to cut the carmaker’s subsidies.
  • “Ford has been in Trump’s cross-hairs before, and this should help keep them out,” said Michelle Krebs, a senior analyst with researcher Autotrader. Ford “had their time in the barrel” in 2016, when Trump lambasted its plans to move small-car production to Mexico. The company abandoned that strategy last year and canceled a new car factory it was building there.