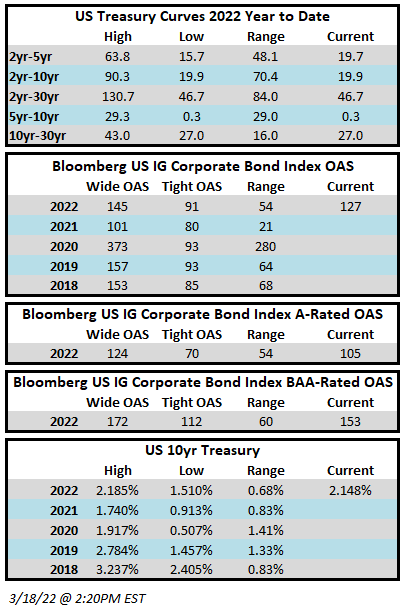
Author: Josh Adams - Portfolio Manager

18 Sep 2020

CAM Investment Grade Weekly Insights

Spreads are slightly tighter on the week.  The Bloomberg Barclays US Corporate Index closed on Thursday September 17 at 128 after closing the week prior at 130.  Spreads have traded in a very narrow range over the course of the last month, with the OAS on the index never closing wider than 131 or tighter than 126 since the week of August 17, with numerous ups and downs within that tight range. Through Thursday, the corporate index has posted a year-to-date total return of +7.43%.  The FOMC was on the tape Wednesday, signaling that rates will remain near zero through 2023, and there was little movement in Treasuries throughout the week.

The high grade primary market was active again, with $42bln in new debt issued, though this was down considerably versus the prior week.  Next week is expected to be slightly less busy, with syndicate supply forecasts weighing in at $30-$35bln.  The pace of issuance should continue to subside as we approach quarter end.

According to data compiled by Wells Fargo, inflows into investment grade credit for the week of September 10-16 were +$4.5bln which brings the year-to-date total to +$196bln.  This was the 23rd consecutive week of inflows into the investment grade corporate bond market.


11 Sep 2020

CAM Investment Grade Weekly Insights

Spreads were mixed during the holiday shortened week and look likely to finish close to unchanged or perhaps a touch wider after it is all said and done.  The Bloomberg Barclays US Corporate Index closed on Thursday September 10 at 131 after closing the week prior at 129.  The market has a firmer tone as we got to print on Friday morning, which is a day of remembrance for those that we lost on September 11, 2001.  Through Thursday, the corporate index has posted a year-to-date total return of +7.07% versus +4.74% for the S&P500.  Treasury yields fluctuated throughout the week and are looking to finish modestly lower versus the week prior.  Treasuries were not nearly as volatile as equity markets which saw a continuation of the tech-related whipsaw which developed in the latter half of last week.

To say that the high grade primary market was active this week would be an understatement, especially considering that Monday was a holiday.  Through Thursday 44 investment grade companies sold over $65 billion in new debt according to data compiled by Bloomberg.  This is a remarkably high total over the course of just 3 trading days.  Next week is expected to be busy as well with consensus estimates calling for $40bln in new supply.  It is a good time to be an issuer with attractive borrowing costs and robust demand.

According to data compiled by Wells Fargo, inflows for the week of September 3-9 were +$6.4bln which brings the year-to-date total to +$163bln.  This was the 22nd consecutive week of inflows into the investment grade corporate bond market.

21 Aug 2020

CAM Investment Grade Weekly Insights

Spreads are wider on the week.  The Bloomberg Barclays US Corporate Index closed on Thursday August 20 at 131 after closing the week of August 10-14 at 128.  The market has the feel of a quiet summer Friday as we go to print this morning.  Through Thursday, the corporate index has posted a year-to-date total return of +7.34%.  Treasury yields are lower this week after having trended higher each of the last two.

The high grade primary market was reasonably active again this week, especially for what is typically a seasonally slow time as issuers printed nearly $36bln in new debt.  Of note, the August all-time issuance record has already been broken with nearly $120bln in issuance month-to-date, according to data compiled by Bloomberg.  Consensus estimates are calling for ~$20bln in issuance next week.

According to data compiled by Wells Fargo, inflows for the week of August 13-19 were +$8.0bln which brings the year-to-date total to +$136bln.  This was the 20th consecutive week of inflows into the investment grade corporate bond market.

31 Jul 2020

CAM Investment Grade Weekly Insights

Spreads took a breather this week and may finish the week a touch wider when it is all said and done.  The Bloomberg Barclays US Corporate Index closed on Thursday July 31 at 133 after closing the week of July 20-24 at 131.  Through Thursday, the corporate index has posted a year-to-date total return of +8.35%.  Rates have continued to grind lower over the course of the past two weeks and the 10yr Treasury is flirting with its lowest levels of 2020.

The high grade primary market was more active this week as borrowers brought just over $25bln in new debt to market.  According to data compiled by Bloomberg, $64.4bln in new debt was priced during the month of July which was underwhelming versus consensus estimates of $90-$100bln.  The primary market should continue to pick up in subsequent weeks as companies continue to report earnings, exiting blackout periods.

According to data compiled by Wells Fargo, inflows for the week of July 23-29 were +$10bln which brings the year-to-date total to +$92.9bln.

24 Jul 2020

CAM Investment Grade Weekly Insights

Spreads look to finish the week tighter again as the grind lower continues.  The Bloomberg Barclays US Corporate Index closed on Thursday July 23 at 130 after closing the week of July 13-17 at 136.  The return on the corporate index keeps inching higher with a year-to-date total return of +8.28% through Thursday.  This week saw spreads move tighter throughout as we are now firmly in the midst of earnings season meaning supply has come to a standstill.  Additionally, dealer inventories are near historic lows which has made it a sellers’ market, with offerings few and far between.  Rates have continued to inch lower in recent weeks and the 10yr sits within 5 basis points of its year-to-date lows.

The high grade primary market was extremely quiet this week with just $6.6bln in new supply.  This is typical in the midst of summer and during earnings season but it is fair to say that it was even slower than expected given most dealer projections were pegging supply in the $15-$20bln range.  Issuance should be subdued again next week but could pick up in mid-August if the macro-tone remains friendly to issuers.

According to data compiled by Wells Fargo, inflows for the week of July 16-22 were +$11.1bln which brings the year-to-date total to +$82.7bln.


12 Jul 2020

2020 Q2 INVESTMENT GRADE COMMENTARY

What a difference a quarter makes. The investment grade credit market has experienced a reversal of fortune since the dark days of late March, with both spreads and returns rebounding smartly from the levels seen earlier this year.

The resumption of risk appetite led to a sharp tightening in spreads for the Bloomberg Barclays Corporate Index which closed the quarter 122 basis points tighter, moving to an OAS of 150 at the end of June versus 272 at the end of March. Spreads are still well off the lows that we saw in the first quarter of the year when the Corporate Index closed at 93 for several days in a row back in late January. Recall that tighter spreads lead to higher valuations for corporate bonds. Investment grade corporate bonds have also been a beneficiary of the increasing value of Treasuries as lower interest rates have provided a tailwind that has led to higher total returns for investment grade credit. The 10yr Treasury closed 2019 at 1.92%, 0.67% on March 31 and it saw little change in the second quarter, closing at 0.66% on June 30.

The reversal in returns is really something to behold, most especially the speed with which the move has occurred. The total return for the Bloomberg Barclays Corporate Index was as low as -10.58% on March 23, and since that time it has rallied all the way back, and then some, closing the second quarter at a year-to-date total return of +5.02%. This compares to CAM’s year-to-date gross total return of +4.89% for the Investment Grade Strategy. For context, the S&P 500 closed the second quarter with a year-to-date total return of -3.09%. CAM’s gross performance was 54 basis points better than the Corporate Index at the end of the first quarter but now trails the index by 13 basis points year-to-date. CAM’s modest under-performance year-to-date is largely a result of conservative positioning and our structural underweight to the lower rated BAA-portion of the investment grade universe. As is normally the case when markets snap back, the lower quality portion of the Corporate Index tends to outperform, so this caused CAM to give up some ground versus the benchmark.

Portfolio Construction in a Recession
The U.S. officially entered a recession in February according to the National Bureau of Economic Research.i So what does this mean for the way that we manage the portfolio? You may be surprised to find that our behavior has really only changed at the margins. Unlike an ETF or broad market mutual fund, we are looking to construct well diversified portfolios of individual bonds for our clients. Because we build separately managed accounts, our clients will know exactly what they own, in what quantity and its current valuation. No matter where we are in the economic cycle, we will always look to invest in companies that have the ability to manage through a downturn because past experience has taught us that there will always be a recession at some point, and usually when it is least expected. Cyclical sectors and industries tend to get hit the hardest in a recessionary environment and although we have some of this risk in the portfolio we are significantly underweight relative to the Corporate Index. And of course we always operate with a structural underweight on the lower echelon of riskier BAA-rated credit. If anything has changed with our behavior and thinking it is that we are cautious on businesses that have significant exposure to China as we believe that there is risk to U.S.-China trade that could manifest itself at any time.

What’s the Fed been up to?
The Federal Reserve has been quite active in its support of the corporate bond market. The Fed made its first foray into the market by dipping its toe into investment grade credit ETFs in mid-May and by mid-June the Fed had moved on to outright purchases of the individual bonds of 794 companies.ii What may prove to be interesting is where the Fed goes from here. When the original plans were announced on March 23, it was a bleak time for the capital markets. The credit markets were not functioning in a healthy manner and the fixed income ETF model had broken the very first time it faced stress. Since the Fed has made its announcement however, things have improved markedly and the market is back to behaving in a highly efficient manner.

The terms of the Fed’s current program allow it to purchase up to $250 billion of corporate debt on the secondary market. Per the most recent Fed release, it has just over $10bln in corporate bonds on its balance sheet, but the program expires on September 30, at which time the Fed will either hold the bonds it bought, allowing them to mature or it will sell them on the open market. At the current run rate of its purchases, the Fed will get nowhere close to $250 billion as the current rate implies less than $70bln in purchases per year. There are only 63 trading days between July 1 and the expiration date of the current program and it seems unlikely that the Fed’s pace of purchasing will accelerate to the point that it will be able to use almost $240bln of dry powder in just 63 trading days. So one of two things will happen: 1.) The Fed will continue to purchase bonds at its current run rate of less than $300 million per day which would put its balance sheet at approximately $29bln by September 30, less than 12% of its total $250bln capacity or 2.) The Fed will extend the expiration date of the program beyond September 30. We think that the second scenario seems the most likely and that the Fed may in fact not come anywhere close to approaching its $250bln capacity if it does not need to. If there is a spike in volatility then certainly the Fed can buy more but if things remain relatively calm, as they are now, then we believe that the Fed will continue to purchase bonds at or near the current run rate and it will reserve the right to purchase more beyond that only if it needs to do so in order to subdue fear within the markets. The market seems to be operating under the assumption that it is a foregone conclusion that the Fed will use the full amount of its facilities no matter what, but we simply disagree.

Keep on Rollin’
The new issue market has been highly topical this year as 2020 will assuredly smash the all-time issuance record which was $1.3 trillion in 2017. At quarter end, 2020 supply was running 98% ahead of 2019’s pace with $1,176.9bln in new corporate debt having been priced in the first half of the yeariii. So you may be wondering why are borrowers, in many cases extremely high quality ones with plenty of liquidity, rushing to borrow more debt? The answer really comes down to uncertainty. If the pandemic gets worse, if we don’t get a vaccine, if growth does not rebound as quickly as expected, these are all the types of questions that companies must ask themselves as they plan for the future. If a large global multinational can afford to borrow today at rates that are reasonably attractive relative to historical standards in order to shore up liquidity amid uncertainty then it is prudent to do so. As for opportunities in the new issue market, they still exist and we are still finding what we consider good value but the times of extraordinary opportunity that we saw in March and April are no longer with us for the time being. It could well be that those opportunities are, as we suspected at the time, the type that only come along once every decade or so.

Second Half Outlook
We believe valuations have recovered to the extent that pockets of volatility in the credit markets may now start to occur with more frequency. Immense demand has largely kept volatility at bay since the end of March, so that is really the wildcard. Individual credits will continue to trade choppy surrounding news on vaccines, virus case counts and the various failures and successes of “re-openings.” From a spread perspective, although spreads are significantly tighter from the widest levels, valuations are reasonably compelling. The spread on the index closed the quarter at an OAS of 150. This compares to the 5yr average of 131, the 10yr average of 141 and the average since 1988 inception of 134. We continue to find compelling opportunities in individual bonds through our bottom up research process.

The Federal Reserve has injected confidence into the fixed income markets. While the actions of the Fed were drastic and unprecedented they were also much needed. Words can hardly describe the extreme malaise that was occurring within the markets over the course of the trading days from March 9 through March 20, up until March 23, the day when the Fed announced its initial plans. A side effect of the confidence that the Fed instilled is that it has created an atmosphere of exuberance and has encouraged more risk taking by market participants. We are at odds with this feeling of euphoria as we believe that this is a great time to take less risk, not more. There are plenty of opportunities to take smart calculated risks by purchasing bonds of companies with solid balance sheets that can navigate an extended downturn in the economy. We have positioned the portfolio accordingly. Not only are we underweight BAA-rated credit but we are also underweight the energy sector and zero weight the leisure, gaming, lodging and restaurant industries, which are becoming correspondingly riskier by the day as the economic uncertainty wears on. We will continue to manage your capital in a prudent manner and we thank you for your continued interest and partnership.

This information is intended solely to report on investment strategies identified by Cincinnati Asset Management. Opinions and estimates offered constitute our judgment and are subject to change without notice, as are statements of financial market trends, which are based on current market conditions. This material is not intended as an offer or solicitation to buy, hold or sell any financial instrument. Fixed income securities may be sensitive to prevailing interest rates. When rates rise the value generally declines. Past performance is not a guarantee of future results. Gross of advisory fee performance does not reflect the deduction of investment advisory fees. Our advisory fees are disclosed in Form ADV Part 2A. Accounts managed through brokerage firm programs usually will include additional fees. Returns are calculated monthly in U.S. dollars and include reinvestment of dividends and interest. The index is unmanaged and does not take into account fees, expenses, and transaction costs. It is shown for comparative purposes and is based on information generally available to the public from sources believed to be reliable. No representation is made to its accuracy or completeness.

i The Wall Street Journal, June 8, 2020 “Recession in U.S. Began in February, Official Arbiter Says”
ii The Wall Street Journal, June 28, 2020 “Automakers, Technology Firms Are Largest Components of Fed’s Corporate-Bond Purchases”
iii Bloomberg, June 30, 2020 “IG ANALYSIS US: June Ends in Top 6 With July Bringing $100B More”

12 Jun 2020

CAM Investment Grade Weekly Insights

Spreads are set to finish the week wider, giving back some of the big move tighter from last week.  The Bloomberg Barclays US Corporate Index closed on Thursday June 11 at 161 after closing the week of June 5 at 146.  The corporate index was a beneficiary of lower Treasuries and the total return for the year through Thursday inched higher to +4.10%.  This week saw spreads move modestly tighter on Monday followed by moves wider on Tuesday and Wednesday followed by a violent move wider on Thursday.  The tone was more positive on Friday with spreads moving tighter, recouping some of the move wider from the prior three days.  Rates moved lower throughout the week to the tune of about 10 basis points versus the week prior which saw a close on the 10yr Treasury of 0.895% vs sub-0.70% as we go to print.

The primary market saw its slowest week since early March with just over $25bln in new corporate bond issuance.  The Fed meeting on Wednesday and market rout on Thursday were the one-two punch that kept issuers at bay.  Supply is expected to pick-up again next week with preliminary expectations calling for $40-$50 billion of supply according to data compiled by Bloomberg.

According to data compiled by Wells Fargo, inflows for the week of June 4-10 were +$13.6bln which brings the year-to-date total to -$-12.7bln.  This extends the 10-week streak of inflows to $89bln+ for investment grade funds.


29 May 2020

CAM Investment Grade Weekly Insights

Spreads moved significantly tighter throughout the week.  The Bloomberg Barclays US Corporate Index closed on Thursday May 28 at 175 after closing the week of May 22 at 185.  The corporate index total return for the year through Thursday was +2.54%.

The primary market was busy again but volume was lower for the second consecutive week.  This week saw over $38bln price in the primary market.    Corporate issuance has now passed the $1 trillion mark for 2020 and it has done so at its fastest pace ever.  New issue concessions have steadily declined in recent weeks and even turned negative for some deals in the latter half of this week.  Strong inflows into the IG markets are the driving factor behind narrowing (and negative) concessions.

According to data compiled by Wells Fargo, inflows for the week of May 21-27 were +$11.5bln which brings the year-to-date total to -$43.7bln.  This extends the 8-week steak of inflows to $55bln for investment grade funds.


22 May 2020

CAM Investment Grade Weekly Insights

Spreads moved significantly tighter throughout the week.  The Bloomberg Barclays US Corporate Index closed on Thursday May 21 at 187 after closing the week of May 15 at 208.  The corporate index total return for the year through Thursday was +2.15%.  The fixed income markets will close early on Friday ahead of the Memorial Day weekend and spreads are modestly wider as we go to print as it looks like the extended rally in credit might finally have an off day.

The primary market was busy again but volume was lower than the week prior.  It could well be that the early market close on Friday was the only thing that kept volumes lower on the week as we saw over $47bln of new debt price through Thursday with no issuers on the calendar for Friday morning.    Corporate issuance is closing in on the $1 trillion mark as nearly $970bln of corporate debt has been priced so far this year which is 90% ahead of 2019’s pace.  We are still finding attractive opportunities in the primary market but certainly fewer today than in the recent past.  According to data compiled by Bloomberg, concessions have trended downward over the last month with issuers averaging just over 5bps this week vs 11bps last week and 22bps the week prior.

According to data compiled by Wells Fargo, inflows for the week of May 14-20 were +$8.5bln which brings the year-to-date total to -$55.2bln.  This extends the 7-week steak of inflows to $43.5bln for investment grade funds.


15 May 2020

CAM Investment Grade Weekly Insights

Spreads moved tighter throughout the week.  The Bloomberg Barclays US Corporate Index closed the week of May 15 at an OAS of 208 after closing the prior week at 212.  Through Friday, the index total return for the year was +0.72%.

The primary market again remained en fuego as borrowers rushed to stock their coffers with liquidity.  Over $60 billion in new debt was priced this past week according to data compiled by Bloomberg.  So far more than $156 billion has priced during the month of May.  It seems that the Memorial Day Holiday is the only thing that can slow the pace of issuance at this point.

According to data compiled by Wells Fargo, inflows for the week of May 7-13 were +$6.2bln which brings the year-to-date total to -$74.6bln.  This extends the 6-week steak of inflows to $35bln for investment grade funds.