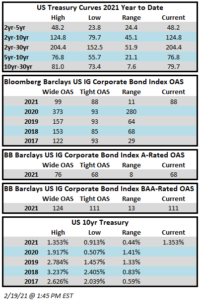
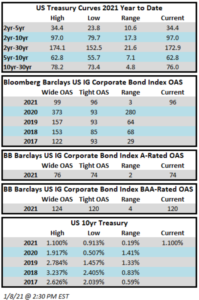
Author: Josh Adams - Portfolio Manager

05 Feb 2021

CAM Investment Grade Weekly Insights

Price action in the corporate bond market this week would best be described as “grabby” with spreads consistently grinding tighter throughout the week. Spreads were wider the week before last but they have since reclaimed that ground that was given up. The Bloomberg Barclays US Corporate Index closed on Thursday February 4 at 94 after closing the week prior at 97. Treasuries are higher across the board this week and curves are at their steepest levels of the year. The 10yr Treasury closed last week at 1.065% and it is 8 basis points higher as we go to print on this Friday morning. Through Thursday, the corporate index had posted a year-to-date total return of -1.61% and an excess return over the same time period of +0.27%.

The high grade primary market saw solid volumes during the week on the back of a jumbo $14bln print from Apple. Over $45bln priced during the week. Year-to-date issuance stands at $172.8 billion. Investor demand for new issuance remains quite strong as the U.S. corporate bond market is one of the last bastions for positive nominal yields globally.

According to data compiled by Wells Fargo, inflows into investment grade credit for the week of January 28-February 3 were +$7.9bln which brings the year-to-date total to +$37.9bln.


22 Jan 2021

CAM Investment Grade Weekly Insights

Spreads are looking likely to finish the holiday shortened week with little change.  The Bloomberg Barclays US Corporate Index closed on Thursday January 21 at 94 after closing the week prior at 94.  Treasuries have hardly moved this week and are currently less than 2 basis points lower since last Friday.  Through Thursday, the corporate index had posted a year-to-date total return of -1.22%.

The high grade primary market saw reasonable volume during the week that was right in line with concensus expectations.  Over $25bln priced during the week.  Year-to-date issuance stands at $100.3 billion.

According to data compiled by Wells Fargo, inflows into investment grade credit for the week of January 14-20 were +$7.7bln which brings the year-to-date total to +$22.7bln.


08 Jan 2021

Q4 2020 INVESTMENT GRADE COMMENTARY

Investment grade corporate bonds rode a roller coaster in 2020 so it should be no surprise that, after peaks and valleys, spreads finished the year nearly right where they started. The option adjusted spread (OAS) on the Bloomberg Barclays US Corporate Bond Index opened the year at 93, but soon thereafter, pandemic induced uncertainty gave way to panic stricken selling, sending the OAS on the index all the way out to 373 by the third week of March– its widest level since 2009, during the depths of The Great Recession. On March 23, the Federal Reserve announced extensive measures to support the economy and liquidity within the bond market and spreads reacted in kind, grinding tighter. There were pockets of volatility along the way, but absent a few hiccups it has been a one-way trade of tighter spreads since the end of March, with the OAS on the index finishing 2020 at 96; a mere 3 basis points wider on the year.

Lower Treasuries were the biggest driver of performance for credit during the year. The 10yr Treasury opened 2020 at 1.92% and closed as low as 0.51% at the beginning of August before finishing the year at 0.91%. The Corporate Index posted a total return of +3.05% during the fourth quarter and a full year total return of +9.89% for 2020. This compares to CAM’s gross quarterly total return of +1.86% and full year gross return of +8.73% for 2020.

2020 Investment Grade Returns – What Worked & What Didn’t?

The big winner in 2020 was duration, with lower rates leading to higher prices for bonds, all else being equal. Although the Corporate Index was up almost 10% for the year, excess returns, which measure the performance of corporate credit excluding the benefit of lower Treasury rates, were modest. The sectors that posted the best excess returns in 2020 were Basic Industry, Technology and Financials. At the sector level, Energy was the worst performer with an excess return of -5.97%, with particular underperformance for Independent Energy, which as an industry posted a 2020 excess return of -11.27%. Also at the industry level, Airlines predictably underperformed, with a 2020 excess return of -8.91%.

What to Expect in 2021?

With equity indices at all-time highs and yields on corporate bonds at all-time lows, where do we go from here? In our opinion, the theme for 2021 should be one of guarded optimism. Vaccinations have been approved and are being administered and there are more in the pipeline. Healthcare providers have become more adept at managing care and therapeutic treatments are more readily available. The policy response from the Federal Reserve has been strong and the Fed stands ready and willing to lend more support if it is needed.

As far as investment grade bonds are concerned, we expect a transition to occur as we enter 2021 and that the script will flip from 2020’s broad based risk rally to more of a credit pickers environment in 2021, where bottom up fundamentals become more important and investment managers must carefully evaluate the risks and potential rewards for each individual position within a portfolio. Credit spreads and Treasuries are beginning the year at levels that do not set-up well for the type of returns we experienced in 2019 and 2020, when the corporate index tallied gains of +14.54% and +9.89%, respectively. But outsize returns over short time horizons are not the best case for owning investment grade corporate bonds. Advisors and clients that we talk to favor investment grade corporate bonds for their low volatility, the diversification benefit they provide to an overall portfolio or their ability to generate income in a safer manner than relatively more risky asset classes. These traits are magnified over longer time horizons and thus the asset class lends itself to being more strategic in nature as an allocation within a portfolio.

As we turn the page to the New Year we see several factors that could lend support to credit spreads in 2021.

  • Lower New Issue Supply in 2021 – Investment grade borrowers issued nearly $1.75 trillion of new debt in 2020 which shattered the previous record by 58%i. Bond dealers are expecting as much as $1.3 trillion of issuance in 2021, but most estimates are falling around $1.1 trillion. Even at the high end of the estimated range, the expectation is for substantially less supply. Demand overwhelmed supply the last several months of 2020 as evident by oversubscribed order books and narrow new issue concessions (the extra compensation/yield that issuers use to compensate investors in order to entice them to buy their new bonds versus their existing bonds). An environment with excess investor demand is supportive of spreads in the secondary market.
  • It’s Just Math: Global Edition – Even though US nominal yields are low, they are still meaningfully higher than foreign investors can find elsewhere. There was $17.8 trillion in negative yielding debt around the globe at the end of 2020ii. The following developed countries had negative 10yr sovereign bonds at conclusion of the year: France, Germany, Netherlands, and Switzerland. Sweden had a 10yr yield at year end of 0.009% and Japan was at 0.013%. Simply put, foreign investors have very few options, and many, such as pensions and insurance companies, must generate a return by investing in high quality assets. The U.S. investment grade credit market is the largest, deepest and most liquid bond market in the world by an order of magnitude. There is some nuance at play here in that these investors must account for hedging costs and that can cause demand to ebb and flow at times but they will remain an important fixture in our market for the foreseeable future and their demand is a technical tailwind for spreads.
  • Improving Economy – We expect that the economy will see solid improvement in 2021 but that it will be highly industry/company specific. Some industries are still significantly impaired, and some will be impaired permanently. There will be some opportunities in industries that are facing temporary headwinds. As earnings recover it will be important for an investment manager to differentiate among those companies who will use the earnings recovery for balance sheet repair versus those who may choose to engage in M&A, shareholder rewards or adopt a more aggressive financial policy by operating with higher leverage.
  • Yields are Low, but Curves are Steep – Of particular importance to an intermediate manager like CAM, is the steepening that we have seen in the 5/10 Treasury curve. If you are a repeat reader, you know that we are interest rate agnostic and that we typically buy 8-10yr bonds and allow those bonds to roll down the curve to 4-5yrs before we sell and redeploy the proceeds back out the curve. The 5/10 curve ended the year at 55 basis points which was near its highest levels of the year, after averaging less than 35 basis points during 2020. For context, the 5/10 curve closed above 30 on only one day for the entire two year period from the beginning of 2018 to the end of 2019. A steeper curve allows for more attractive extension trades and offers better roll-down potential for current holdings. It is a mechanism that allows a manager to generate a positive total return despite a low rate environment.

Like any investment process, there are risks to our view as well.

  1. Inflation – We think that 2021 will be a year that is rife with inflation scares and that it could lead to volatility in Treasuries and corporate bond valuations. In fact, the first trading day of 2021 generated a headline as the 10yr breakeven rate surpassed 2% for the first time in over 2 yearsiii. The breakeven rate implies what market participants expect inflation to be in the next 10 years, on averageiv. We do think that we will see inflation in 2021 but that it will be isolated pockets of higher prices confined to specific sets of circumstances. We have already seen this happen for some goods, such as lumber and building materials and we expect to see the same when demand increases for items like airline travel and indoor dining. The official definition of inflation, however, is a broad based and sustainable increase in prices. The U.S. consumer has been resilient, but consumer spending has been biased toward upper middle class and high income households who have been less affected financially by the pandemic. The overall unemployment rate remains high at 6.7% and it is significantly worse for those workers with lower educational attainment. The unemployment rate for those 25 years and over with less than a high school diploma is 9% and those with a high school diploma and no college is 7.7% while those with a bachelor’s degree or higher have a 4.2% unemployment ratev. In our view, without a more complete recovery across the entirety of the labor market, it is unlikely that the economy will experience significant inflation.
  2. Slower Economic Recovery – Risk assets are at all-time highs and it appears that good news surrounding vaccines and economic recovery is fully priced as far as valuations are concerned. This leaves little room for error if expected outcomes do not meet lofty expectations. Domestically, the initial vaccine rollout fell short of its goal, having administered only 4.2 million doses by year end versus a target of 20 millionvi. The scientific community is also concerned with new variants of Covid-19, with the UK strain having recently been identified in the U.S.vii and some epidemiologists’ are questioning vaccine efficacy on a newly identified strain found in South Africaviii. We are also concerned about the lingering economic impact that the pandemic may have on small business. While small business optimism has rebounded smartly from the depths of the crisis, many of these firms do not have the financial wherewithal to survive a more prolonged recoveryix.

CAM’s Portfolio Positioning

Our investment strategy has remained consistent in its approach, with a focus on bottom-up fundamentals. It was a challenging year that required constant adaptation to market conditions and the investable opportunity-set at any given point in time. In March and April, we were extremely involved in the new issue market, as concessions rose and high quality borrowers tapped the market to shore up their balance sheets. We were also able to invest in shorter maturities as forced selling caused dislocation across corporate credit curves creating opportunities to buy shorter bonds at yields that were equal or greater to longer maturities. As market conditions normalized throughout the second half the year, we took a more balanced approach between the new issue market and the secondary market. Our focus remained biased toward higher quality credit and sectors of the market that were less levered to the re-opening of the economy and those industries that benefited from more work and leisure time spent at home. As we head into the first quarter of 2021 we continue to favor companies with strong balance sheets and stable credit metrics as the entire market has continued to rally into the New Year. As spreads and yields compress, the incremental compensation afforded from taking additional credit risk has skewed risk-reward to the downside. The “buy the dip” trade has played out in our view and we are scrutinizing the capital allocation strategies of each of the companies in our portfolio. 2021 could be the year were there is a more clear bifurcation between those companies who will exit the pandemic stronger and those who will languish because the business is saddled with too much leverage and unable to effectively compete in the marketplace. As always, preservation of capital will continue to be at the forefront of our decision process.

We wish you a happy, healthy and prosperous New Year. Thank you for your business and continued interest.

This information is intended solely to report on investment strategies identified by Cincinnati Asset Management. Opinions and estimates offered constitute our judgment and are subject to change without notice, as are statements of financial market trends, which are based on current market conditions. This material is not intended as an offer or solicitation to buy, hold or sell any financial instrument. Fixed income securities may be sensitive to prevailing interest rates. When rates rise the value generally declines. Past performance is not a guarantee of future results. Gross of advisory fee performance does not reflect the deduction of investment advisory fees. Our advisory fees are disclosed in Form ADV Part 2A. Accounts managed through brokerage firm programs usually will include additional fees. Returns are calculated monthly in U.S. dollars and include reinvestment of dividends and interest. The index is unmanaged and does not take into account fees, expenses, and transaction costs. It is shown for comparative purposes and is based on information generally available to the public from sources believed to be reliable. No representation is made to its accuracy or completeness.

i Bloomberg, December 15, 2020 “Freeze to Frenzy, Corporate Bonds Bounce Back”
ii Bloomberg Barclays Global Aggregate Negative Yielding Debt Market Value USD
iii Bloomberg News, January 4, 2021”Treasuries Inflation Gauge Exceeds 2% for First Time Since 2018”
iv Federal Reserve Bank of St. Louis (T10YIE)
v U.S. Bureau of Labor Statistics, December 4, 2020 “Employment status of the civilian population 25 years and over by educational attainment”
vi The Hill, January 4, 2021, “Operation Warp Speed chief adviser admits to ‘lag’ in vaccinations”
vii The Wall Street Journal, January 4, 2021, “Highly Contagious Covid-19 Strain Has Been Found in New York State, Gov. Cuomo Says”
viii Bloomberg, January 4, 2021, “South African Covid Strain Raises Growing Alarm in the U.K.”
ix NFIB, December 8, 2020, “NFIB Small Business Economic Trends – November”

08 Jan 2021

CAM Investment Grade Weekly Insights

Spreads will finish the week unchanged after a minor bout of mid-week volatility that pushed spreads wider for a day.  Through the Thursday close, the OAS on the Bloomberg Barclays Corporate Index was 96, which is the same level that it closed to end 2020.  Treasury rates stole the headlines from spreads this week and are higher across the board, with the 10yr up 19 basis points week over week.  The sell-off in Treasuries began ahead of the Georgia special election and accelerated after the results, as the market began to price the expectation of more stimulus and Treasury supply.  Interestingly, rates were even able to shrug off a woeful December jobs report that showed the loss of -140k jobs during the month versus the concensus estimate for an addition of +50k.  We remain concerned about the health of the labor market, elevated unemployment and its impact on the economy’s ability to grow.

The high grade primary market was back in business this week with a strong start to the year as issuers borrowed $50bln.  It will be interesting to monitor new issue supply as 2021 progresses.  There are expectations for less supply but will this hold true?  In our view it is really a question of the economy and how quickly things get back to “normal.”  If things go swimmingly, then we would expect less supply but if re-opening takes longer than expected then that would be a case for more supply as companies that are more impacted by the pandemic may need to continue to tap the new issue market for balance sheet liquidity.

According to data compiled by Wells Fargo, inflows into investment grade credit for the week of December 31-January 6 were +$8.4bln.


20 Nov 2020

CAM Investment Grade Weekly Insights

Spreads will finish the week meaningfully tighter.  Treasuries have also rallied this week which has led to positive performance across the fixed income landscape due to the one-two punch of tighter spreads and lower rates.  The Bloomberg Barclays US Corporate Index closed on Thursday November 19 at 109 after closing the week prior at 114.  Through Thursday, the corporate index posted a year-to-date total return of +8.77%.

The high grade primary market was active again with $40 billion of new debt having been priced this week across 35 deals according to data compiled by Bloomberg.  Next week is typically one of the slowest of the year in the bond markets, but if 2020 has anything to say about that it could be busier than expected.  The market is closed for Thanksgiving and then closes early at 2pm on Friday so any primary market activity will be on Monday or Tuesday of next week while the latter half of the week is likely to see little to no activity.   Monthly issuance for November has now eclipsed $83 billion while the yearly total keeps adding to its record size, now in excess of $1.7 trillion.

According to data compiled by Wells Fargo, inflows into investment grade credit for the week of November 12-18 were +$6.8bln which brings the year-to-date total to +$257.8bln.


13 Nov 2020

CAM Investment Grade Weekly Insights

Spreads are all set to finish the week tighter.  Risk assets fared well across the board this week on the back of positive vaccine news.  The Bloomberg Barclays US Corporate Index closed on Thursday November 12 at 115 after closing the week prior at 117.  Through Thursday, the corporate index posted a year-to-date total return of +7.71%.

The high grade primary market was fairly active given the Veterans Day holiday in the middle of the week.  Jumbo deals from Verizon and Bristol-Myers pushed the weekly issuance total north of $41bln.  Next week will be the last chance for issuers to access the market before things slow down ahead of Thanksgiving.

According to data compiled by Wells Fargo, inflows into investment grade credit for the week of November 5-11 were +$5.4bln which brings the year-to-date total to +$240.2bln.


30 Oct 2020

CAM Investment Grade Weekly Insights

Spreads widened this week in sympathy with equities.  The Bloomberg Barclays US Corporate Index closed on Thursday October 29 at 125 after closing the week prior at 123 while stocks are on track for their worst week since March.  Through Thursday, the corporate index posted a year-to-date total return of +6.59%.


The high grade primary market was quiet amid earnings, with just over $20bln in new debt brought to market.  This brings the monthly total for October to $80bln, which is in-line with market expectations.  November could see a lighter new issue calendar due to rising virus counts and the associated volatility that could come with it, the election next week and the Thanksgiving holiday.

According to data compiled by Wells Fargo, inflows into investment grade credit for the week of October 22-28 were +$5.0bln which brings the year-to-date total to +$236bln.  This was the 30th consecutive week of inflows into the investment grade credit markets.

23 Oct 2020

CAM Investment Grade Weekly Insights

Spreads are modestly tighter on the week.  The Bloomberg Barclays US Corporate Index closed on Thursday October 22 at 123 after closing the week prior at 125.  Through Thursday, the corporate index posted a year-to-date total return of +6.51%.  Falling Treasuries have been a headwind for corporate credit performance over the course of the past week with the 10-year Treasury nearly 10 basis points higher from its close the week prior.

The high grade primary market was quiet again this week, with just over $15bln in new debt brought to market.  Issuance is likely to remain in a holding pattern until after the election.

According to data compiled by Wells Fargo, inflows into investment grade credit for the week of October 15-21 were +$8.0bln which brings the year-to-date total to +$231bln.

16 Oct 2020

CAM Investment Grade Weekly Insights

Spreads are opening Friday morning unchanged as we head toward the conclusion of this holiday shortened week that featured only four trading days.  The Bloomberg Barclays US Corporate Index closed on Thursday October 15 at 126 after closing the week prior at 126.  Through Thursday, the corporate index has posted a year-to-date total return of +7.43%.

The high grade primary market was relatively quiet this week, with $15bln in new debt brought to market.  The next several weeks are likely to see more subdued levels of issuance as companies work their way through earnings reports and the election fast approaches.

According to data compiled by Wells Fargo, inflows into investment grade credit for the week of October 8-14 were +$8.5bln which brings the year-to-date total to +$220bln.


(Bloomberg) Hunt for Yield Pushes Investors Into Riskier Bonds Around Globe

  • Bond investors are pouring back into riskier debt in search of higher returns as they increasingly factor in years of low interest rates.
  • Even in Europe, where coronavirus cases are on the rise and Brexit negotiations are entering a critical phase, investors are taking more risks in a hunt for yield. The scarcity was highlighted this week by Italy’s sale of three year debt without offering any coupon on the bonds.
  • Junk-rated jet-engine maker Rolls-Royce Holdings Plc drew such demand for a bond sale this week that the company doubled the size of the offering to 2 billion pounds ($2.59 billion) equivalent and tightened the pricing.
  • European junk-rated borrowers have issued the most bonds since 2017 so far this year despite a lack of deals in March and August. Polish packaging firm Canpack, French shipping giant CMA CGM SA and French sugar producer Tereos are all currently marketing high-yield bonds.
  • Even more money could flow into riskier assets ahead. A flood of central bank liquidity meant to support struggling economies during the pandemic has left investors sitting on $16.3 trillion of negative-yielding debt.
  • Money managers are increasingly hungry for alternatives, particularly after Federal Reserve officials in September indicated they see rates holding near zero for at least three years. The world’s stock of negative-yielding bonds rose to a 13-month high this week on speculation central banks will keep buying.
  • Elsewhere in the hunt for yield, China drew bumper demand for a bond sale this week even amid increasing tensions with the U.S. Turkey returned to international debt markets last week despite mounting geopolitical risks. And across emerging markets, dollar notes sold by the lowest-rated borrowers are returning more than top-rated peers.
  • Nearly a third of Asia Pacific companies have scrapped or reduced dividends this year after the pandemic forced them to conserve cash.
  • CAM NOTE: We do not intend to engage in this yield chasing behavior for our portfolio and instead will focus on companies with durable businesses that have sustainable capital structures with the ability to weather the current downturn. Additionally we intend to keep our structural underweight on the lower-rated BAA portion of the investment grade universe.
08 Oct 2020

2020 Q3 Investment Grade Commentary

Corporate credit turned in a solid performance during the third quarter. Spreads were tighter, with the option adjusted spread on the Bloomberg Barclays U.S. Corporate Index opening the quarter at 150 and closing the quarter at 136. Treasuries were almost unchanged on the quarter with the 10yr Treasury opening at 0.66% and closing at 0.68%, but that does not tell the whole story of the volatility that was experienced throughout the period. The 10yr closed as low as 0.51% on August 4th and as high as 0.75% on August 27th with the average coming in at 0.64%. The Corporate Index posted a total return of +1.54% during the quarter with a year-to-date tally of +6.64%. This compares to CAM’s gross quarterly total return of +1.76% and year-to-date gross return of +6.74%.

Investment Grade Bonds – Where is The Value?
We have been at this a long time and the lightning quick risk reversal we have experienced in 2020 is the type of thing that only comes around once every decade or so. Going back to March 20, the Corporate Index closed that day with a year-to-date total return of -10.58%, but quickly rebounded over +17.2% through the end of the third quarter, a period of just over 6 months from the low. In March, the risk reward for corporate credit was very attractive, especially for extremely high quality A-rated credit. The spread on the Corporate Index traded north of 370 during the spring malaise, a level not seen since the financial crisis in early 2009, which is the last time we saw such a tremendous spread rally.

Now that the market has rallied so far so fast, clients are asking about the valuation of IG credit. Some clients are even wondering if it is worth owning IG bonds at all. For most investors, it is important to remember that IG credit is but one part of a well-diversified portfolio. Most of our clients own IG credit as a way to generate income, diversify away from equities or dampen overall portfolio volatility. We think that IG credit is still attractive for a few reasons and that the asset class still has a key part to play in an investor’s overall asset allocation.

Spreads still present opportunity in our view, particularly when looking at the percentage of yield that is comprised of credit spread. Remember that there are two components of yield as a corporate bond investor: the yield of the underlying Treasury at the time of purchase and the corporate credit spread on top of that Treasury yield. For example if the purchase of a security occurred while the 10yr Treasury was 0.70% and the corporate credit spread of the security was trading at 200 basis points then the yield to maturity for that particular bond purchase would be 2.70%. In this case we would calculate the spread component of our overall yield by dividing 200/270bps arriving at a figure of 0.74%, which is very high by historical standards.

As you can see from the above charts, as the yield on the index has fallen, the percentage of yield that is comprised of credit spread has risen. This gives us two items that make us feel reasonably optimistic about the current level of spreads. If the economy is slow to recover from the pandemic, and Treasury rates remain near historical lows for an extended period, then spreads could well grind tighter, to a ratio that is more in line with the historical level of compensation relative to interest rates. On the other hand, if the economy recovers more quickly than the market currently anticipates, then we would expect a gradual increase in interest rates toward pre-pandemic levels. In the “quicker recovery” scenario, because the economy would be improving, then the path of least resistance would be tighter credit spreads which would help to offset rising interest rates. Recall that the spread on the index opened the year at 93 versus 136 at the end of the third quarter, so it is not hard to imagine tighter credit spreads from current levels amid an environment of more robust economic growth.

We are also monitoring several technical tailwinds that could be supportive of credit spreads for the remainder of 2020 and beyond. First, investor demand for corporate credit has been robust in 2020, with over $203 billion in net inflows into high grade funds through the end of the third quarteri. Second, there has been a resurgence in the foreign bid for $USD credit. The Bloomberg Barclays Global Aggregate Negative Yielding Debt Index closed September at -$15.5 trillion, not terribly far from its all-time high of -$17 trillion in August of 2019. Asia is one of the largest buyers of $USD IG credit and overnight Asian buying has been substantially positive every month for the past year and Asian demand was especially large in March, April and May of this yearii. Third and finally, we are looking for supply to slow substantially going forward. 2020 has seen a tidal wave of new issue supply as companies have been keen to meet the aforementioned investor demand with new corporate bond issuance. Through the end of the third quarter, companies had issued a record breaking $1.542 trillion in new debt, +67% ahead of 2019’s paceiii. The level of issuance has been so robust that it is unlikely to keep pace going forward as companies have largely completed their liquidity boosting and refinancing endeavors. We expect that companies in certain sectors that are more exposed to the economic slowdown will continue to tap the market for liquidity, but we do not anticipate nearly as much supply from those in less affected sectors. Not only that, but M&A activity is typically a large driver of supply, and it has dwindled to a standstill amid pandemic-related uncertainly. Of 200 IG deals in the 3rd quarter, fewer than 10 were tied to acquisitions bringing the year-to-date total to 20 acquisition-related deals versus 31 over the same time period in 2019<sup>iv</sup>. Less new issue supply often creates an environment that is supportive of credit spreads as investors must put their money to work in existing bonds.

Understanding the Risks
Opportunities are not without risk. Some risks loom large, like presidential and congressional elections that are just around the corner that will determine the direction of the country for the next several years. Risks related to the elections are less about the market as a whole and more about individual securities and how they may be impacted by things like tightening or loosening of restrictions related to climate change, financial regulation or changes at the Federal Reserve which could ultimately affect monetary policy. This is where bottom up credit research comes in. Our thorough research process and relatively concentrated portfolio means we are well aware of how current and potential investments might be impacted and we eschew those investments that are exposed to adverse outcomes. As far as the Federal Reserve is concerned, there is little worry about near term changes in policy as Chairman Jerome Powell’s term does not expire until February 2022 and the prevailing thought is that he would be nominated for an additional 4-year term by either presidential candidate.

An emerging risk for passive fixed income investors that has received little attention in our opinion is the increasing duration of the investment grade corporate bond universe. In the past decade, the Bloomberg Barclays Corporate Index has seen its modified duration increase from 6.7 to 8.7 years. Revisiting the concept of duration, all else being equal, if the duration is 8.7 years, then a 100 basis point linear increase in interest rates would yield an 8.7% loss of value for a portfolio invested in the index. Investors in passively managed index portfolios probably do not realize that they are exposed to almost 30% more interest rate risk than they were incurring for the same investment just 10 years ago.

CAM’s modified duration change over the past 10 years was unchanged at 6.2 years and CAM’s duration was 2.5 years shorter than the index at the end of the third quarter. Now, CAM’s duration did exhibit slight fluctuations over the most recent 10 years, but the average during that period was 6.4 years and the range of change over the preceding 10 years was just 0.9, less than half the index range of 2.2 years. The duration gap has clearly grown between CAM’s IG composite and the Index, especially over the past 2 years, as the Index has gradually seen its duration creep higher.

Why has the Corporate Index duration increased? Low interest rates have helped, but much of the change is driven by what we call reverse inquiry. That is, demand from long term institutional investors in the corporate bond space such as pensions, insurance companies and endowments who are extremely thirsty for yield. Company Treasury departments recognized this demand and happily obliged by issuing a higher percentage of longer term debt at rates that were attractive to the company and with enough yield to satiate the institutional investors. Debt maturing in 10 years or more now makes up one-third of the overall IG Index while debt maturing in 20 years or more has grown to 22.4%v.

Why has CAM’s duration exhibited such little change by comparison? As we have discussed many times before in these commentaries, you know exactly what you are going to get when it comes to our portfolio: intermediate maturities positioned in the 5-10 year portion of the yield curve. Rather than try and “guess” the direction of interest rates we will always position the portfolio in intermediate maturities as it has historically been the best place to be from a risk reward standpoint. For example, the 5/10 Treasury curve at the end of the third quarter was 41 basis points, or about 8.2 basis points of compensation or “roll down” per year earned from holding a 10 year security until the 5 year mark. The 10/30 Treasury curve was 77 basis points, or about 3.8 basis points of compensation per year from the 30 year to the 10 year mark. Thus the 5/10 curve was significantly steeper than the 10/30 curve, and this steepness is one of the reasons CAM favors intermediate maturities. The compensation afforded for the duration risk incurred by extending beyond 10 years does not offer good risk reward in our view. Additionally, there are corporate credit curves that trade on top of these Treasury curves and these corporate curves tell a similar story. At the end of the third quarter the average A2 rated industrial bond traded at a credit spread of +45 to the 5yr, +89 to the 10yr and +125 to the 30yr. Thus the A2 industrial 5/10 curve was 44 basis points while the 10/30 curve was 36 basis pointsvi. This illustrates that an investor was being better compensated by moving from a 5yr corporate bond to a 10yr corporate bond than they were by moving from a 10yr corporate bond to a 30yr corporate bond. The major take away from this exercise is that Cincinnati Asset Management will not speculate on interest rates. Instead, we will continue to focus on the intermediate portion of the yield curve where we can add value through our robust bottom up research process and opportunistic credit selection.

Going forward we plan to stick to our script, as disciplined investors of your hard earned capital. We thank you for your interest and support. As always, please do not hesitate to contact us with any questions.

This information is intended solely to report on investment strategies identified by Cincinnati Asset Management. Opinions and estimates offered constitute our judgment and are subject to change without notice, as are statements of financial market trends, which are based on current market conditions. This material is not intended as an offer or solicitation to buy, hold or sell any financial instrument. Fixed income securities may be sensitive to prevailing interest rates. When rates rise the value generally declines. Past performance is not a guarantee of future results. Gross of advisory fee performance does not reflect the deduction of investment advisory fees. Our advisory fees are disclosed in Form ADV Part 2A. Accounts managed through brokerage firm programs usually will include additional fees. Returns are calculated monthly in U.S. dollars and include reinvestment of dividends and interest. The index is unmanaged and does not take into account fees, expenses, and transaction costs. It is shown for comparative purposes and is based on information generally available to the public from sources believed to be reliable. No representation is made to its accuracy or completeness.

i Wells Fargo Securities, October 1 2020, “Credit Flows: Supply & Demand: September 24-September 30”
ii Credit Suisse, October 2 2020, “CS Credit Strategy Daily Comment (IG September Recap)”
iii Bloomberg, September 30 2020, “IG ANALYSIS US: Mondelez Brings 5th Deal, Month Cracks Top Seven”
iv The Wall Street Journal, October 3 2020, “Credit Markets: Corporate Bond Sales Reach Record”
v Deutsche Bank Research, August 18 2020, “Is Duration Risk The New Credit Risk In IG?”
vi Raymond James, October 2 2020, “Fixed Income Spreads”