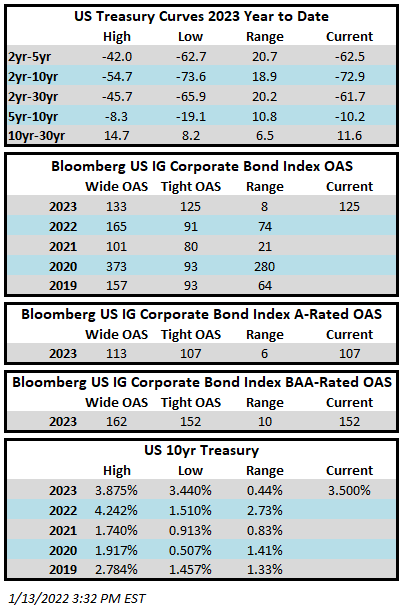
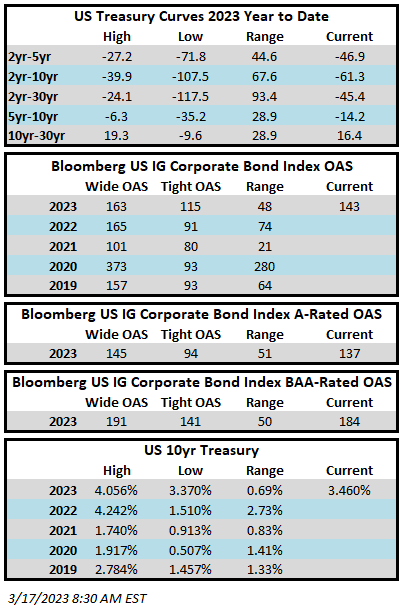
Author: Josh Adams - Portfolio Manager

04 Mar 2022

CAM Investment Grade Weekly Insights

For the second consecutive week, spreads will finish a Thursday evening at the widest levels of the year.  The tone of the market is also feeling heavy this Friday morning as we got to print amid geopolitical fallout from Europe.  The prospect of a nuclear incident at a Ukrainian facility is not something the markets are taking lightly. On the domestic front, the Friday morning jobs report showed that U.S. hiring was strong in February with employment numbers handily beating consensus estimates along with an unemployment rate that edged lower, to 3.8%.  This news likely keeps the Federal Reserve on track to begin its hiking cycle at its meeting later this month.  The OAS on the Bloomberg US Corporate Bond Index closed at 125 on Thursday, March 3, after having closed the week prior at 121.  The Investment Grade Corporate Index has posted a negative YTD total return of -5.8% through Thursday.  The YTD S&P500 Index return was -8.4% and the Nasdaq Composite Index return was -13.5%.

The primary market was extremely active this week with 31 deals totaling over $53bln with at least one deal pending on Friday that will add to this total.  This speaks to the resiliency of the investment grade credit market– even amid geopolitical uncertainty; the market remains open for business in a big way.  Next week’s consensus forecast is calling for things to remain busy with predictions of more than $40bln in new issue.  March is typically a seasonally busy month for issuance and it appears that 2022 is no exception.

Per data compiled by Wells Fargo, flows for investment grade were negative on the week.  Flows for the week of February 24–March 2 were -$2.1bln which brings the year-to-date total to -$14.7bln.

25 Feb 2022

CAM Investment Grade Weekly Insights

Spreads finished Thursday of this week at their widest levels of the year but there has been a significant retracement through Friday morning.  The first half of the trading day on Thursday was extraordinarily weak with poor performance for risk assets as investors digested the news out of Europe before equities and credit staged a stunning reversal that afternoon.  The OAS on the Bloomberg US Corporate Bond Index closed at 124 on Thursday, February 25, after having closed the week prior at 118.  Investment grade has posted its worst start to a year ever with the Corporate Index down -6.5% total returns through Thursday.  The YTD S&P500 Index return was -9.77% and the Nasdaq Composite Index return was -13.69%.

The primary market was less active than expected this week with the backdrop of geopolitical tensions but investment grade companies still managed to issue $18bln of new debt.  Next week’s consensus forecast is calling for more than $25bln in new issue and some sell side prognosticators are predicting an extremely busy calendar for March with as much as $175bln+.  There are some jumbo deals waiting in the wings that could print next month which could balloon that figure even further.

Per data compiled by Wells Fargo, flows into investment grade were modestly positive on the week.  Flows for the week of February 17–23 were +$0.4bln which brings the year-to-date total to -$12.7bln.

11 Jan 2022

2021 Q4 Investment Grade Quarterly

Investment grade corporate credit spreads finished the year little changed. For the full year 2021, the option adjusted spread (OAS) on the Bloomberg US Corporate Bond Index tightened by 4 basis points to 92 after having opened the year at an OAS of 96. The 4th quarter saw more movement, with the spread on the index moving wider, opening the quarter at 84 and closing at 92.

Treasuries finished the 4th quarter nearly unchanged. The 10yr Treasury opened the 4th quarter at 1.49% and closed at 1.51%. There was much more movement within the full year number with the benchmark 10yr opening 2021 at 0.91% and closing as high as 1.74% at the end of the first quarter before receding into the close of the second quarter and then trading higher from there, closing the full year 60 basis points higher at 1.51%.

The Corporate Index eked out a positive return during the fourth quarter, posting a total return of +0.23%. This compares to CAM’s net 4th quarter total return of -0.30%.

For the full year 2021, although spreads were slightly tighter, it was not enough to offset the move higher in interest rates. The Corporate Index posted a full year total return of -1.04%. This compares to CAM’s net full year total return of -1.38%.

Few Things Worked in 2021
Broadly speaking it was a tough year for investment grade credit. The Long portion (10+ years to maturity) of the US Corporate Index underperformed the Intermediate portion by 13 basis points on the back of higher Treasury rates. The “risk-on” trade has been in full effect since mid-2020 and that theme continued in 2021 with lower quality IG credit outperforming higher quality during 2021.

Recall that CAM has a structural underweight in Baa-credit and targets a ceiling of 30% exposure to this riskier segment of the market while the index is >50% Baa-rated. CAM also targets an A rating for its client portfolios
while the index is rated A3/Baa1.

As far as individual sectors go, there were a couple winners. At the sector level, only Energy and the Other Industrial sectors posted positive total returns on the year, of +1.39% and +0.88%, respectively. While Energy represented a major sector with a 7.72% index weighting, Other Industrial is quite small and represented just 0.48% of the Corporate Index. As far as individual industries were concerned, those industries under the Energy umbrella led the way with Independent Energy, Oil Field Services, Refining and Midstream posting total returns of +1.60%, +2.45%, +2.48% and +2.46%, respectively. The best performing individual industry was Airlines with a +4.48% total return.

The sectors that posted the biggest losses were Utilities, Technology and Consumer Noncyclical with returns of -2.15%, -1.98% and -1.30%, respectively. It may seem counterintuitive but while these industries are some of the most stable, high quality was not in favor during 2021 and instead risk taking ruled the day. Outside of the various utility sub-industries, the worst performing individual industries were Tobacco and Cable & Satellite with returns of -2.32% and -2.12%, respectively.

A Year of Little Change
2021 was one of the least volatile years for IG credit—the index OAS traded in a range of just 21 basis points. To find a less volatile year we have to go all the way back to 2006 when the range was just 12 basis points.

Ironically, the low volatility of 2006 continued well into 2007, just prior to the two most chaotic years in the history of investment grade credit. Please note that we do not expect a repeat performance of this in 2022 given the exogenous factors that were in play back in 2008-2009. In fact we predict quite the opposite, and our opinion is that 2022 will be a year of spread stability similar to 2021. There have been sustained periods of time in the history of our market where spreads have traded at levels beneath or near 100, and barring a geopolitical crisis or unexpected shock to the global economy, we see little reason that spreads should move meaningfully over the course of the next year. They may move wider or they may move tighter but we feel pretty comfortable pegging a spread of 100 +/- 20bps type of valuation target for the end of 2022.

Predicting fund flows is always a difficult but, even after $323.8 billion of inflows during 2021 into IG credit, making it the second largest year on record, we expect demand to remain positive going into 2022i. After such a strong performance for equities in 2021, pension funds will continue to look to rebalance and demand from institutional investors both domestic and foreign should remain strong. Additionally, IG credit will likely benefit from “flattish” gross new issuance supply and most Wall Street prognosticators are predicting substantially less net new issue supply as the amount of debt that matures in 2022 is larger than what we have experienced in recent years. Less supply of new bonds creates a more supportive environment for credit spreads in the secondary market and for the market as a whole. One factor that could make a difference at the margin is the amount of high yield debt that is upgraded to investment grade during the course of the year. Current expectations are calling for a robust upgrade cycle in 2022 and these companies will often issue new debt when they achieve investment grade status. Past experience tells us that much of this debt ends up being “leverage neutral” as lower interest rate investment grade debt is used to retire higher interest rate legacy high yield debt. However, the debt is still net new for the investment grade market since these companies were previously part of the high yield market. If we experience even more upgrades than the upper limit of the rosiest predictions then that could make for higher new issue supply numbers within the IG market.

In our view, the biggest potential driver of benign spread volatility during 2022 is that the economy is likely to continue to grow at above average levels and that the typical investment grade company is in good health from a balance sheet perspective. The median real GDP forecast is predicting growth of +3.9% in 2022 which is solidly above trendii. Companies are still sitting on elevated cash balances but as we have written about in past commentaries this will not last forever. As we move into 2022, it becomes increasingly likely that this cash will start being deployed for shareholder returns and M&A will move to the forefront. 2022 is shaping up to be much more of a credit pickers market instead of a market that generically rewards all risk-taking.

The Return of Dispersion

We have seen erosion in the quality of the investment grade universe, especially over the course of the last dozen years. That data set below is representative of just the past 10 years but the trend really started to manifest itself at the end of 2008, when the Corporate Index was just 33.15% Baa-rated compared to today when it is north of 50%.

Since 2008, the proportion of Baa-rated credit has crept higher with each passing year. There is some noise in these numbers, given the wave of downgrades from investment grade to high yield that occurred in 2020 and that is precisely why the percentage of Baa-rated debt decreased from 2019-2020 –those companies exited the investment grade universe entirely and joined the high yield universe. So the IG universe increased its quality by subtraction, not by improving its credit metrics. Many of these companies that were downgraded to junk have since repaired their balance sheets and some will earn upgrades and will be returning to investment grade in 2022, boosting the number of lower rated IG companies by the end of the year. Additionally, there are a relatively large number of rising stars within the high yield ranks currently that were not previously rated IG, many of which will be earning upgrades throughout the year. Taking it altogether, there is a good chance that year end 2022 will mark a new high for the proportion of Baa-rated credit within the Corporate Bond Index.

The purpose of this example is not to show that all Baa-risk is bad, because that is not the case. Consistently, the worst performers in IG credit are those companies that move from Aa or A rated down to Baa. On the other hand, some of the best performing credits are those companies that are currently high yield or split rated (half high yield, half investment grade) with the potential to improve their credit metrics and earn a full investment grade rating. We believe that 2022 will offer opportunity, both in the form of identifying such companies and by avoiding those weakly positioned A-rated credits that will join the ranks of the growing Baa-rated cohort. This is one of the reasons that you will see us occasionally invest in companies with just one IG rating and up to 1 or 2 HY ratings. It is usually because we expect the company to become fully IG-rated and we want to take advantage of associated spread compression for our clients. We also do not hamper ourselves with “automatic sale” rules in the event that a current portfolio holding loses IG ratings by getting downgraded to HY. Instead we will rely on our credit research to determine if it makes sense to continue to hold the bonds of a downgraded company and if it has a chance to regain IG status over our investment time horizon. The Baa-universe is chock full companies with bonds that trade at unattractive valuations from a risk reward standpoint. We are looking to provide our clients with a return that is equal to or greater than the Corporate Index but we want to do so by incurring less volatility –hence our structural underweight of Baa-rated credit versus the index. At the end of the day the only way an investor can identify these opportunities is by blocking and tackling and good old fashioned credit work which is one of the cornerstones of our investment grade program and but one of the ways we will look to add value for our clients in the year ahead.

The Federal Reserve & The “I” Word

At its November meeting, the Fed signaled its intent to complete the tapering of its asset purchases by the end of June. However, the landscape had changed by the time the December 15 meeting came around, and in a move to combat rising inflation, the Fed accelerated its tapering timeline. The Fed now expects to finish its taper by the end of March which would create the potential for a Fed Funds rate hike as soon as its March 16 2022 meetingiii. With the end of tapering occurring in the near term, it will be quite interesting to hear the Fed’s plans for the central bank’s $8.76 trillion asset portfolio. Discussions are ongoing and will continue at the January 2022 FOMC meeting but Chairman Powell and other Fed officials have hinted that shrinking the asset portfolio could be another arrow in the quiver that it may use to rein in inflationiv. It could be that the Fed elects to play it very slow with increases in the Fed Funds Rate, instead relying on balance sheet reduction to slow the economy and cool inflation toward its long term target level of 2%. The Fed believes that inflation will slow in the second half of 2022 and this is in line with the consensus view of most economists. In short, we believe the Fed will use all the tools at its disposal to make this a reality even if it means they must use some measures to slow economic growth.

Wrap It Up
2022 is poised to be an interesting year for the credit markets. Although we don’t expect wild swings in the level of credit spreads there could be some pockets of rate-driven volatility at times throughout the year as the Fed embarks on its first tightening cycle since 2018. Inflation will remain at the forefront and time will tell if those pressures ease in the second half of the year. The pandemic enters its third year and geopolitical uncertainty looms as it pertains to Russian and the Ukraine, both of which could impact risk assets or spark a flight to quality. The case for Investment Grade as an asset class today is for its downside protection, diversification and income generation. The time will come when total returns move back to the forefront but it is hard to make an argument for more than coupon-like returns in the current environment. Investors with strategic goals and medium to long time horizons have recognized the benefits of a permanent allocation to IG credit.

We wish you a happy and healthy 2022. We will be doing our best to navigate the credit markets in a successful manner and we appreciate the trust you have placed in us as a manager of your hard earned capital. As always, thank you for your business and please do not hesitate to reach out to us with any questions or comments.

i Wells Fargo Securities, January 3 2022 “Credit Flows | Special FY 2021 Edition”
ii Bloomberg, January 3 2022 “US GDP Economic Forecast Real GDP (YoY%) (78 responses)
iii Federal Reserve Open Market Committee, December 15 2021 “Statement Release”
iv The Wall Street Journal, January 4 2022 “Fed Weights Proposals for Eventual Reduction in Bond Holding”

This information is intended solely to report on investment strategies identified by Cincinnati Asset Management. Opinions and estimates offered constitute our judgment and are subject to change without notice, as are statements of financial market trends, which are based on current market conditions. This material is not intended as an offer or solicitation to buy, hold or sell any financial instrument. Fixed income securities may be sensitive to prevailing interest rates. When rates rise the value generally declines. Past performance is not a guarantee of future results. Gross of advisory fee performance does not reflect the deduction of investment advisory fees. Our advisory fees are disclosed in Form ADV Part 2A. Accounts managed through brokerage firm programs usually will include additional fees. Returns are calculated monthly in U.S. dollars and include reinvestment of dividends and interest. The index is unmanaged and does not take into account fees, expenses, and transaction costs. It is shown for comparative purposes and is based on information generally available to the public from sources believed to be reliable. No representation is made to its accuracy or completeness.

10 Dec 2021

CAM Investment Grade Weekly Insights

Spreads will finish the week tighter, reclaiming some ground after having experienced headwinds in the week prior which saw the index close two days at 101 –its widest level of 2021.  The OAS on the Bloomberg US Corporate Bond Index closed at 96 on Thursday, December 9, after having closed the week prior at 100.  Treasury volatility has been a common theme in recent weeks and this week was no exception.  The 10yr Treasury is 1.47% on Friday morning after having closed last week at 1.34%.  Through Thursday, the Corporate Index had posted a year-to-date total return of -1.26% and an excess return over the same time period of +1.25%.  The Federal Reserve is currently within its blackout period as the market patiently awaits the next FOMC decision on Wednesday of next week.


The primary market was active this week with Merck leading all issuers with an outsize $8bln print.  In all, over $38bln in new debt was brought to market during the week.  This month can be seasonally slow but that has not been the case this year with a record breaking amount of new issuance during the month of December ($61.7bln) which is impressive to be sure given we are not yet half  way through the month. According to data compiled by Bloomberg, $1,411bln of new debt has been issued year-to-date.  2021 has firmly secured its place in history as the 2nd busiest year for issuance on record but it still trails 2020’s record breaking volume by almost 20%.  Issuance consensus estimates for next week are calling for only $5bln but we are skeptical and would not be surprised if Monday and Tuesday bring some activity.  Wednesday is likely to be very quiet with the FOMC on the tape.

Per data compiled by Wells Fargo, flows into investment grade credit for the week of December 2–8 were +$0.885bln which brings the year-to-date total to +$321bln.

05 Nov 2021

CAM Investment Grade Weekly Insights

Spreads inched tighter throughout the week.  The OAS on the Blomberg Barclays Corporate Index closed at 86 on Friday, November 5, after having closed the week prior at 88.  On Wednesday, in a move that was widely anticipated, the Federal Reserve proceeded with the implementation of its plan to gradually taper the pace of asset purchases. Treasury yields moved lower after the FOMC meeting with the yield on the 10yr Treasury finishing the week at 1.45%, 10 basis points lower from its close the week prior.  Even a solid payrolls report with an upward revision to prior data was not enough to stem the rally in rates.  Through Friday, the Corporate Index had posted a year-to-date total return of -0.14% and an excess return over the same time period of +2.06%.

The primary market saw another somewhat active week with $20bln in new debt having been brought to market.   According to data compiled by Bloomberg, $1,258bln of new debt has been issued year-to-date.

Per data compiled by Wells Fargo, outflows from investment grade credit for the week of October 28–November 3 were -$0.280bln which brings the year-to-date total to +$313bln.  This marked the first outflow since March and only the second recorded outflow in the past calendar year.

15 Oct 2021

2021 Q3 Investment Grade Quarterly

Investment grade corporate credit finished the third quarter little changed from where it began the period. The option adjusted spread (OAS) on the Bloomberg Barclays US Corporate Bond Index ended the third quarter at 84 just modestly wider from where it started at a spread of 80.

Treasuries finished the quarter nearly unchanged as well. The 10yr Treasury opened the 3rd quarter at 1.47% and closed at 1.49%. There was some volatility along the way, as the benchmark rate closed as low as 1.17% near the beginning of August with much of its move higher coming in the last week of September.

It has been a relatively low volatility year for investment grade credit spreads with the Corporate Index having traded so far this year within its narrowest band since 2006, with a spread range of just 20 basis points. The index saw its tightest level when it closed at 80 the last day of June and its widest level of 100 in early March. For context, during the volatile year of 2020, the index saw a range of 280 basis points. The index traded in a range of 64 and 68 basis points in 2019 and 2020, respectively.

There are several reasons why we believe volatility has been subdued thus far in 2021. First, demand for investment grade credit as an asset class has been very strong which can be supportive of lower volatility and tighter credit spreads. According to data compiled by Wells Fargo Securities, there has been over $300bln in fund flows into investment grade credit through September 29.i A second reason we believe there has been less volatility is due to low net new issue supply. Gross supply has exceeded $1.1 trillion in 2021, the second busiest year on record.ii However, a closer examination of the numbers reveals that much of 2021’s supply has been for the replacement of existing higher cost debt. After subtracting tenders, refinancing and maturities, that $1.1 trillion gross supply figure gets whittled down to less than $300bln in net new issue supply through the end of the third quarter.iii Simply put, demand for credit has overwhelmed available supply. Finally, investment grade companies have strong balance sheets and high cash balances. Combining this strength with a yield starved environment and a “risk-on” sentiment has created a feeling among some investors that there is very little risk at the moment in IG credit and we believe this is the largest factor that has contributed to low volatility

Although most companies in IG credit are well positioned, this is an environment where investors need to tread especially lightly and do their homework on each individual company. Yes IG credit is generally in good or even great condition. Many companies issued debt during the worst of the pandemic because they wanted to shore up liquidity in the face of uncertainty. As a result, gross leverage is still elevated from pre-pandemic levels. Much of the cash that was borrowed is sitting idle on company balance sheets. As an additional consequence of the pandemic, there are scores of companies that paused share buybacks in 2020 or even dividends and have yet to resume them. There will be pressure from shareholders to resume these activities as well as additional shareholder remuneration. Management teams and boards have stockpiles of cash and may be tempted by ample M&A opportunities at some of the richest valuations the market has ever seen. It is important for a bond manager to identify those companies that are committed to maintaining or repairing the health of their balance sheets and to avoid those that will use excess liquidity for pursuits that are negative for bondholders. Shareholder rewards and M&A are fine as long as they are done within the confines of the balance sheet. It is when these activities rise to excess levels resulting in downgrades from A to BAA or from BAA to junk that it starts to impair total return potential for bondholders.

In a move that was largely expected at its September meeting the Federal Reserve said that it could start to reduce its $120 billion in monthly asset purchases as soon as its next scheduled meeting in early November. The tapering messaging has been deliberate and carefully crafted, and although there has not yet been a formal decision, Chairman Powell said that it would be a gradual process “that concludes around the middle of next year is likely to be appropriate.”iv
It has received much less press coverage but we would argue that the Fed began the tapering process back in July when it started selling down its corporate credit facilities. Recall that during the height of the crisis in March of 2020, the Fed went to extraordinary measures and began to purchase corporate bond ETFs as well as individual corporate bonds. The maximum size of the facility was $750bln, but at its peak the facility only grew to $14bln. The Fed quietly exited all of these positions by September 1 with no discernible market impact.v Clearly, the program was a success and it did much to reinstall confidence in the credit markets at a time when it was desperately needed.
As far as the federal funds rate is concerned, the September meeting was slightly more hawkish than expectations but again the message was clear that tapering will come first and any rate hikes will come thereafter. The committee was split on the timing of the first rate hike, with half of 18 Fed officials expecting at least one increase by the end of 2022 with additional increases forthcoming during 2023. We also expect that this will be a slow and steady process. The Fed Funds rate is a very short term interest rate and its impact is limited to the front end of the yield curve, while maturities further out the curve, like the 10yr and 30yr Treasury are much more impacted by the overall direction of the economy and inflation expectations. We think incremental increases in the Fed Funds rate are entirely manageable for corporate credit so long as the Fed keeps a watchful eye on the economy to prevent it from overheating.

We often receive questions from clients about our intermediate positioning, as our portfolios are typically invested in bonds that range from 5-10 years until maturity. A bond portfolio is generally seeking to accomplish four goals: income generation, preservation of capital, inflation protection and diversification. We believe positioning the portfolio within an intermediate maturity range helps to accomplish all of these goals but it is especially useful in limiting downside and preserving purchasing power. Intermediate maturities give the portfolio a chance to benefit if Treasury rates go lower but it also provides much more protection from rising interest rates than if the portfolio were invested in longer maturities 20 to 30 years out the curve. More importantly, it gives the portfolio a chance to generate a positive total return in environments where rates exhibit little movement, even if absolute yields are low like they are currently. The 5/10 curve is one of the most reliably steep portions of both the Treasury curve and the corporate credit curve, which is the spread that one is afforded for owning a corporate bond on top of a Treasury.

As you can see from the chart, the steepness afforded from the 5/10 portion of these curves is attractive relative to the longer portions. Take the corporate yield curve as an example (green). We get 91 basis points of additional yield by selling a bond at 5yrs and using the proceeds to buy a bond that matures in 10yrs. The way that bond math works, all else being equal, in a static rate and spread environment, we would collect 91 basis points of roll down from holding a generic investment grade corporate bond from 10yrs selling it at 5yrs. The mere 68 basis points of compensation afforded from extending from 10yrs to 30yrs pales in comparison to the intermediate positioning. The extension from 10/30 is also accompanied by substantially more interest rate risk.

Now let’s take a look at duration to provide some more context to this discussion. At September 30 2021, the modified duration of the Bloomberg Barclays US Corporate 5-10yr index was 6.47 and the OAS was 80. The modified duration of the US Corporate 10+yr index was 15.19 and the OAS was 122. One very basic measure of risk/reward we like to use is yield per unit of duration. In this instance we are receiving 12.4 basis points per year of duration if we invest in the 5-10yr index but only 8 basis points per year of duration if we invest in the 10+ portion of the index. Given the way that we at CAM view the world, by investing in the 10+ year portion of the index, we would be receiving significantly less compensation in exchange for more interest rate risk.

The big themes that will carry us into year-end are the ongoing pandemic, the domestic economy, China and the FOMC; on these topics there are more questions than answers at this point. Will the economy continue to recover or will new variants take the wind out of its sails? Will policy makers be able to offer targeted relief to those sectors of the economy that have not come close to recovering lost earnings without offering relief that is so broad that it leads to overheating? Will problems with China’s domestic economy lead to systemic issues for the global economy – for the record we think not –but could there be ramifications for certain industries? And finally, the FOMC’s November meeting looms large with the potential for an announcement on tapering asset purchases.
As we stated earlier in this missive, corporate credit is generally in solid shape but this is not a risk free asset class. Mistakes will be made by some management teams that become too aggressive amid an environment that is still rife with uncertainty and it is our job to do our best to avoid those issues for our client portfolios. We are still positioning our portfolio in a more defensive manner than the market as a whole and we do not see that changing in the near term. Please feel free to contact us with any comments, questions or concerns. Thank you for your business and continued interest.

This information is intended solely to report on investment strategies identified by Cincinnati Asset Management. Opinions and estimates offered constitute our judgment and are subject to change without notice, as are statements of financial market trends, which are based on current market conditions. This material is not intended as an offer or solicitation to buy, hold or sell any financial instrument. Fixed income securities may be sensitive to prevailing interest rates. When rates rise the value generally declines. Past performance is not a guarantee of future results. Gross of advisory fee performance does not reflect the deduction of investment advisory fees. Our advisory fees are disclosed in Form ADV Part 2A. Accounts managed through brokerage firm programs usually will include additional fees. Returns are calculated monthly in U.S. dollars and include reinvestment of dividends and interest. The index is unmanaged and does not take into account fees, expenses, and transaction costs. It is shown for comparative purposes and is based on information generally available to the public from sources believed to be reliable. No representation is made to its accuracy or completeness.

i Wells Fargo Securities, September 30 2021 “Credit Flows | Supply & Demand: 9/23-9/29”
ii Bloomberg, September 30 2021 “IG ANALYSIS: CNO FABN Debut Leads Docket; $90-$100bn October”
iii Credit Suisse, September 13 2021 “CS Credit Strategy Daily Comment”
iv The Wall Street Journal, September 22 2021 “Fed Tees Up taper and Signals Rate Rises Possible Next Year”
v Federal Reserve Statistical Release, September 2 2021 “H. 4. 1 statistical release”

08 Oct 2021

CAM Investment Grade Weekly Insights

Spreads look to finish the week unchanged as Treasury yields inch higher.  The OAS on the Blomberg Barclays Corporate Index closed at 85 on Thursday October 7 after having closed the week prior at 84 but the market is trading tighter as we go to print mid-morning on Friday October 8.  Treasury yields have moved higher with each passing day throughout the week with the yield on the 10yr Treasury now above 1.6%, 14 basis points higher than where it finished the previous week.  Some of the move higher can be attributed to the payroll report on Friday morning, with early market commentary seeming to indicate it was “just barely okay enough” for tapering to begin as soon as the Fed meets in November.  However, it is worth noting that this was a big miss as payrolls increased by just 194,000 in September versus the 500,000 estimate – the smallest payroll gain thus far in 2021.  Through Thursday, the Corporate Index had posted a year-to-date total return of -1.67% and an excess return over the same time period of +1.82%.


The primary market saw good activity during the week with $27.6bln in new bonds having been brought to market.   Activity is likely to slow as earnings season begins and estimates are calling for around $15bln next week.  According to data compiled by Bloomberg, $1,149bln of new debt has been issued year-to-date.

Per data compiled by Wells Fargo, inflows into investment grade credit for the week of September 30–October 6 were +$804mm which brings the year-to-date total to +$305bln.

27 Aug 2021

CAM Investment Grade Weekly Insights

Spreads are set to finish the week tighter, reclaiming the move wider that occurred the week prior.  The OAS on the Blomberg Barclays Corporate Index closed Thursday August 26 at a spread of 88 after having closed last week at 91 –spreads are relatively unchanged as we go to print on Friday afternoon.  The yield on the 10yr Treasury moved higher throughout the week and is trading at 1.31% at the moment, 6 basis points higher than it closed the previous week.  Through Thursday, the Corporate Index had posted a year-to-date total return of -0.55% and an excess return over the same time period of +1.46%.

It was a very slow week for corporate issuance with just $3bln in volume.  This is quite typical for this time of year and we expect more of the same next week before the spigot gets turned back on after the Labor Day holiday. According to data compiled by Bloomberg, $962bln of new debt has been issued year-to-date.

Per data compiled by Wells Fargo, inflows into investment grade credit for the week of August 19–25 were +$5.9bln which brings the year-to-date total to +$270bln.

06 Aug 2021

CAM Investment Grade Weekly Insights

Spreads are set to finish the week wider to the tune of 1-2 basis points.  The OAS on the Bloomberg Barclays Corporate Index closed Thursday August 5 at a spread of 88 after having closed the week prior at 86.  We are going to print amid a positive market tone on this Friday morning after a strong unemployment report.  The yield on the 10yr Treasury traded higher this week but most of that move occurred this morning after the aforementioned employment report.  The 10yr closed last week at 1.22% and is trading at 1.28% at the moment.   Through Thursday, the Corporate Index had posted a year-to-date total return of +0.08% and an excess return over the same time period of +1.54%.


It was the busiest week for the new issue market in over 2 months according to Bloomberg, as weekly volume eclipsed $32bln.  Next week should also see brisk issuance before things slow down at the end of August for the last salvo of summer vacations. According to data compiled by Bloomberg, $909bln of new debt has been issued year-to-date.

We have seen more of a two-way flow in the market the past several weeks.  The reopening trade has lost some steam as investors weigh the risks of the delta variant.  For most of 2021, credits levered to reopening were in the midst of a one-way trade to tighter spreads and lower yields but those credits have seen mixed and in some cases poor performance in recent trading sessions.

Per data compiled by Wells Fargo, inflows into investment grade credit for the week of July 29–August 4 were +$5.7bln which brings the year-to-date total to +$247bln.


11 Jul 2021

2021 Q2 Investment Grade Quarterly

Investment grade corporate credit experienced positive performance during the quarter with a one-two punch of lower Treasury rates and tighter credit spreads. As a result, investors were able to claw back some of the losses that were incurred during the first quarter of 2021. The option adjusted spread (OAS) on the Bloomberg Barclays US Corporate Bond Index compressed 11 basis points during the quarter, opening at 91 and closing at 80.

Lower Treasury rates benefited returns during the quarter as the 10yr Treasury opened at 1.74%, drifting lower throughout the stanza before finishing at 1.47%. Recall that the 10yr moved 83 basis points higher during the first quarter which was the primary driver of negative performance during that period. The Corporate Index posted a total return of +3.55% during the second quarter. This compares to CAM’s gross quarterly total return of +2.78%. Through the first six months of 2021, the Corporate Index total return was -1.27%, while CAM’s gross year-to-date total return was -0.81%.

Portfolio Management & Positioning

We often find ourselves fielding questions from investors regarding the difference between our portfolio and the investment grade universe so we will walk through and refresh some of the ways that we differentiate. We build our investors highly customized separately managed accounts. Unlike a mutual fund or ETF, our clients know what they own within their portfolios down to the exact issuer and quantity. This is important for the individual investor because of the complete transparency it provides. Each individual account will be built with 20-25 positions. The invest-up period will occur over what we like to refer to as an abbreviated economic cycle, generally a period of 8-10 weeks that allows us to invest over a myriad of rate and spread environments.

Relative to the Bloomberg Barclays Corporate Index, we would best be described as “index aware” rather than looking to track or hug the benchmark. At the end of the day, we aim to provide our investors with a return that is as good or better than the Corporate Index but we would like to get there by taking less credit risk and less interest rate risk while incurring limited volatility along the way.

We manage credit risk through our bottom up research process. We thoroughly study each holding within the portfolio, evaluating individual credit metrics, looking to populate our investor portfolios with stable to improving credits that provide an opportunity to benefit from credit spread compression. Our composite consists of 100 issuers and 340 individual bond issues. The Corporate Index had 6,817 individual issues at the end of the second quarter, 4,290 of which would be classified as intermediate maturities, where we primarily invest. Simply put, we are highly selective while populating our investor portfolios and our research process dismisses a large percentage of the investable universe. We also have some hard and fast rules on the quality of our portfolio, the biggest of which is our 30% limitation to BAA-rated credit. BAA-rated bonds represent the riskier portion of the investment grade universe and the corporate index was 51.4% BAA-rated at the end of the second quarter, leaving CAM with a material underweight in lower quality credit relative to the index. Our up-in-quality bias allows us to target a solid A3 rating for each individual separately managed account.

As far as interest rate risk is concerned, we limit ourselves to intermediate maturities. During the invest-up period, we will populate new portfolios with maturities that range from 8 to 10 years. Then we will take advantage of the steepness of the 5/10 Treasury curve as well as the slope of the intermediate corporate credit curve, allowing those bonds to season, rolling down to the 5 year mark, at which point they will be ripe for sale and opportunistic redeployment of proceeds back into the 8-10 year range. This is one of the reasons we advise our investors to look at our portfolios with a 3-5 year time horizon, at a minimum, if they would like to get the most out of the strategy. As a result of our intermediate positioning, our composite modified duration at the end of the second quarter was 6.4 while the Corporate Index had a modified duration of 8.7.i We wrote at length on curves in our 1st quarter 2021 commentary and would encourage you to revisit if you would like to learn more.

As always, although we are attempting to maximize total return, the primary focus of our strategy is preservation of capital. We are not infallible but rarely will you see us pick up pennies in front of the proverbial steam roller to eke out a few extra basis points of return. Our decision process always comes down to risk and reward and although we will certainly take risks for the right reasons, our investors must be appropriately compensated.

Current Market Conditions

2020 will be a year that was remembered for liquidity runway, something that is not often associated with investment grade rated borrowers. Due to the uncertainty surrounding the depth and severity of the pandemic, we saw issuers rush to the new issue market in 2020 in an effort to bolster their balance sheets. In many cases, these were extremely high quality issuers who did not necessarily need to borrow, but at that time the mentality had become “borrow when you can, not when you have to”. Records for new issuance volume were shattered in 2020 as a result of this borrowing binge and the Corporate Index (excluding Financials) net leverage ratio rose from 2.5x at the end of Q1 2020 to 3.6x at the end of Q4 2020.ii There is evidence that the peak has passed as net leverage has since ticked down to 3.5x at the end of Q1 2021.iii It stands to reason that now, as North American economies are largely re-opened or getting more open by the day, we will continue to see an increase in earnings by those sectors most affected by the pandemic. There is reason to be optimistic about credit conditions as earnings rebound, borrowing abates and debt pay down follows suit. That said there are several risks that continue to loom through 2021 and beyond: lingering worries regarding inflation, Federal Reserve tapering and tight spread valuations amid a backdrop of eager lenders.

The first two risks really go hand in hand –mounting inflationary pressures and the associated FOMC response. It is likely that each of our readers has experienced price increases in one way or another but the Fed insists that much of these will be “transitory” in nature. We tend to agree with the Fed on this one and we revert to the official definition of inflation which is an unrelenting broad-based and sustainable increase in prices across the board. We, like the Fed, would argue that just because the cost of some goods have increased due to things like inventory and production shortages or a disruption of the semiconductor supply chain, it does not mean the table is set for runaway inflation. We believe that as inventory levels are right-sized and household balance sheets deploy excess capital, supply and demand will find equilibrium over time. Additionally, there are still millions of Americans that are unemployed and as federal unemployment assistance reverts to more normalized historical levels it will result in easing price pressures as workers rejoin the labor force. As far as the FOMC response is concerned, the results from the June meeting showed that the median projection is for an unchanged Fed funds rate in 2021 and 2022 with two rate hikes in 2023. While rate hikes are important for the front end of the yield curve, it is tapering that is the more immediate concern, in our view. We argue that technically the Fed has already begun tapering with its exit from the corporate bond market and the sale of its holdings which began in June of this year.iv Its corporate bond holdings, however, were miniscule in the grand scheme of things, at less than $14 billion total. Much larger pieces to this puzzle are its monthly purchases of Treasury securities at $80 billion and mortgage-backed securities at $40 billion. The Fed has yet to supply a timeline of when it will start to normalize its policy, perhaps dialing back on these purchases, but the market is now expecting a possible announcement on tapering at the end of August during the Fed’s Jackson Hole policy symposium. We think that the Fed will continue to be deliberate and cautious in its messaging and that it will be able to avoid a taper-tantrum like event, but we do acknowledge the risks associated with this view.

As far as the credit market goes, we do have some concerns about current valuations in some portions of the market but we also believe spreads can go tighter from here, especially in more non-discretionary sectors. The areas of uneasiness are largely corners of the market that are highly levered to reopening such as automotive, unsecured airlines, leisure, gaming, lodging and restaurants. The bonds of many of these companies are priced to perfection and some of the companies have borrowed to fund their way through the pandemic. It will take time to repair these balance sheets and unless the rosiest of reopening scenarios come to fruition these companies will not be able to remain investment grade rated entities. We are taking little to no exposure for our portfolio in these areas and ironically they have been some of the best performing portions of the bond market year to date. This illustrates our point about lenders and investors that are perhaps too eager to lend to such entities and what we would classify as classic “reach” in the search for yield. We may sacrifice some near term performance by not participating in these riskier areas of the market but we manage the portfolio with an eye on the long term and will continue to do so. While there is a risk that we could be wrong and these sectors will in fact live up to the most optimistic predictions, we remain skeptical.

Halfway Home

We have a sense of guarded optimism as we enter the second half of the year but risks remain. Unfortunately, the pandemic is not over and continues to rage on in some portions of the world. Thankfully, vaccination progress has the potential to achieve global normalization over the course of the next year, but variants and vaccine-resistant strains could threaten this timeline. The FOMC will remain in the spotlight as it attempts to manage investor expectations and craft its moves carefully. We at CAM plan to stick to the script. We will not be making wholesale changes to our strategy and we will likely be taking less risk than usual in the coming months given the current risk reward backdrop we are seeing in our market. Please reach out to us with any questions or concerns. We thank you for your continued interest and for placing your trust and confidence in us to manage your money.

This information is intended solely to report on investment strategies identified by Cincinnati Asset Management. Opinions and estimates offered constitute our judgment and are subject to change without notice, as are statements of financial market trends, which are based on current market conditions. This material is not intended as an offer or solicitation to buy, hold or sell any financial instrument. Fixed income securities may be sensitive to prevailing interest rates. When rates rise the value generally declines. Past performance is not a guarantee of future results. Gross of advisory fee performance does not reflect the deduction of investment advisory fees. Our advisory fees are disclosed in Form ADV Part 2A. Accounts managed through brokerage firm programs usually will include additional fees. Returns are calculated monthly in U.S. dollars and include reinvestment of dividends and interest. The index is unmanaged and does not take into account fees, expenses, and transaction costs. It is shown for comparative purposes and is based on information generally available to the public from sources believed to be reliable. No representation is made to its accuracy or completeness.

i A representative sample of a newly invested individual separately managed account had a modified duration of 8.4 at 06/30/2021
ii Barclays, June 23 2021 “US Investment Grade Credit Metrics Q1 21 Update”
iii Barclays, June 23 2021 “US Investment Grade Credit Metrics Q1 21 Update”
iv Reuters, June 2 2021 “NY Fed says it will begin to sell corporate bond ETFs on June 7”