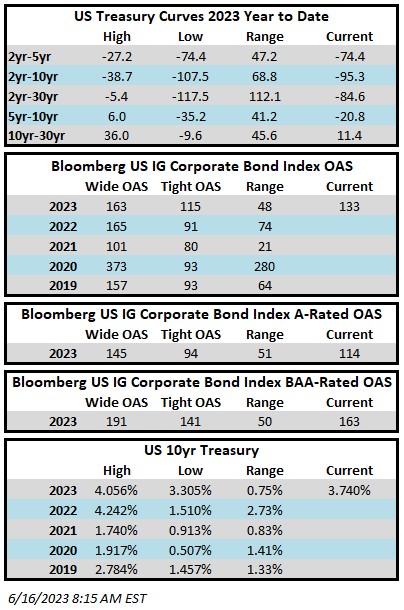
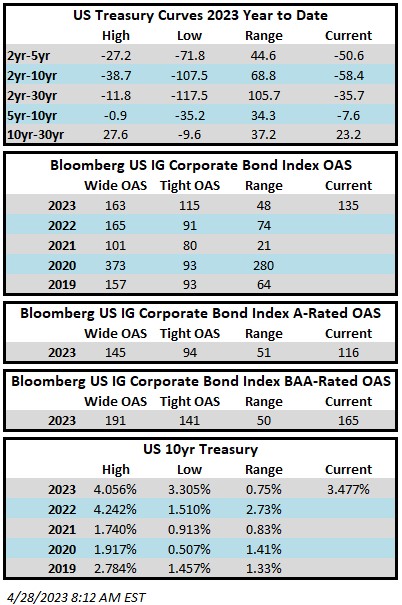
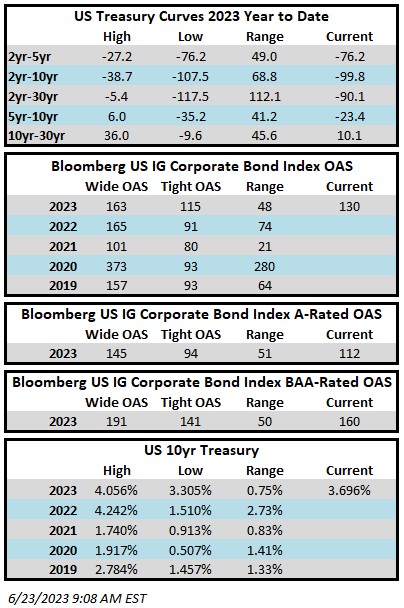
Investment grade credit spreads continued to inch tighter this week. The Bloomberg US Corporate Bond Index closed at 130 on Thursday June 22 after having closed the week prior at 131. This is the tightest level for the index in over three months. The investment grade credit market is flat amid muted volume this Friday morning. The 10yr Treasury is currently 3.7% which is 6 basis points lower than where it closed last week. Through Thursday June 22 the Corporate Index had a YTD total return of +2.77%.
It was an extremely light week for economic data with only a few meaningful releases. Housing starts were a big surprise on Tuesday, smashing expectations to the upside. It was the biggest surge for starts since 2016. On Thursday, existing home sales came in line relative to expectations. We await global PMI data later this morning. Jerome Powell spoke at length this week, indicating that the US may need one or two more rate hikes in 2023 while Treasury Secretary Janet Yellen looked to quell concerns over a US recession. The biggest news of the week came across the pond on Thursday with the BOE taking the market by surprise, raising its benchmark interest rate by 50bps. This move spooked bond and stock investors in our markets sparking a rally in Treasuries and a sell-off in equities as investors are increasingly concerned about the economic consequences of aggressive rate hikes by central banks around the globe.
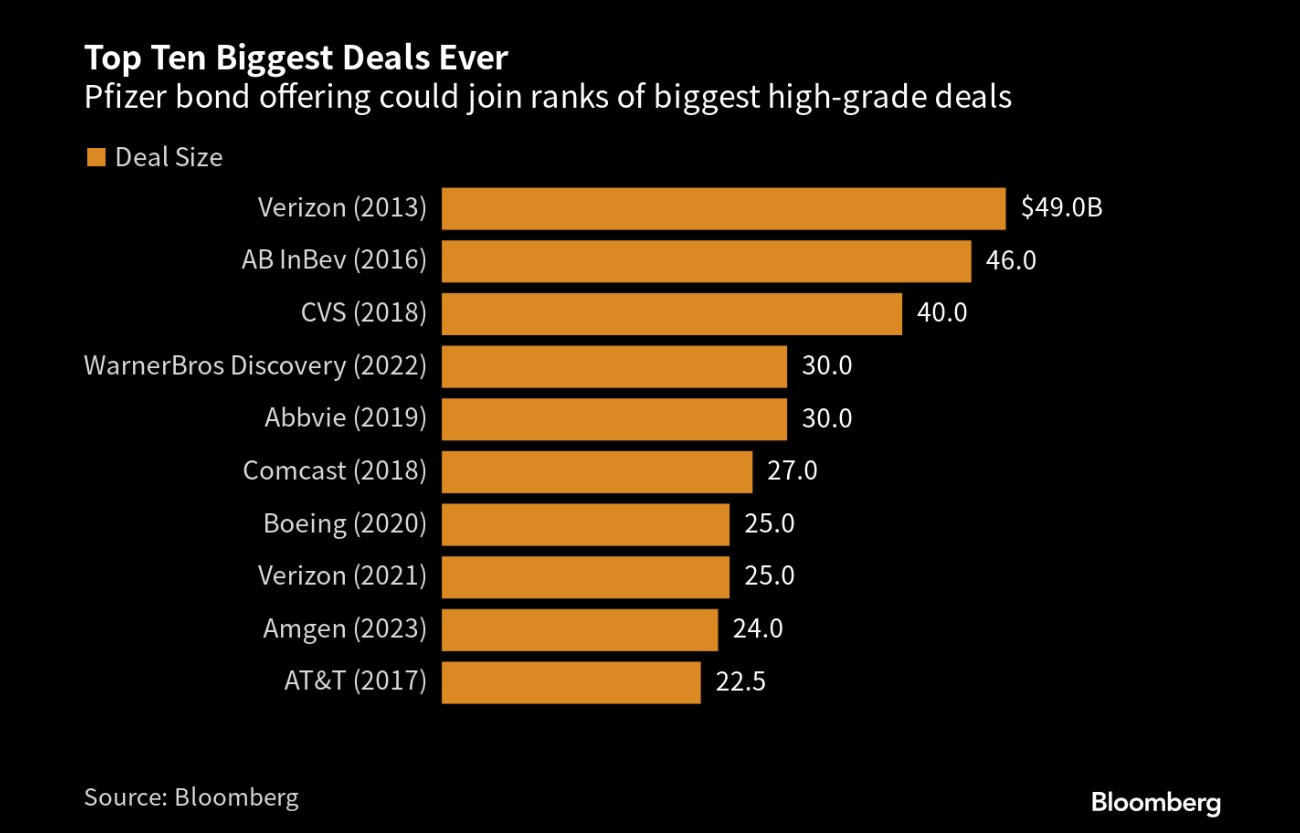
Issuance was light in this holiday shortened week but in-line with expectations as $15.4bln of new debt was priced. The street is looking for a similar figure next week. Issuance for the month of June has topped $76bln and year-to-date issuance is $686.8bln. YTD issuance modestly trails 2022’s pace by -3%.
According to Refinitiv Lipper, for the week ended June 23, investment-grade bond funds collected more than +$2.17bln of cash inflows. This continues the trend of strong inflows into the investment grade asset class.
This information is intended solely to report on investment strategies identified by Cincinnati Asset Management. Opinions and estimates offered constitute our judgment and are subject to change without notice, as are statements of financial market trends, which are based on current market conditions. This material is not intended as an offer or solicitation to buy, hold or sell any financial instrument. Fixed income securities may be sensitive to prevailing interest rates. When rates rise the value generally declines. Past performance is not a guarantee of future results.