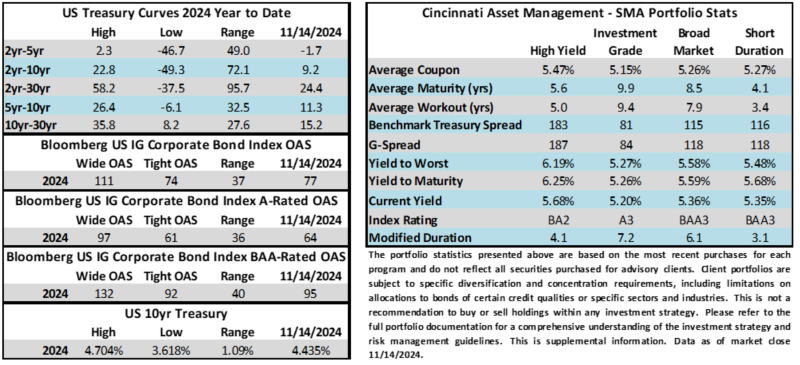
Author: Josh Adams - Portfolio Manager

30 Aug 2024

CAM Investment Grade Weekly Insights

Credit spreads exhibited little change during the week before Labor Day.  The Bloomberg US Corporate Bond Index closed at 94 on Thursday August 29 after closing the week prior at the same level.  The 10yr Treasury yield was slightly higher throughout this week, up 6 basis points from last week through Thursday’s close.  Through Thursday, the corporate bond index year to date total return was +3.77%.

Economics

There were several big data releases this week but all were within the realm of expectations.  Durable goods orders surprised to the upside on Monday but it was driven almost entirely by aircraft which can be volatile.  GDP too came in slightly higher than expectations amid resilient consumer spending.  Finally, on Friday morning we got the Fed’s preferred inflation gauge.  It was a relatively good print for PCE that along with revisions showed that moderating inflation is trending in the right direction, inching closer to the Fed’s 2% target.  Next week has some reasonably meaningful economic releases including the employment report on Friday which is the last big data point ahead of the next FOMC meeting on September 18.

Issuance

Companies priced just $2.05bln of new debt this week across a handful of small deals.  Syndicate desks are predicting $125bln of new issue volume for the month of September.  In 2023, borrowers priced $55bln during the first week of September and 2024’s haul could be similar, with a flurry of activity expected right out of the gate.  The year-to-date issuance total now stands at $1.094 trillion.

Flows

According to LSEG Lipper, for the week ended August 28, investment-grade bond funds reported a net inflow of +$1.76bln.  Short and intermediate investment-grade bond funds have seen positive flows 29 of the past 35 weeks.  The total year-to-date flows into investment grade funds are +$46.81bln.

This information is intended solely to report on investment strategies identified by Cincinnati Asset Management. Opinions and estimates offered constitute our judgment and are subject to change without notice, as are statements of financial market trends, which are based on current market conditions. This material is not intended as an offer or solicitation to buy, hold or sell any financial instrument. Fixed income securities may be sensitive to prevailing interest rates. When rates rise the value generally declines. Past performance is not a guarantee of future results.

23 Aug 2024

CAM Investment Grade Weekly Insights

Credit spreads drifted sideways this week and are looking to finish the period just slightly tighter.  The Bloomberg US Corporate Bond Index closed at 95 on Thursday August 22 after closing the week prior at 96.  The 10yr Treasury yield was little changed from the week prior, less than 3 basis points lower week over week through Thursday.  Through Thursday, the corporate bond index year to date total return was +3.63%.


Economics

It was a light week for economic releases.  There was a BLS payrolls revision on Wednesday that showed that job growth over most of the past year was lighter than expected but this was not a market moving event.  FOMC meeting minutes, jobless claims that were mostly inline and a S&P PMI print that beat expectations rounded things out but none were particularly meaningful for market direction.  As we go to print this Friday morning, Jerome Powell is just beginning to deliver his policy speech at the Jackson Hole Economic Symposium and his prepared remarks indicate that the Fed is nearly ready to begin cutting its policy rate.  Next week things ramp up with durable goods on Monday, GDP on Wednesday and income/spending data along with PCE data on Friday.

Issuance

It was a strong week for issuance considering that the second half of August is typically seasonally slow.  Investment grade companies priced nearly $23bln of new debt with Kroger leading the way as it priced a $10.5bln seven-part jumbo deal to prefund a portion of the cash component for its potential acquisition of Albertsons.  Next week syndicate desks are looking for less than $5bln of new debt and $0 is a real possibility as the week before Labor Day is nearly always one of the quietest of the year for the primary market.  The year-to-date issuance total now stands at $1.091trln, +27% ahead of 2023’s pace.

Flows

According to LSEG Lipper, for the week ended August 21, investment-grade bond funds reported a net outflow of -$0.345bln.  Short and intermediate investment-grade bond funds have seen positive flows 28 of the past 34 weeks.  YTD flows into IG stand at +$45.05bln.


This information is intended solely to report on investment strategies identified by Cincinnati Asset Management. Opinions and estimates offered constitute our judgment and are subject to change without notice, as are statements of financial market trends, which are based on current market conditions. This material is not intended as an offer or solicitation to buy, hold or sell any financial instrument. Fixed income securities may be sensitive to prevailing interest rates. When rates rise the value generally declines. Past performance is not a guarantee of future results.


16 Aug 2024

CAM Investment Grade Weekly Insights

Credit spreads initially moved wider this week on Monday before snapping tighter throughout the rest of the period.  The Bloomberg US Corporate Bond Index closed at 96 on Thursday August 15 after closing the week prior at 102.  The 10yr Treasury yield experienced some meaningful intraday moves throughout the week but was little changed from the week prior, only 3 basis points lower through Thursday.  Through Thursday, the corporate bond index year to date total return was +3.11%.


Economics

There was plenty of action this week with a bevy of economic releases.  PPI on Tuesday and CPI on Wednesday both came in slightly below estimates, indicating that slowing inflation has maintained its momentum.  On Thursday morning, retail sales data for July came in much better than expected, although the control group posted just a modest gain that showed deceleration in control group spending from June to July.  Still, there was little in the retail sales print that indicated that the economy was anywhere near a consumer-led recession during the month of July leaving open the possibility of a soft landing.  Friday also saw a positive print for consumer sentiment data which saw an increase in sentiment for the first time in five months.  Next week’s economic docket is extremely light but there is plenty of action to come in the weeks that follow. Looking ahead, we await Jerome Powell’s policy speech at The Jackson Hole Economic Symposium on August 23rd, followed by core PCE release on August 30th.  On September 6th we will get the August employment report followed by a CPI print on the 11th which could set the table for the beginning of an easing cycle with an FOMC decision on September 18th.

Issuance

It was a solid week for corporate credit issuance as borrowing companies sold $29bln in new debt.  Monday in particular was a busy day as 16 companies priced more than $18bln of new bonds across dozens of maturity bands.  The last two weeks of August are typically seasonally slow but syndicate desks are looking for $20bln in new debt next week.  The backdrop for borrowers remains favorable amid strong investor demand for high quality risk assets at yields that remain elevated relative to the recent past.  The year-to-date issuance tally continues to push well ahead (+26%) of 2023’s pace and 2024 volume has now topped $1,068bln.

Flows

According to LSEG Lipper, for the week ended August 14, investment-grade bond funds reported a net inflow of +$1.14bln.  Short and intermediate investment-grade bond funds have seen positive flows 28 of the past 33 weeks.  YTD flows into IG stand at +$45.4bln.


This information is intended solely to report on investment strategies identified by Cincinnati Asset Management. Opinions and estimates offered constitute our judgment and are subject to change without notice, as are statements of financial market trends, which are based on current market conditions. This material is not intended as an offer or solicitation to buy, hold or sell any financial instrument. Fixed income securities may be sensitive to prevailing interest rates. When rates rise the value generally declines. Past performance is not a guarantee of future results.

02 Aug 2024

CAM Investment Grade Weekly Insights

Credit spreads were meaningfully wider on the week while Treasuries rallied, sending yields lower.  The Bloomberg US Corporate Bond Index closed at 98 on Thursday August 1 after closing the week prior at 93.  The 10yr Treasury yield traded through its previous YTD low of 3.88% from back in January and it is trading at 3.85% this Friday morning.  This is after the 10yr benchmark closed last week at 4.19%. Through Thursday, the corporate bond index YTD total return was +2.16% while the yield-to-maturity for the benchmark was 5.10%.

Economics

It was a big week for data with all eyes on the Fed Wednesday afternoon.  The FOMC elected not to move its policy rate, as expected, and chairman Powell hinted at the fact that near term cuts could be on the horizon as soon as the September meeting.  What really threw markets into a tizzy was the NFP release on Friday morning which was a big miss to the downside.  As of the time we are going to print this morning the numbers are quite volatile.  Treasury curves are at their steepest levels of the 2024 and equity futures have fallen off a cliff.  The market narrative has quickly shifted from questioning if and when we would get a cut at all in 2024 to pondering 3 or 4 cuts.   Some market participants are now even calling for a 50bp cut at the September meeting for fear that the economy is slowing too rapidly. We would point out that this is only one job report, and by the way, the economy is still adding jobs not shedding them.  While the Sahm rule has been triggered, the unemployment rate still remains low by historical standards.  We have always been in the camp that expects a modest recession at some point and this jobs print could be the first step to that end but it is merely one data point.  One thing is certain, the market will have plenty of time to speculate between now and the FOMC’s next meeting on September 18th.  It could be a long month and a half!

Issuance

It was once again another solid week for summer issuance as companies sold $31bln in new bonds.  It ended up as the highest volume July for issuance since 2017 and the second busiest ever.  Syndicate desks are looking for $40bln of new supply next week but that is contingent on a pull back in some of the volatility that the rates markets are experiencing this morning.  Even with spreads off their tights, CFOs and treasurers that were planning to borrow are likely excited at the prospect of lower Treasury yields which mean lower interest expense on new debt.  The year-to-date issuance tally has now climbed to $995bln.  For context, the $1 trillion mark was not reached until October during 2023 and 2022 according to Bloomberg.

Flows

According to LSEG Lipper, for the week ended July 31, investment-grade bond funds reported a net inflow of +$1.79bln.  Short and intermediate investment-grade bond funds have seen positive flows 26 of the past 31 weeks.  YTD flows into IG stand at +$42.5bln.

This information is intended solely to report on investment strategies identified by Cincinnati Asset Management. Opinions and estimates offered constitute our judgment and are subject to change without notice, as are statements of financial market trends, which are based on current market conditions. This material is not intended as an offer or solicitation to buy, hold or sell any financial instrument. Fixed income securities may be sensitive to prevailing interest rates. When rates rise the value generally declines. Past performance is not a guarantee of future results.

26 Jul 2024

CAM Investment Grade Weekly Insights

Credit spreads were modestly wider on the week.  The Bloomberg US Corporate Bond Index closed at 93 on Thursday July 25 after closing the week prior at 91.  The 10yr Treasury yield was slightly lower on the week at press time, trading at 4.21% this Friday morning after closing last week at 4.24%. Through Thursday, the corporate bond index YTD total return was +0.61% while the yield-to-maturity for the benchmark was 5.32%.


Economics

It was quite a busy week for economic releases but most of what we got was in line with expectations with the exception of GDP which came in meaningfully better than consensus.  The biggest print of the week was the Fed’s preferred inflation gauge on Friday which showed that inflation rose at a timid pace in June while consumer spending held up well but not too well.  Traders viewed this as a print that keeps the hope alive for a soft landing as well as a likely cut in the Fed’s policy rate at its September meeting.  Next week is busy too with consumer confidence and ISM data as well as a FOMC rate decision on Wednesday and the June Employment report capping things off on Friday morning.  Interest rate futures as of this Friday morning are pricing a 95+% chance that the Fed holds the policy rate steady next week.

Issuance

It was a solid week for new supply with $29.5bln of new debt hitting the market, although this fell short of the $35bln estimate.    UnitedHealth led the way, pricing a $12bln issue to fund M&A, the 4th largest deal of 2024.  Occidental Petroleum also priced a chunky $5bln new deal.  Next week syndicate desks are looking for $25bln of new debt.  If that figure comes to pass then this July will rank among the busiest ever and will challenge the record that was set for July in 2017 when companies priced $122bln.  July can often be a slow month for new issue supply but this year has been anything but.  The year-to-date issuance tally has now climbed to $964bln which is more than 25% ahead of where things stood at this point last year.

Flows

According to LSEG Lipper, for the week ended July 24, investment-grade bond funds reported a net outflow of -$0.034bln.  Short and intermediate investment-grade bond funds have seen positive flows 25 of the past 30 weeks.  YTD flows into IG stand at +$39.8bln.

This information is intended solely to report on investment strategies identified by Cincinnati Asset Management. Opinions and estimates offered constitute our judgment and are subject to change without notice, as are statements of financial market trends, which are based on current market conditions. This material is not intended as an offer or solicitation to buy, hold or sell any financial instrument. Fixed income securities may be sensitive to prevailing interest rates. When rates rise the value generally declines. Past performance is not a guarantee of future results.

19 Jul 2024

CAM Investment Grade Weekly Insights

Credit spreads were a touch wider on the week.  The Bloomberg US Corporate Bond Index closed at 91 on Thursday July 18 after closing the week prior at 89.  The 10yr Treasury yield was slightly higher on the week, trading at 4.24% this Friday morning after closing last week at 4.18%. Through Thursday, the corporate bond index YTD total return was +1.14% while the yield-to-maturity for the benchmark was 5.26%.


Economics

It was a lighter week for economic data.  The only print that was especially meaningful was retail sales on Tuesday which came in better than expected.  However, a closer look does show some spending components are slowing, especially for consumers at the lower end of the income distribution.  Still, it remains difficult to bet against the U.S. consumer which has continued to defy expectations for most of the past few years.  Next week brings plenty of action with big economic releases in GDP, consumption, durable goods, income/spending and PCE to name a few.  Earnings start to ramp next week with 192 IG-rated companies reporting with a further 256 reporting the ensuing week.  The Fed meets at the end of the month and the market has coalesced around the idea of a pause in July and a cut in September.  The Fed does not meet in August.

Issuance

It was a much busier week than expected in the investment grade primary market as companies sold almost $45bln of new debt.  The top of end of the forecasted range was just $30bln.  The banking sector led the way this week as those firms were eager to issue debt on the back of solid earnings.  Money center banks issued $24.5bln and regionals issued more than $6bln.  Next week is the last decent issuance-window for a few weeks and syndicate desks are looking for $35bln in new supply.  Year-to-date issuance has now topped $934bln which is more than +26% ahead of where things stood at this point last year.

Flows

According to LSEG Lipper, for the week ended July 17, investment-grade bond funds reported a net inflow of +$1.3bln.  Short and intermediate investment-grade bond funds have seen positive flows 25 of the past 29 weeks.  YTD flows into IG stand at +$39.9bln.


This information is intended solely to report on investment strategies identified by Cincinnati Asset Management. Opinions and estimates offered constitute our judgment and are subject to change without notice, as are statements of financial market trends, which are based on current market conditions. This material is not intended as an offer or solicitation to buy, hold or sell any financial instrument. Fixed income securities may be sensitive to prevailing interest rates. When rates rise the value generally declines. Past performance is not a guarantee of future results.

15 Jul 2024

2024 Q2 Investment Grade Quarterly

Spanish version coming soon

The second quarter of the year was similar to the first. Credit spreads remained in a tight range and stubbornly higher Treasury yields continued to be a thorn in the side of total returns. Investors have begun to accept that the bar for an easing cycle is high though the data has been more cooperative lately in helping the Fed to reach that goal. We continue to believe that the current environment is opportunistic for bond investors but it may require patience. IG credit will likely be a carry trade until the Fed starts to move the policy rate lower. Elevated yields and higher coupons could be a boon for investors that use bonds as a mechanism to preserve capital.

Second Quarter Review

The option adjusted spread (OAS) on the Bloomberg US Corporate Bond Index opened the second quarter at 90 and traded as tight as 85 in early June before finishing the quarter at a spread of 94. Recall that the index began 2024 at a spread of 99 and briefly traded as wide as 105 in early January before it started its march tighter. Spreads traded in a narrow band during the second quarter where the corporate OAS for the index was rangebound to the tune of only 10 basis points during the period.

Treasury yields continued to grind higher in the second quarter which has been the principal reason that year-to-date total returns for the IG index were modestly negative. Yields were higher during the first quarter and that theme continued during the second quarter.

The below chart is illustrative of where Treasury yields were prior to and during the coronavirus pandemic –meaningfully lower back then relative to the present.

Corporate issuance remained strong during the second quarter but could not keep up with the record-breaking pace of the first quarter. Year-to-date new issue volume was $867 billion at the end of the second quarter. There are several reasons behind the robust environment for issuance and companies’ eagerness to issue debt. On the demand side inflows for the investment grade asset class have been strong with over $200bln into taxable bond funds through the end of May (June flow data was not yet available at the time of publication). Additionally, insurance companies have been strong buyers of bonds on the back of premium rate increases and pension funds have been allocating to a variety of fixed income asset classes as they look to rebalance their portfolios to account for strong equity performance in 2023 and the first half of 2024. Foreign buyers have also been participating in the US corporate market as the ECB and some other central banks in Europe and elsewhere have started to ease by cutting their policy rates which has made dollar-denominated bonds more attractive than the bonds of some other currencies. From the standpoint of borrowers although the all-in yields that they are paying are elevated compared to the recent past spreads are snug. Most investment grade balance sheets are healthy enough to borrow at current rates and the cost of debt is reasonable and within capital allocation frameworks for many stronger companies. Another factor driving issuance is future uncertainty: many management teams would rather borrow funds now in a relatively low volatility environment. A US presidential election, a potential Fed easing cycle, and an economy that could start to show the strain of higher rates could make it more difficult or expensive to access capital in the second half of the year.

Investment grade credit metrics remained on solid footing at the end of the first quarter. EBITDA margins were very close to all-time highs and EBITDA growth was still positive albeit at a slower pace than the previous quarter. It wasn’t all rosy though as cash balances fell slightly and net leverage increased which had a negative impact on interest coverage. We feel quite good about the health of IG corporate credit broadly speaking but as an active manager we seek to invest in companies with stable or improving credit metrics and eschew those that are struggling to perform.

Fed Update – Still on Hold

Investor views have evolved and they are now in a much more realistic place with regard to a potential easing cycle relative to where they started the year. Recall that back then interest rate futures markets were implying as many as seven 25bp rate cuts. The Fed’s own projections have been more pragmatic than investors. The Fed dot plot median consensus showed expectations for 3 rate cuts at its December 2023 update and then again at its March 2024 update. The Fed tempered its expectations in June 2024 with a further adjustment to the dots that showed a close call between one or two cuts in the second half of 2024. Out of the 19 FOMC members, eight expected two cuts, seven projected one, and four believe that there will be none at all. Investors have acquiesced and interest rate futures at the end of the second quarter showed a 56% probability of a cut in July and a 75% probability of a cut in December. The Fed would love to join the list of central banks that have cut rates that includes the ECB, Canada, Czech Republic, Hungary, Sweden, and Switzerland but this is a FOMC that understands and appreciates the mistakes of the past. We continue to expect one or two cuts in 2024 although we would note that there are only four opportunities left for this to happen because the FOMC does not meet in August or October. We continue to believe that the longer the Fed waits to cut the more likely it will result in an economic slowdown and we are managing the portfolio with this in mind.

Coupon vs. Total Return

With the Fed in a holding pattern what does it mean for investment grade credit? We believe that it has created an environment where the bulk of investor returns in the near term will come in the form of coupon while they are paid to wait for the likely start of an easing cycle and yield curve normalization. The average coupon on the index at the end of the second quarter was 4.2% up from 3.9% and 3.6% at the end of June 2023 and June 2022 respectively. But this does not tell the whole story as the coupon for intermediate maturity debt that is being issued today is virtually guaranteed to have a higher coupon than the average which is artificially low due to the amount of debt that issued during the era of ultra-low interest rates. A better way to look at the coupon available to investors in the market today is to use the average yield to maturity (YTM%) for the index as a proxy for coupon. Average YTM% finished the second quarter at 5.48% which is a good approximation of what it would cost an average investment grade rated company to issue debt today.

We have beaten the drum on this point for the past few quarters: as the above chart illustrates there have been limited opportunities during the past decade for investors to deploy capital at these yields and coupons. In a simplified example if an investor has a bond portfolio with an average coupon of 5% and the prices of the bonds in that portfolio do not change at all during the year then that investor earns a one-year total return of 5% in the form of coupon income. A coupon above 5% for IG credit is very attractive in our view and provides the investor with a good chance to generate positive total returns over time as well as a higher degree of downside protection that was unavailable a few years ago when interest rates were much lower.

Spreads vs. Yields

Although yields are near the high end of their historical range spreads are near the tight end. The following two charts show the level of spreads for the index as well as the percentage of the portion of the index yield that is represented by credit spread. For example if an investor buys an investment grade corporate bond at a spread of 100 basis points over the 10yr Treasury at 4.40% then the yield for that corporate bond is 5.40% and 18.5% of that yield is from credit spread. Tight spreads and elevated Treasury yields have created an environment where a relatively small portion of an investor’s overall compensation is derived from spread today.

Credit spread is the compensation an investor receives in exchange for taking the credit risk of owning a corporate bond versus taking no credit risk at all for owning the underlying Treasury (the risk-free rate). There are a few reasons that spreads are tight today. First and foremost financial conditions for investment grade rated borrowers are good and we discussed some of those metrics earlier in this note. Secondly, the default rate for investment grade rated companies has historically been exceedingly low so it is typical for spreads to be tight when the economy is growing and corporate balance sheets are healthy. Finally an environment of elevated Treasury yields can lend itself to tight credit spreads. This is because there is a large base of buyers in the investment grade market that care more about all-in yields than they do about spreads. These investors may have a yield bogey or a hurdle rate that they need to clear for an investment making them agnostic about spreads but more sensitive to yields. As professional bond managers spreads are very important to us because we use them to assess the relative value of individual bonds when we evaluate them for purchase or for sale. Whether you care about spread yield or both; the bottom line is that investors are currently being well compensated for owning IG credit in the form of coupon and yield even if spreads are tight.

Second Half Outlook

The second half of the year could be volatile with several big events on the horizon. For the first time in a while we are starting to see pockets of legitimate economic uncertainty. On one hand the economy has been resilient. But questions remain about the ability for economic perseverance in the face of an extended financial tightening cycle that began in March of 2022. The consumer drives the US economy and they have kept spending but how long can they continue to do so now that excess savings have been exhausted and with a current savings rate that has been steadily negative? Labor market data has weakened slightly in recent months but the unemployment rate is still near the low end of its historical range. We are not one to cry wolf and we do not think we are on the brink of economic malaise but we see a lot less room for error today for the economy than at any point since before 2020. Many consumers are stretched with little cushion and a pullback in wages and/or employment could tip the economy into a recession.
Given this backdrop we are populating investor portfolios accordingly and are seeking to avoid companies and industries that are discretionary in nature. We are still taking appropriate risks but only if the compensation is commensurate. Thank you for our continued interest. We look forward to collaborating with you as we navigate the credit markets together. As always please reach out with any questions or topics for discussion.

This information is intended solely to report on investment strategies identified by Cincinnati Asset Management. Opinions and estimates offered constitute our judgment and are subject to change without notice as are statements of financial market trends which are based on current market conditions. This material is not intended as an offer or solicitation to buy hold or sell any financial instrument. Fixed income securities may be sensitive to prevailing interest rates. When rates rise the value generally declines. Past performance is not a guarantee of future results. Gross of advisory fee performance does not reflect the deduction of investment advisory fees. Our advisory fees are disclosed in Form ADV Part 2A. Accounts managed through brokerage firm programs usually will include additional fees. Returns are calculated monthly in U.S. dollars and include reinvestment of dividends and interest. The index is unmanaged and does not take into account fees expenses and transaction costs. It is shown for comparative purposes and is based on information generally available to the public from sources believed to be reliable. No representation is made to its accuracy or completeness.

The information provided in this report should not be considered a recommendation to purchase or sell any particular security. There is no assurance that any securities discussed herein will remain in an account’s portfolio at the time you receive this report or that securities sold have not been repurchased. The securities discussed do not represent an account’s entire portfolio and in the aggregate may represent only a small percentage of an account’s portfolio holdings. It should not be assumed that any of the securities transactions or holdings discussed were or will prove to be profitable or that the investment decisions we make in the future will be profitable or will equal the investment performance of the securities discussed herein. As part of educating clients about CAM’s strategy we may include references to historical rates and spreads. Hypothetical examples referencing the level of, or changes to, rates and spreads are for illustrative and educational purposes only. They are not intended to represent the performance of any particular portfolio or security, nor do they include the impact of fees and expenses. They also do not take into consideration all market and economic conditions that influence our decision-making. Therefore, client accounts may or may not experience scenarios similar to those referenced herein.

Additional disclosures on the material risks and potential benefits of investing in corporate bonds are available on our website: https://www.cambonds.com/disclosure-statements/

i Bloomberg, June 28 2024 “High-Grade Bond Sales on Easter Pause After Record First Quarter”

ii Bloomberg WIRP, March 29 2024 “Fed Funds Futures”

iii Bloomberg WIRP, June 29 2024 “Fed Funds Futures”

iv Raymond James & Associates, June 28 2024 “Fixed Income Spreads”

v Barclays Bank PLC, June 13 2024 “US Investment Grade Credit Metrics, Q2 2024 Update: No Concerns”

vi J.P. Morgan, July 3 2024 “US High Grade Corporate Bond Issuance Review”

vii Bloomberg ILM3NAVG Index, June 28 2024 “Bankrate.com US Home Mortgage 30 Year Fixed National Avg”

viii CNBC, June 13 2024 “The Federal Reserve’s period of rate hikes may be over. Here’s why consumers are still reeling”

28 Jun 2024

CAM Investment Grade Weekly Insights

Credit spreads were little changed during the week.  The Bloomberg US Corporate Bond Index closed at 94 on Thursday June 27 after closing the week prior at the same level.  The 10yr Treasury yield is slightly higher on the week, trading at 4.33% this Friday afternoon after closing last week at 4.26%. Through Thursday, the corporate bond index YTD total return was -0.02% while the yield-to-maturity for the benchmark was 5.43%.

Economics

Economic data this week was mostly in line with consensus and there were no major surprises.  Highlights included a consumer confidence reading that was slightly below expectations and personal income data that came in slightly above expectations.  The biggest release this week was Friday morning’s PCE price index which was about as consistent with expectations as it possibly could be.  The release showed that the disinflationary environment sustained some momentum during May but it was probably not enough to make the Fed turn dovish.  Continued progress will be needed if the Fed expects to follow through with two cuts in the latter half of the year.  Next week is another disjointed one with several important releases early in the week (PMI, ISM manufacturing/services and durable goods) followed by a market holiday on Thursday in observance of Independence Day.  The biggest release of the week occurs on Friday morning with the employment report for the month of June.  Looking ahead, the Fed does not meet again until the very end of July.

Issuance

The IG primary market was strong this week as borrowers priced nearly $32bln in new debt, well ahead of the $20bln estimate.  More than half of this week’s volume was from borrowers outside the U.S., with Asia Pacific firms and governments leading the way.  So, although issuance was robust, it wasn’t coming from borrowers that are necessarily household names.  Next week syndicate desks are looking for a quiet week with just $5bln of issuance and only $80bln of issuance for the seasonally slow month of July (that estimate would make it the lowest volume month so far in 2024).  According to sources compiled by Bloomberg, after a record first quarter, the pace of issuance in 2024 slowed during the second quarter making 2024 the second busiest first half to a year on record.  It was eclipsed only by the surge in borrowing that occurred during the trading days that followed the official onset of the 2020 pandemic.


Flows

According to LSEG Lipper, for the week ended June 26, investment-grade bond funds reported a net inflow of +$0.389bln.  Short and intermediate investment-grade bond funds have seen positive flows 23 of the past 26 weeks.  YTD flows into IG stand at +$37.2bln.


This information is intended solely to report on investment strategies identified by Cincinnati Asset Management. Opinions and estimates offered constitute our judgment and are subject to change without notice, as are statements of financial market trends, which are based on current market conditions. This material is not intended as an offer or solicitation to buy, hold or sell any financial instrument. Fixed income securities may be sensitive to prevailing interest rates. When rates rise the value generally declines. Past performance is not a guarantee of future results.

21 Jun 2024

CAM Investment Grade Weekly Insights

Credit spreads moved incrementally wider for the second consecutive week. The Bloomberg US Corporate Bond Index closed at 94 on Thursday, June 20, after closing the week prior at 92. It isn’t shocking to see spreads take a breather as they have been at tight levels relative to historical trading ranges, and they have widened in concert with Treasury yields, which have decreased in recent weeks. The 10-year Treasury yield is nearly unchanged on the week, trading at 4.23% this Friday morning after closing last week at 4.22%. Through Thursday, the corporate bond index YTD total return was +0.16% while the yield-to-maturity for the benchmark was 5.39%. All-in yields remain elevated relative to the recent past – the average yield on the corporate index over the past 10 years was 3.56%, 183 bps lower than the yield available to investors today.


Economics

It was another busy week for economic data with a bevy of highlights. On Monday, we got an Empire Manufacturing print for that region that was better than feared but still showed contraction. Retail sales on Tuesday missed to the downside, and the release was also accompanied by downward revisions to previous months. It is too early to tell, but some economists believe that this could be the beginning of a sustained softening in consumer sentiment. On Thursday, we got housing data that showed new construction starts hit a four-year low. Lastly, on Friday, S&P’s data showed that U.S. services activity expanded in a broad-based way so far during the month of June. Positively, the survey also showed further softening of price pressures and a rebound in domestic manufacturing activity. Next week is pretty quiet on the data front until Thursday’s GDP and core PCE releases.

Issuance

The IG primary market rebounded this week as companies priced $31.4 billion of new debt – an impressive haul in a holiday-shortened week. We were unsure if issuance would really come through due to a spate of economic data and a looming summer slowdown, but Monday got the week off to a hot start as 13 issuers priced more than $21 billion. Next week, syndicate desks are looking for around $20 billion of issuance, but all it takes is one big issuer to push that total higher, much like we saw with Home Depot this week, which issued $10 billion on Monday to fund its acquisition of SRS Distribution.

Flows

According to LSEG Lipper, for the week ended June 19, investment-grade bond funds reported a net outflow of -$0.433 billion. This was the first outflow from IG funds in over a month, which have seen positive flows 22 of the past 25 weeks. YTD flows into IG stand at +$36.8 billion.


This information is intended solely to report on investment strategies identified by Cincinnati Asset Management. Opinions and estimates offered constitute our judgment and are subject to change without notice, as are statements of financial market trends, which are based on current market conditions. This material is not intended as an offer or solicitation to buy, hold or sell any financial instrument. Fixed income securities may be sensitive to prevailing interest rates. When rates rise the value generally declines. Past performance is not a guarantee of future results.

14 Jun 2024

CAM Investment Grade Weekly Insights

Credit spreads are slightly wider on the week.  The Bloomberg US Corporate Bond Index closed at 90 on Thursday June 13 after closing the week prior at 88.  Although this was the widest level for the index since late April, it is only 5bps off the tightest levels of the year which illustrates just how “unchanged” the index has been for the past month and a half.  The 10yr Treasury yield is lower this week, trading at 4.20% this Friday morning after closing last week at 4.43%. Through Thursday, the corporate bond index YTD total return was +0.41% while the yield-to-maturity for the benchmark was 5.33%.


Economics

There was a bounty of economic data this week with the biggest events occurring on Wednesday and Thursday.  Core CPI Inflation data for May was released on Wednesday morning, declining to +0.2% MoM relative to consensus of +0.3%.  This deceleration was a welcome relief on the heels of some hotter prints earlier this year.  However, this was just one data point and it does not make a trend.  On Wednesday afternoon the FOMC released its policy decision with no change in the Fed Funds rate, as expected.  The press conference was on script but there were some notable changes in the Summary of Economic Predictions (SEP aka The Dot Plot).  The SEP showed slightly higher Fed inflation forecasts for 2024 and 2025 and a move in the median number of cuts for 2024 from 3 to 1.  Interestingly, 4 of the 19 FOMC members are now expecting no cuts in 2024, which was up from 1 member in March.  Recall that the SEP is released every three months so the next update will not occur until September 18.  Thursday morning brought more good news on the inflation front as the PPI release showed that US producer prices declined in May by the most in seven months.  PPI for May came in at -0.2% versus the estimate of +0.1% but nearly 60% of the decline in the May PPI for goods was due to declining gasoline costs.  Next week is another busy one for economic data with empire manufacturing, retail sales, housing starts and global PMI, to name a few.

Issuance

The IG primary market was extremely slow this week as borrowers priced just $5.75bln in new debt.  According to Bloomberg, excluding seasonality and holiday-shortened weeks, this was the lowest volume total since borrowers raised $4.25bln in the week ended 12/9/2022.  The low issuance tally was really much ado about nothing: with CPI/Fed on Wednesday, that day was effectively closed to borrowers.  Interest rate volatility plus the beginning of summer seasonality likely kept a few issuers at bay on the other days. Year-to-date issuance remains robust, standing at $803bln YTD, up +20% relative to 2023.  Next week, dealers are calling for $25-$30bln in new supply.  While we expect some issuance as borrowers look to take advantage of lower borrowing costs, we are skeptical that it will be that strong of a week given the busy economic calendar and the fact that bond and equity markets are closed on Wednesday in observance of Juneteenth.

Flows

According to LSEG Lipper, for the week ended June 12, investment-grade bond funds reported a net inflow of +$0.989bln.  IG funds have seen positive flows 22 of the past 24 weeks.  YTD flows into IG stand at +$37.2bln.


This information is intended solely to report on investment strategies identified by Cincinnati Asset Management. Opinions and estimates offered constitute our judgment and are subject to change without notice, as are statements of financial market trends, which are based on current market conditions. This material is not intended as an offer or solicitation to buy, hold or sell any financial instrument. Fixed income securities may be sensitive to prevailing interest rates. When rates rise the value generally declines. Past performance is not a guarantee of future results.