
CAM Investment Grade Weekly Insights
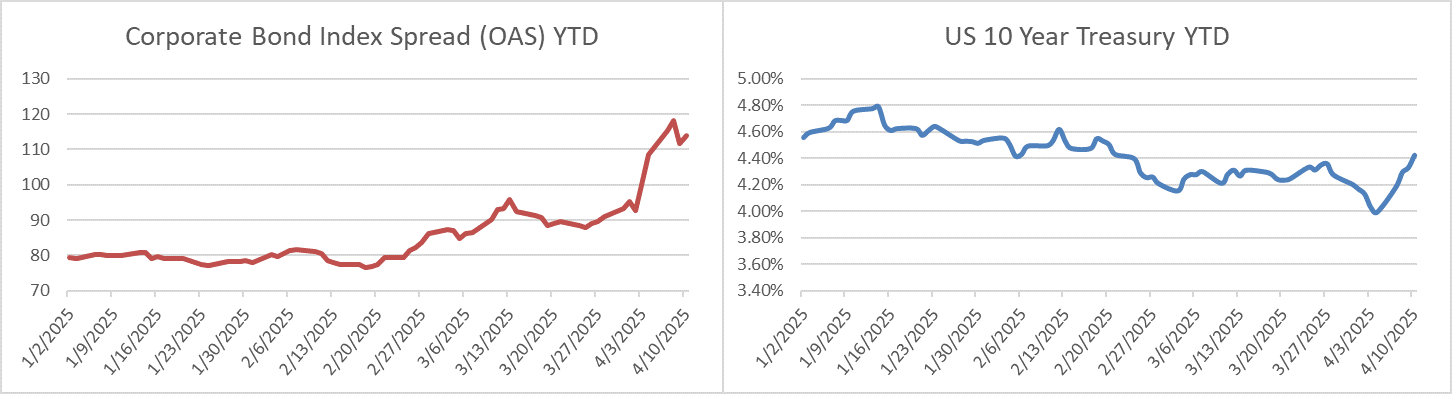
Credit spreads were wider again this week. The OAS on the corporate index closed at 114 on Thursday evening after ending the week prior at a spread of 109. Although it has been a volatile April, the IG market has behaved in a very orderly manner. The plumbing of the market is well intact with a variety of buyers and sellers transacting in normalized volumes and the new issue market is open for companies that want to borrow. The 10yr Treasury has been all over the map this month. The benchmark rate closed last week at 3.99% moving higher throughout this week to close Thursday at 4.42%. It is over 10bps higher again this morning as we go to print and there is plenty of speculation as to the reasons why. Suffice to say the Treasury market is highly complex and there is not a single definitive answer to the reason behind its price action. This is why CAM does not speculate on the direction of interest rates. We focus on credit risk which is much more controllable. One thing we do know is that Wednesday’s 10yr Treasury auction showed strong demand from buyers and there is no shortage of a bid for UST bonds as the 30yr auction was also strong. Through Thursday, the Corporate Bond Index year-to-date total return was -0.09% while the yield to maturity for the Index closed the day at 5.49%.
Economics
Major data this week was not released until Thursday and Friday but for the second week in a row it did not garner much attention as investors were focused on the volatility that is occurring in the here and now. The consumer price index (CPI) surprised to the downside with a softer inflation print relative to expectations. U.S. wholesale prices (PPI) also fell much more than expected. Both of these releases were positive for declining inflation but they were dismissed by the market due to their backward-looking nature and with inflationary tariffs looming.
Next week the highlights include retail sales, industrial production and housing starts.
Interesting Anecdotes
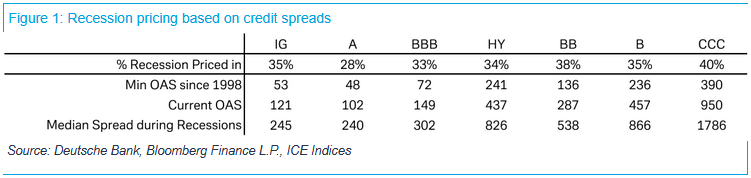
Deutsche Bank research published a midweek note showing recession pricing based on credit spreads. This puts some context around recent spread widening across credit markets. Unsurprisingly, higher quality credit spreads are pricing less risk than lower quality given that IG-rated companies are broadly better positioned to navigate a slowing economic environment.
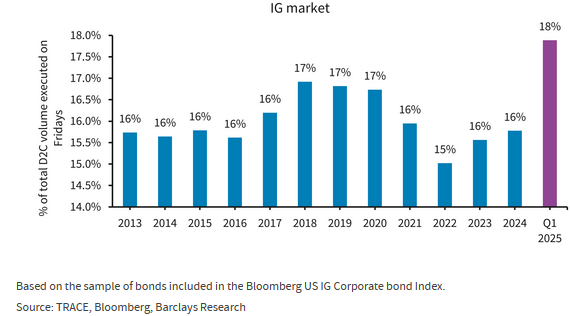
On Thursday, Barclays research published an analysis showing that, in the first quarter, Friday trading of index-eligible IG and HY corporate bonds in the U.S. hit the highest level since 2013, making up 18% of weekly volumes. Barclays goes on to surmise that the most likely explanation is that, with rising volatility in the quarter, institutional investors were adjusting their positions on Fridays to hedge against potential market volatility over the weekend. We believe that this definitely played a part but we would also give credit to the fact that the first quarter experienced a record amount of issuance which would have also fed through to elevated trading volumes. Especially considering that most of the volatility occurred in the month of March while the first two months of the year were relatively benign. CBOE Volatility Index (VIX) values below 20 are typically viewed as a sign of stability in the markets and the VIX did not close above 20 in 2025 until February 27.
Issuance
Although it was a light week for issuance, it surpassed last week’s paltry total, an encouraging sign that the IG primary market is open for business. Borrowers priced $9bln this week with most of that coming on Thursday, as four borrowers forged ahead to print $5.25bln that day. New issue concessions were elevated (and attractive in our view) this week and investor demand was plentiful. The outlook for next week is uncertain and will ultimately be driven by market sentiment. It would not surprise us if there were a huge week for issuance if the fervor subsides or it could be another light week if risk assets remain volatile.
Flows
According to LSEG Lipper, for the week ended April 9, investment-grade bond funds reported their third net outflow of the year at -$6.08bln. This was the third consecutive week of negative flows. Total year-to-date flows into investment grade funds remained positive at +$13.23bln.
This information is intended solely to report on investment strategies identified by Cincinnati Asset Management. Opinions and estimates offered constitute our judgment and are subject to change without notice, as are statements of financial market trends, which are based on current market conditions. This material is not intended as an offer or solicitation to buy, hold or sell any financial instrument. Fixed income securities may be sensitive to prevailing interest rates. When rates rise the value generally declines. Past performance is not a guarantee of future results.