Q4 COMMENTARY & 2025 OUTLOOK
January 2025
It was a solid year for investment grade credit as most companies were able to expand revenues while maintaining healthy balance sheets. These feats were accomplished largely thanks to a U.S. economy that continued to grow. Investment grade posted positive returns during the full year 2024, but the 4th quarter of the year was underwhelming as Treasury yields moved higher which weighed on returns.
2024 Year in Review
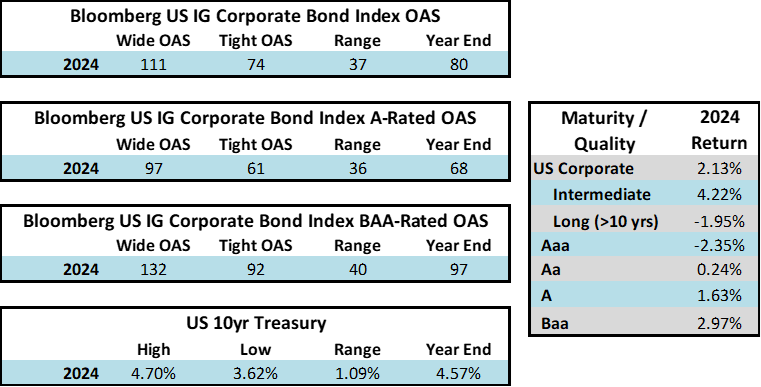
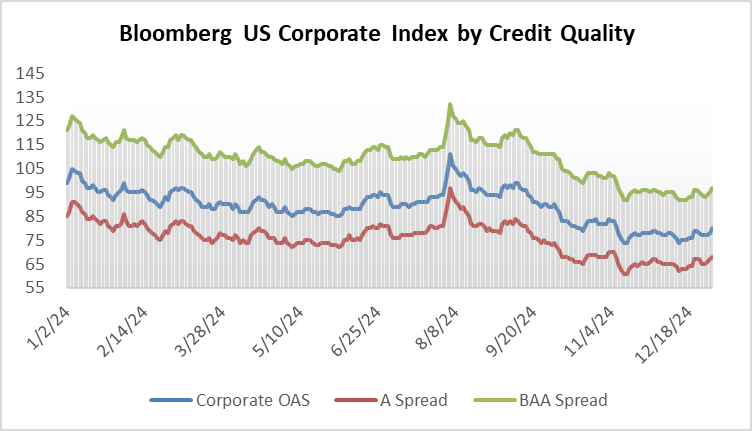
During 2024, the option adjusted spread (OAS) on the Bloomberg US Corporate Bond Index tightened by 19 basis points to 80 after it opened the year at a spread of 99. Lower quality portions of the investment grade universe outperformed higher quality, as investors reached for yield amid a historic level of spread tightening. Intermediate credit outperformed longer duration credit due to Treasury yields moving higher throughout the year.
Spread and coupon performance carried the day for corporate bonds in 2024. As bond investors we measure “excess return” as the total return of a corporate bond minus the total return of the underlying government bond. Excess return for the Corporate Index was +2.46% for the full year 2024, more than the total return for that Index of +2.13%. This means that the underlying Treasury performance was negative (due to Treasury yields moving higher) and that corporate bonds were able to overcome this and post positive total returns thanks to spread tightening and the higher coupon income that is available in corporate bonds relative to Treasuries. Suitability is unique to each investor but for investors than can tolerate a modest amount of credit risk, 2024’s performance shows that portfolios can benefit by placing a preference on actively managed IG corporate bonds relative to just Treasuries alone.
The best performing industries in 2024 were Airlines and Finance Companies. Railroads and Other Industrial were the two biggest underperformers relative to the Index. The majority of industries posted positive total returns for the full year with just a handful of negative performers.
Interest rates were volatile during 2024, particularly in the intermediate and shorter portions of the yield curve. The 10yr Treasury ended 2024 at 4.57% after opening the year at 3.88%. Looking at the front end of the curve, the 2yr Treasury finished the year at 4.24%, which was just one basis point lower than where it ended 2023; but that does not tell the whole story of just how volatile this security was during 2024. The 2yr traded above 5% at the end of April and then as low as 3.54% in the days following the Fed’s first rate cut in the latter half of September. The 2yr then climbed to 4.24% at year-end as traders began to acquiesce to the Fed’s messaging about a more cautious path of its easing cycle and the belief that rate cuts may play out over a longer time than initially anticipated. The 5yr Treasury finished the year 53bps higher than where it began, but it traded within a range of a whopping 132bps. The 5yr traded near its low of 3.40% just prior to the September Fed meeting before moving higher during the final 3 months of the year, finishing at 4.38%.
Looking at the two charts pictured above, the most important takeaway for investors and active bond mangers is the fact that the 2/10 Treasury curve ended its 793-day inversion streak in early September. The curve had been inverted since July of 2022 and this was the longest period of inversion on record. While 2/10 inversion has typically been a harbinger of recession, thus far the U.S. economy has managed to stay on solid footing. Only once previously has an inverted yield curve failed to precede a recession, during the brief period of inversions surrounding the Russian ruble crisis in 1998. A steep curve is helpful to active managers allowing them to effect economic sale-and-extension trades while also exposing investors to the power of curve rolldown and its ability to magnify returns.
2025 Outlook
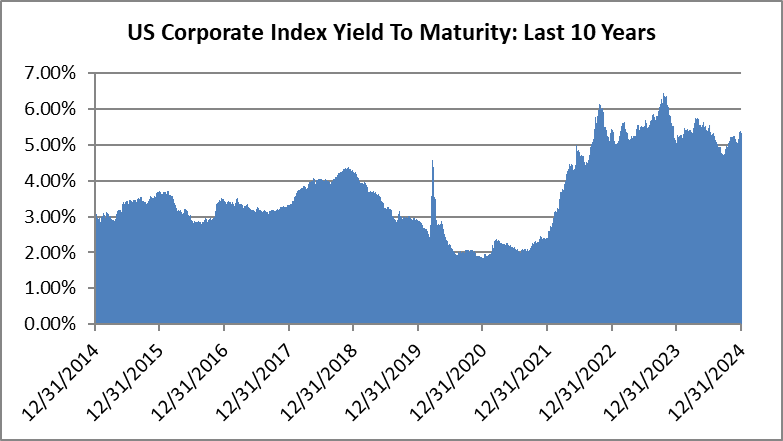
We have a favorable view of the potential for investment grade to generate attractive returns in the year ahead. The likelihood of additional spread compression is probably limited given the market is trading near the tight end of historical valuations. For us, much like we wrote at the end of 2023 and every quarter thereafter, it is the all-in yield that currently makes the asset class compelling on both an absolute and relative basis. The average yield on the Index over the past 10 years was 3.67% and it finished 2024 at 5.34%, which is higher from the end of 2023 when it was 5.06%.
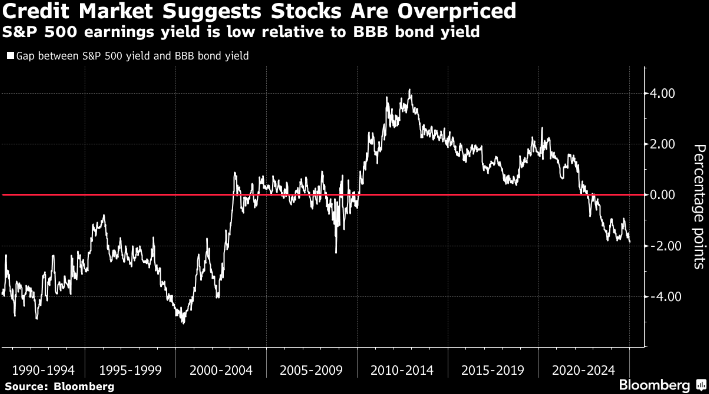
On a relative basis, by one metric, equities are at their most overvalued versus corporate credit and Treasuries since 2008. A recent Bloomberg study compared the earnings yield on S&P 500 shares (3.7%) to the yield to worst of the Bloomberg BAA Corporate Index (5.6%), finding a gap of 190 basis points as of January 6, 2025.1
The S&P 500 earnings yield is typically greater than the yield for corporate bonds to compensate investors for the additional risk associated with equities. It is worth noting that this is just one data point and this metric was negative for the entirety of the 1990s before turning positive in 2003. Still, we think that investors should take note of this development –high quality bonds screen cheap to other risk assets on a relative basis which suggests they may deserve a larger slice of an investor’s overall asset allocation.
Overall, investment grade credit metrics remained healthy in 2024 and are poised to follow a similar path in 2025. According to research compiled by Barclays, at the end of the third quarter 2024, net leverage for the Index was 3.0x, up 0.2x year over year and interest coverage was 11.7x, a deterioration of 1.3x from the prior year. Meanwhile, EBITDA growth was positive through the first three quarters of 2024 and EBITDA margins moved up a full percentage point over the past year to 30.6%, a new all-time high.2 The best way to describe credit metrics as we head into 2025 is “stable” which is what we like to see. As an active manager with a relatively concentrated portfolio, we are less concerned with the overall universe and instead focus on a relatively small number of issuers that populate our investor portfolios.
Portfolio Positioning
We are consistent in our approach to portfolio management which means that we are not making wholesale changes to our strategy from one year or quarter to the next. We provide value to our investors by assembling customized separately managed accounts consisting of thoroughly-researched individual bonds. There are several tenets that our investors can count on with CAM’s Investment Grade Strategy:
Diversification: Each individual account is initially populated with approximately 20-25 positions. This results in a portfolio that is concentrated relative to the Index but still achieves sufficient diversification at the sector/industry levels. Each account is populated with our best ideas during an invest-up period that takes 6-8 weeks to complete which we refer to as an abbreviated economic cycle.
Overweight High Quality: CAM targets a cap for each account at a 30% exposure to BAA-rated bonds, which represent the riskier portion of investment grade universe. The Index had a 47.66% weighting in BAA-rated credit at the end of 2024.
Intermediate Maturity: We will always seek to position the portfolio within an intermediate maturity band that ranges from 5-10 years, although we may occasionally hold bonds shorter than this if warranted by market conditions. At year end 2024 our composite had a modified duration of 5.49 relative to the Index duration of 6.98.
The above framework helps us achieve the goal of our process which is to provide a customized portfolio with a return that is as good or better than the Index while incurring less volatility and prioritizing preservation of capital.
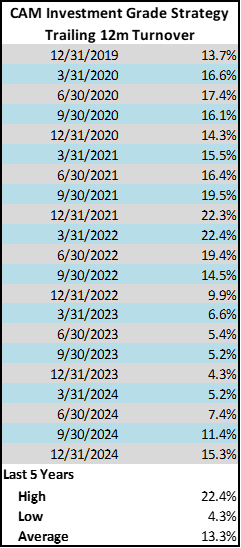
The biggest “change” of note in 2024 was more of a normalization than a pivot in strategy. We have benefited from the aforementioned re-steepening of the yield curve and its impact on our ability to engage in economic sale-and-extension trades. Simply put, it has been much more attractive for us to execute these trades thus allowing our portfolio turnover to rebound to levels more consistent with historical averages. Those investors that have been with us for a number of years have likely noticed this activity; those that have been with us for 2 or 3 years are likely to see an increase in sale activity in 2025 if market conditions remain copacetic.
As we look ahead to 2025, we are actively avoiding individual companies with exposure to geopolitical destabilization and we continue to have no exposure to leisure, lodging, restaurants or gaming. We also have a significant underweight on retailers.
FOMC Taking a Deliberate Approach
The Fed delivered 100bps of rate cuts in 2024, occurring across 3 meetings in the final 3.5 months of the year. The overarching theme of the moment is forward expectations for the path of easing, as the Fed has been careful to dial back its stance on future cuts amid sticky inflation, strong consumer spending and a resilient labor market. With the December FOMC meeting came the quarterly update of the Fed’s ballyhooed “Dot Plot” showing a median estimate of two rate cuts in 2025, down from the four previously projected in the September release. The December FOMC meeting minutes were released on January 8, showing the nuts and bolts of the Fed’s cautious view of the year ahead:
“In discussing the outlook for monetary policy, participants indicated that the Committee was at or near the point at which it would be appropriate to slow the pace of policy easing” and “In addition, many participants suggested that a variety of factors underlined the need for a careful approach to momentary policy decisions over coming quarters.”3
We think that the Fed is taking a prudent approach, especially with the amount of uncertainty from the incoming Trump administration on trade, tariffs, immigration, taxes and foreign policy. The Fed always has the option to reverse course and cut its policy rate more aggressively if the economy slows.
A Year of Opportunity
As we have written before, when it comes to interest rates, “higher for longer” is not negative for bond investors. Clipping coupons in excess of 5% for healthy IG-rated companies is an attractive value proposition. However, we believe that higher rates will continue to weigh on certain sectors of the economy such as housing and have an outsize impact on small businesses which are critical to the health of the U.S. economy. At the end of 2023 we wrote that we thought a recession was likely in 2024 or sometime in 2025. Obviously, that has not come to fruition and while sticking with that call would be deeply out of consensus, we continue to forecast a reasonable chance of recession. One scenario that could land us there is if the economic backdrop deteriorates and the Fed is too slow to react. Other recession scenarios could be borne out by geopolitical issues or by the unintended consequences of political policies or the growing U.S. deficit. We are inherently cautious in the face of these uncertainties. Preservation of capital is at the forefront of our investment grade strategy so we are always positioning the portfolio to mitigate the impact of economic downturns. At the end of the day, investing is always about being appropriately compensated for risk –in the current environment we view the modest compensation for incremental risk to be insufficient. We will continue to focus on blocking and tackling while populating investor portfolios with companies that can persevere in a variety of economic environments.
Thank you for your continued interest and support. We wish you all the best in 2025 and look forward to a successful year.
This information is intended solely to report on investment strategies identified by Cincinnati Asset Management. Opinions and estimates offered constitute our judgment and are subject to change without notice, as are statements of financial market trends, which are based on current market conditions. This material is not intended as an offer or solicitation to buy, hold or sell any financial instrument. Fixed income securities may be sensitive to prevailing interest rates. When rates rise the value generally declines. Past performance is not a guarantee of future results. Gross of advisory fee performance does not reflect the deduction of investment advisory fees. Our advisory fees are disclosed in Form ADV Part 2A. Accounts managed through brokerage firm programs usually will include additional fees. Returns are calculated monthly in U.S. dollars and include reinvestment of dividends and interest. The Index is unmanaged and does not take into account fees, expenses, and transaction costs. It is shown for comparative purposes and is based on information generally available to the public from sources believed to be reliable. No representation is made to its accuracy or completeness.
The information provided in this report should not be considered a recommendation to purchase or sell any particular security. There is no assurance that any securities discussed herein will remain in an account’s portfolio at the time you receive this report or that securities sold have not been repurchased. The securities discussed do not represent an account’s entire portfolio and in the aggregate may represent only a small percentage of an account’s portfolio holdings. It should not be assumed that any of the securities transactions or holdings discussed were or will prove to be profitable, or that the investment decisions we make in the future will be profitable or will equal the investment performance of the securities discussed herein.
Additional disclosures on the material risks and potential benefits of investing in corporate bonds are available on our website: https://www.cambonds.com/disclosure-statements/
Footnotes
Bloomberg News, January 7 2025 “Credit Markets Signal Warning for a Relentless Equity Rally”
Barclays Bank PLC, December 16 2024 “US Investment Grade Credit Metrics, Q3 24 Update: Likely Peaked”
FOMC Federal Reserve System, January 8 2025 “Minutes of the Federal Open Market Committee: December 17-18, 2024”

