2024 Q3 Investment Grade Quarterly
Investment grade credit enjoyed solid performance during the third quarter as bondholders benefited from tighter credit spreads and lower Treasury yields. The Fed finally kicked things off with its much-anticipated easing cycle by lowering its policy rate for the first time since March 2020. We remain constructive on the investment grade bond market over the near and medium term.
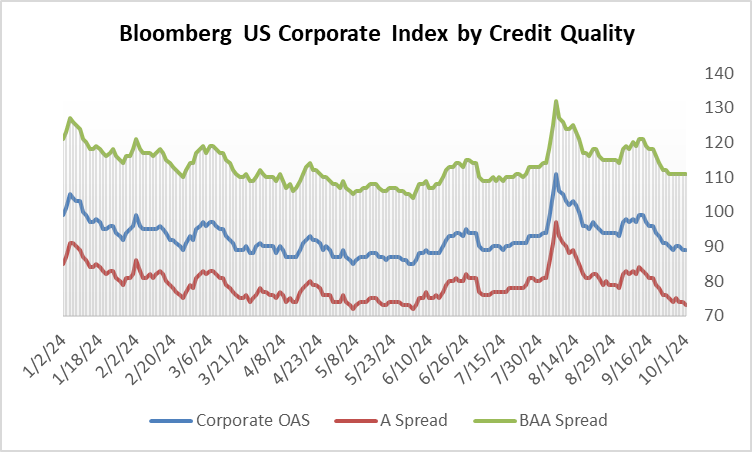
The option-adjusted spread (OAS) on the Bloomberg US Corporate Bond Index opened the third quarter at 94 and traded as wide as 111 in early August before finishing the quarter at a spread of 89. August brought with it a few volatile trading days, something we had yet to experience in 2024. Weak manufacturing and employment data soured investor sentiment, and equity indices collapsed, which spilled over into credit spreads. The weakness in spreads was short-lived. The IG index closed as wide as 111 on August 5th before incrementally moving back to 100 on August 14th. From there, spreads continued to grind tighter into quarter-end.
Treasury yields moved meaningfully lower during the quarter, which was a tailwind for total returns. This was in contrast to the 2nd quarter, which saw rates move higher throughout. The front end of the yield curve was especially lower in the 3rd quarter, with the 2-year Treasury posting an inter-quarter move lower of -111 basis points. We view this rally in the front end of the curve as a classical response to the Fed’s cut, as short rates historically are typically much more impacted than rates further out the curve.
Investment-grade corporate issuance continued at its sizzling pace. Both July and September set historical records for the most volume ever brought to market in each of those months. $1.264 trillion of new investment-grade debt was issued through the third quarter, which was +29% ahead of 2023’s pace – and 2023 was no slouch. As we have written in previous notes, the 2024 new issue market has been in a goldilocks zone. IG-rated borrowers have been comfortable with the rates they are paying, and investors have been pleased with the compensation afforded. Fund flows have been soundly positive and supportive of investor demand, and new issue concessions have been reasonable for most deals. The economy has been on sound footing, and companies have required capital to grow their businesses. It remains to be seen if this environment will persist or if perhaps some borrowing was pulled forward ahead of the November presidential election. Bottom line, the new issue market has been incredibly busy and has functioned at a high level throughout the first three quarters of 2024.
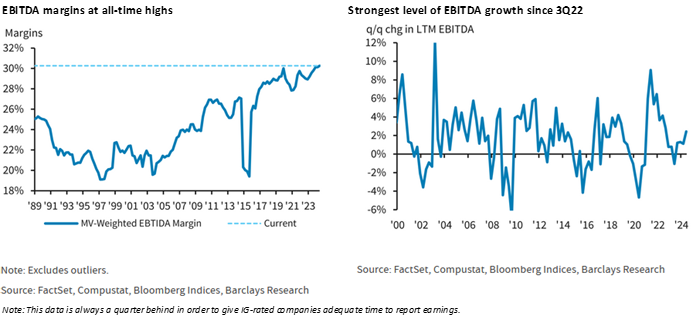
Investment-grade credit metrics continued to display resilience at the end of the second quarter, benefiting from an economy that has continued to grow. EBITDA margins were 30.3% at the end of 2Q, a new all-time high, while EBITDA growth was at its highest level in two years. Interest coverage also improved incrementally during the quarter, but this was offset by slightly higher leverage across the IG universe. Putting it all together, we believe that IG credit offers plenty of opportunities to invest in appropriately capitalized companies with good businesses at attractive spreads.
What a Difference a Year Makes
The Fed delivered a 50bp cut at its September meeting. This was after electing to hold its policy rate constant at the July meeting, and there was no meeting in the month of August. The Fed “Dot Plot” that was released coincident with the meeting showed that the median views of the 19 FOMC members were as follows: 50bps of additional cuts in 2024, 100bps of cuts in 2025, and a further 50bps of cuts in 2026. Market participants were taking a more dovish view than the Fed’s projection for the balance of 2024, with Fed Funds futures pricing 71bps of cuts before year-end as of October 1. We believe that this easing cycle will be a deliberate one that plays out over the course of several years. The Fed cannot afford to move too hastily due to the risk of reigniting inflationary pressures. The wildcard is that the Fed could cut its rate more quickly and aggressively if the labor market deteriorates rapidly from current levels, as that has historically been a leading indicator of recession.
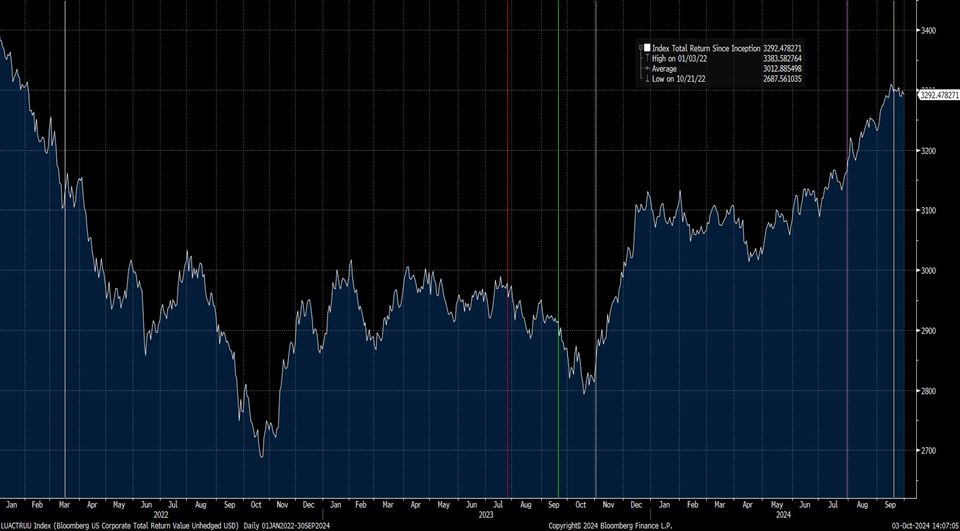
We thought it would be instructive to illustrate the progression of investment grade returns over the course of the tightening cycle that has since turned into an easing cycle. The chart on the ensuing page depicts the total return for the IG index since inception but we have snipped the data to show the current cycle from the beginning of 2022 through the third quarter of 2024. The market hit its low for the current cycle in October 2022 before it recovered into 2023 as it traded sideways before taking another leg lower in October 2023. There was a powerful move higher during the fourth quarter of 2023 before the market treaded water for most of this year until the recent quarter where it has once again trended in a positive direction.
The vertical lines on the chart represent pivotal Fed meetings that have occurred since the beginning of 2022, which we will explore further below. As a disclaimer, we would be remiss if we did not say that this analysis is far easier with the benefit of hindsight but we believe it is an interesting exercise nonetheless.
3/16/2022 – The first policy rate hike of the tightening cycle. This was well telegraphed and anticipated by investors and many thought that the Fed should have moved even sooner in order to combat inflation.
7/26/2023 – The last rate hike of the tightening cycle. This pushed the policy rate to a 22-year high. Recall that, at the time, it was quite unclear if the Fed was done hiking. After all, the Fed already paused once in June only to hike again at this meeting. To quote Chairman Powell at the news conference following the FOMC decision “It is certainly possible that we will raise rates again at the September meeting,” he said. “And I would also say it’s possible that we would choose to hold steady at that meeting.”
9/20/2023 – The Fed pauses again for the first time since June but is non-committal about further hikes.
11/1/2023 – The Fed pauses for a third time in the cycle and Powell’s remarks indicate that the bar is higher for further tightening through adjustments to the policy rate. Is it any coincidence that the market ripped higher through year end?
7/31/2024 – The Fed holds rates steady but indicates that near-term cuts are on the horizon.
9/18/2024 – The Fed delivers its first rate cut of the current cycle. Through the end of the third quarter, the IG index had recovered nearly the entirety of the value it lost during the tightening cycle. The index has posted a +14.28% total return from the end of the third quarter 2023 to the end of the third quarter 2024.
What has Changed for Our Portfolio?
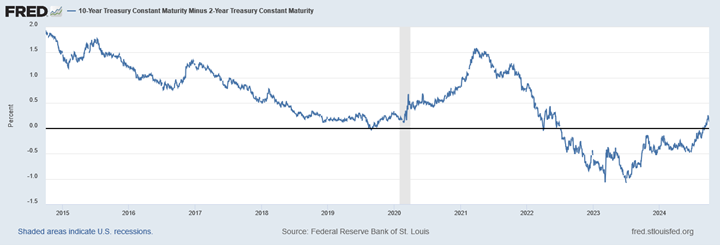
The biggest change we have been able to implement in 2024 is that sales and extensions have once again become economic. A large portion of what we are trying to accomplish for our clients is derived from our intermediate positioning. We generally populate new accounts with bonds that mature in 8-10 years. We will then allow those bonds to roll down the yield curve, with the goal of spread compression as the bonds move toward the 5yr mark. With about 5yrs to maturity, you will start to see us sell bonds and extend further back out the curve. This allows us to mitigate interest rate risk and capture the steepness of the 5/10 Treasury curve as well as the corporate credit curve. This all holds true in normalized times but the last two years have been anything but that! The 2/10 Treasury curve was inverted for a record consecutive 25 months (see below chart from St. Louis Fed). This made our sale and extension trades uneconomic –the math simply dictated that our clients were, in many cases, better off holding their existing bonds longer than they would typically, allowing the tightening cycle to pass and buying time for the curve to regain steepness. We were still busy during this time researching and monitoring credits and making changes at the margins but our sale activity for fully invested accounts during the peak of the curve inversion was severely diminished. This has changed in a big way in 2024 as curves have begun to normalize and we are finding many more attractive trading opportunities which we have used to add value for our clients. Our turnover has doubled over the past year and is now approaching a figure that is much more in-line with historical averages.
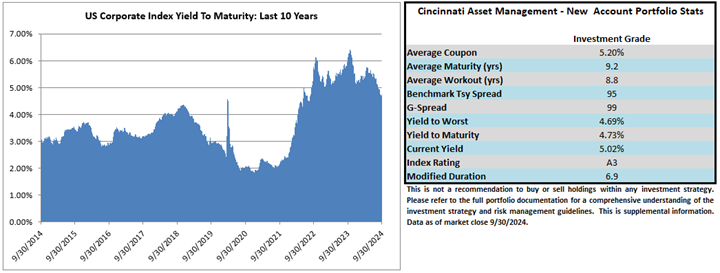
As far as valuation is concerned, IG credit spreads are at the tight end of historical ranges. We believe spreads are fairly valued given the strength of credit metrics across the IG universe and the resilience of the U.S. economy. Credit spreads are pricing in very little chance of a recession, but we feel that investors are afforded some downside protection from an economic slowdown due to Treasury yields that are still elevated relative to medium-term averages. The yield to maturity for the investment-grade index at the end of the third quarter was 4.73% while the 10yr average was 3.62%. The chart paints an approximate picture of what a new account in CAM’s Investment Grade program could expect at quarter end.
Entering The Homestretch
As we enter the final few months of the year, we can’t help but feel that market participants are almost too comfortable. The median probability of a recession over the next calendar year according to a Bloomberg survey of economists has fallen to 30%, down from 55% a year ago. There has been great progress with inflation, but there is still work to do and there are risks to the downside if the Fed is too aggressive with easing its policy rate. There are numerous geopolitical issues and serious ongoing conflicts throughout the world. A U.S. presidential election is less than a month away. Despite these risks, domestic equity indices are at all-time highs and credit spreads are snug. While the probability of a soft landing has increased, there is still reason for caution.
We continue to be fastidious when populating our investor portfolios. We are on the hunt for durable businesses with strong free cash flow and credit metrics that are robust enough to weather a downturn. Please contact us with any questions or topics for discussion. We are grateful for your interest and partnership.
This information is intended solely to report on investment strategies identified by Cincinnati Asset Management. Opinions and estimates offered constitute our judgment and are subject to change without notice, as are statements of financial market trends, which are based on current market conditions. This material is not intended as an offer or solicitation to buy, hold or sell any financial instrument. Fixed income securities may be sensitive to prevailing interest rates. When rates rise, the value generally declines. Past performance is not a guarantee of future results. Gross of advisory fee performance does not reflect the deduction of investment advisory fees. Our advisory fees are disclosed in Form ADV Part 2A. Accounts managed through brokerage firm programs usually will include additional fees. Returns are calculated monthly in U.S. dollars and include reinvestment of dividends and interest. The index is unmanaged and does not take into account fees, expenses, and transaction costs. It is shown for comparative purposes and is based on information generally available to the public from sources believed to be reliable. No representation is made to its accuracy or completeness. Additional disclosures on the material risks and potential benefits of investing in corporate bonds are available on our website: https://www.cambonds.com/disclosure-statements/
i Bloomberg, October 1 2024 “IG PIPELINE: Quiet Start to 4Q After Record September”
ii Barclays FICC Research, September 9 2024 “US Investment Grade Credit Metrics, Q2 24 Update: Staying afloat”
iii The Federal Reserve Board, September 19 2024 “Summary of Economic Projections”
iv Bloomberg, October 1 2024 “World Interest Rate Probability”
v AP News, July 26 2023 “Federal Reserve raises rates for 11th time to fight inflation but gives no clear sign of next move”
vi Thomson Reuters, August 5 2024 “Key US bond yield curve turns positive on recession fears”
vii Bloomberg, October 3 2024 “United States Recession Probability Forecast”

