CAM Investment Grade Weekly Insights
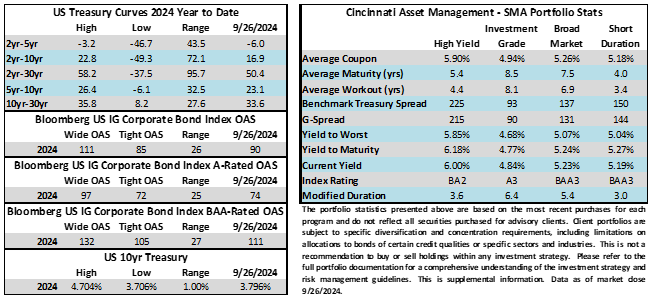
Credit spreads traded within a narrow window this week and are 1 basis point better week over week. The Bloomberg US Corporate Bond Index closed at 90 on Thursday September 26 after closing the week prior at 91. The 10yr Treasury yield was higher this week through Thursday, up 5.5 basis points from where it closed last Friday. Through Thursday, the corporate bond index year-to-date total return was +5.22%.

Economics
There were some data points during the week to highlight. One of the most interesting under the radar prints was consumer confidence on Tuesday morning which fell the most in three years from the prior month’s reading. A closer look at the data showed that consumers were hesitant to spend with a labor market that has been showing signs of slowing amid persistently high costs of living. On Thursday there was a GDP release that showed that figure coming in at +3% for the second quarter. This was slightly better than the consensus estimate and economists are looking for an expansion of +2% in the third quarter. So, while GDP may be slowing, it is expected to remain in positive territory. The most anticipated release of the week was PCE and spending data on Friday morning. The Fed’s preferred inflation gauge and spending both rose at very modest levels which is likely to keep the Fed on track for another cut at its November 7th meeting, although there is still plenty of data that could sway them between now and then. Recall that there is no meeting in the month of October.
Next week is very similar to this week in that there are some meaningful data points but we will again have to wait until Friday for the main event which is the September payroll release.
Issuance
It was déjà vu all over again as issuance this week once again exceeded expectations. Companies brought $37bln of new bonds to market relative to the high end of estimates at $25bln. This capped off the busiest September on record at $168bln of monthly supply. The previous high-water mark was $164bln amid the pandemic borrowing binge of September 2020. Interestingly, according to sources compiled by Bloomberg, this was the fourth month this year where a record for monthly issuance volume was broken. The previous record setting months were January, February and July. More than 1.261 trillion of new debt has been priced in 2024 putting it a whopping +29% ahead of 2023’s pace. As we have written in previous commentaries it is somewhat of a goldilocks scenario for both borrowers and lenders (bond sellers and bond buyers) in that the prices paid are attractive for both parties. Absent any meaningful move in either direction for rates and/or spread we would expect this type of environment to persist although we could see a slowdown ahead of the November 5th presidential election.
Flows
According to LSEG Lipper, for the week ended September 25, investment-grade bond funds reported a net inflow of +$1.34bln. Short and intermediate investment-grade bond funds have seen positive flows 33 of the past 39 weeks. The total year-to-date flows into investment grade funds are +$55.1bln.
This information is intended solely to report on investment strategies identified by Cincinnati Asset Management. Opinions and estimates offered constitute our judgment and are subject to change without notice, as are statements of financial market trends, which are based on current market conditions. This material is not intended as an offer or solicitation to buy, hold or sell any financial instrument. Fixed income securities may be sensitive to prevailing interest rates. When rates rise the value generally declines. Past performance is not a guarantee of future results.