CAM Investment Grade Weekly Insights
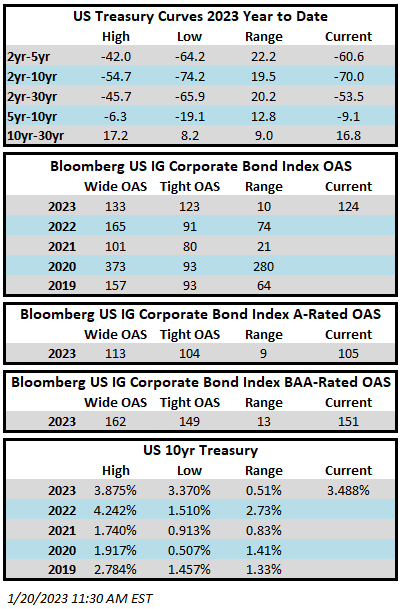
Investment grade credit spreads moved tighter this week although the move is not yet fully reflected in the index which can lag at times. The Bloomberg US Corporate Bond Index closed at 124 on Thursday January 19 after having closed the week prior at the same level. Credit spreads continued to move tighter late Friday morning. The 10yr Treasury closed the week prior at 3.50% and it is trading at 3.49% as we go to print. Through this Thursday the Corporate Index had a YTD total return of +4.1% while the YTD S&P500 Index return was +1.6% and the Nasdaq Composite Index return was +3.7%.
There was a slew of economic data this week. On Tuesday the Empire Survey for manufacturing in the NY region registered the fifth worst reading in its history. Wednesday brought with it a retail sales release that showed a pullback in consumer spending. Finally, existing home sales data was released on Friday which posted its 11th consecutive monthly decline and now worst annual drop since 2008. Taken together, the economic data is showing that the Federal Reserve tightening of financial conditions is having its intended effect of slowing inflation but that it is also taking its toll on the economy. Recall that the Fed will have its next FOMC rate decision on February 1 and at this point it is still unclear if 25 of 50ps of additional rate hikes will occur at that time.
Primary market volume was underwhelming this week as expected supply from the big six money center banks failed to materialize. Issuance on the week was only $16bln+ while some estimates had called for as much as $40bln. The estimates were probably too rosy in our view considering the market was closed on Monday for Martin Luther King Day. Next week, prognosticators are looking for $20-$25bln in new supply. The primary calendar will likely be slower the next few weeks until companies have had a chance to report earnings and exit their blackout periods.
Investment grade credit reported another weekly inflow. Per data compiled by Wells Fargo, inflows for the week of January 12–18 were +3.8bln which brings the year-to-date total to +$12.6bln.

This information is intended solely to report on investment strategies identified by Cincinnati Asset Management. Opinions and estimates offered constitute our judgment and are subject to change without notice, as are statements of financial market trends, which are based on current market conditions. This material is not intended as an offer or solicitation to buy, hold or sell any financial instrument. Fixed income securities may be sensitive to prevailing interest rates. When rates rise the value generally declines. Past performance is not a guarantee of future results.