2021 Q3 Investment Grade Quarterly
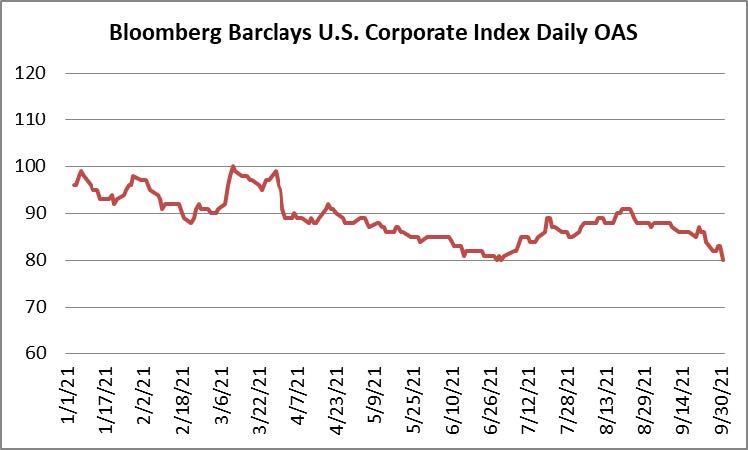
Investment grade corporate credit finished the third quarter little changed from where it began the period. The option adjusted spread (OAS) on the Bloomberg Barclays US Corporate Bond Index ended the third quarter at 84 just modestly wider from where it started at a spread of 80.

Treasuries finished the quarter nearly unchanged as well. The 10yr Treasury opened the 3rd quarter at 1.47% and closed at 1.49%. There was some volatility along the way, as the benchmark rate closed as low as 1.17% near the beginning of August with much of its move higher coming in the last week of September.
It has been a relatively low volatility year for investment grade credit spreads with the Corporate Index having traded so far this year within its narrowest band since 2006, with a spread range of just 20 basis points. The index saw its tightest level when it closed at 80 the last day of June and its widest level of 100 in early March. For context, during the volatile year of 2020, the index saw a range of 280 basis points. The index traded in a range of 64 and 68 basis points in 2019 and 2020, respectively.
There are several reasons why we believe volatility has been subdued thus far in 2021. First, demand for investment grade credit as an asset class has been very strong which can be supportive of lower volatility and tighter credit spreads. According to data compiled by Wells Fargo Securities, there has been over $300bln in fund flows into investment grade credit through September 29.i A second reason we believe there has been less volatility is due to low net new issue supply. Gross supply has exceeded $1.1 trillion in 2021, the second busiest year on record.ii However, a closer examination of the numbers reveals that much of 2021’s supply has been for the replacement of existing higher cost debt. After subtracting tenders, refinancing and maturities, that $1.1 trillion gross supply figure gets whittled down to less than $300bln in net new issue supply through the end of the third quarter.iii Simply put, demand for credit has overwhelmed available supply. Finally, investment grade companies have strong balance sheets and high cash balances. Combining this strength with a yield starved environment and a “risk-on” sentiment has created a feeling among some investors that there is very little risk at the moment in IG credit and we believe this is the largest factor that has contributed to low volatility
Although most companies in IG credit are well positioned, this is an environment where investors need to tread especially lightly and do their homework on each individual company. Yes IG credit is generally in good or even great condition. Many companies issued debt during the worst of the pandemic because they wanted to shore up liquidity in the face of uncertainty. As a result, gross leverage is still elevated from pre-pandemic levels. Much of the cash that was borrowed is sitting idle on company balance sheets. As an additional consequence of the pandemic, there are scores of companies that paused share buybacks in 2020 or even dividends and have yet to resume them. There will be pressure from shareholders to resume these activities as well as additional shareholder remuneration. Management teams and boards have stockpiles of cash and may be tempted by ample M&A opportunities at some of the richest valuations the market has ever seen. It is important for a bond manager to identify those companies that are committed to maintaining or repairing the health of their balance sheets and to avoid those that will use excess liquidity for pursuits that are negative for bondholders. Shareholder rewards and M&A are fine as long as they are done within the confines of the balance sheet. It is when these activities rise to excess levels resulting in downgrades from A to BAA or from BAA to junk that it starts to impair total return potential for bondholders.
In a move that was largely expected at its September meeting the Federal Reserve said that it could start to reduce its $120 billion in monthly asset purchases as soon as its next scheduled meeting in early November. The tapering messaging has been deliberate and carefully crafted, and although there has not yet been a formal decision, Chairman Powell said that it would be a gradual process “that concludes around the middle of next year is likely to be appropriate.”iv
It has received much less press coverage but we would argue that the Fed began the tapering process back in July when it started selling down its corporate credit facilities. Recall that during the height of the crisis in March of 2020, the Fed went to extraordinary measures and began to purchase corporate bond ETFs as well as individual corporate bonds. The maximum size of the facility was $750bln, but at its peak the facility only grew to $14bln. The Fed quietly exited all of these positions by September 1 with no discernible market impact.v Clearly, the program was a success and it did much to reinstall confidence in the credit markets at a time when it was desperately needed.
As far as the federal funds rate is concerned, the September meeting was slightly more hawkish than expectations but again the message was clear that tapering will come first and any rate hikes will come thereafter. The committee was split on the timing of the first rate hike, with half of 18 Fed officials expecting at least one increase by the end of 2022 with additional increases forthcoming during 2023. We also expect that this will be a slow and steady process. The Fed Funds rate is a very short term interest rate and its impact is limited to the front end of the yield curve, while maturities further out the curve, like the 10yr and 30yr Treasury are much more impacted by the overall direction of the economy and inflation expectations. We think incremental increases in the Fed Funds rate are entirely manageable for corporate credit so long as the Fed keeps a watchful eye on the economy to prevent it from overheating.
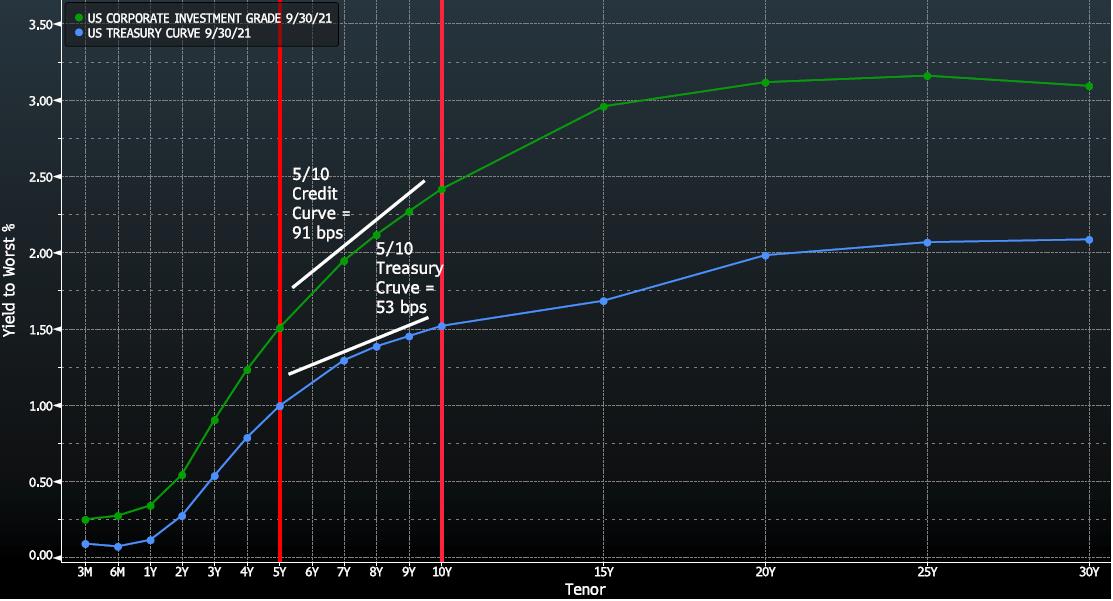
We often receive questions from clients about our intermediate positioning, as our portfolios are typically invested in bonds that range from 5-10 years until maturity. A bond portfolio is generally seeking to accomplish four goals: income generation, preservation of capital, inflation protection and diversification. We believe positioning the portfolio within an intermediate maturity range helps to accomplish all of these goals but it is especially useful in limiting downside and preserving purchasing power. Intermediate maturities give the portfolio a chance to benefit if Treasury rates go lower but it also provides much more protection from rising interest rates than if the portfolio were invested in longer maturities 20 to 30 years out the curve. More importantly, it gives the portfolio a chance to generate a positive total return in environments where rates exhibit little movement, even if absolute yields are low like they are currently. The 5/10 curve is one of the most reliably steep portions of both the Treasury curve and the corporate credit curve, which is the spread that one is afforded for owning a corporate bond on top of a Treasury.

As you can see from the chart, the steepness afforded from the 5/10 portion of these curves is attractive relative to the longer portions. Take the corporate yield curve as an example (green). We get 91 basis points of additional yield by selling a bond at 5yrs and using the proceeds to buy a bond that matures in 10yrs. The way that bond math works, all else being equal, in a static rate and spread environment, we would collect 91 basis points of roll down from holding a generic investment grade corporate bond from 10yrs selling it at 5yrs. The mere 68 basis points of compensation afforded from extending from 10yrs to 30yrs pales in comparison to the intermediate positioning. The extension from 10/30 is also accompanied by substantially more interest rate risk.
Now let’s take a look at duration to provide some more context to this discussion. At September 30 2021, the modified duration of the Bloomberg Barclays US Corporate 5-10yr index was 6.47 and the OAS was 80. The modified duration of the US Corporate 10+yr index was 15.19 and the OAS was 122. One very basic measure of risk/reward we like to use is yield per unit of duration. In this instance we are receiving 12.4 basis points per year of duration if we invest in the 5-10yr index but only 8 basis points per year of duration if we invest in the 10+ portion of the index. Given the way that we at CAM view the world, by investing in the 10+ year portion of the index, we would be receiving significantly less compensation in exchange for more interest rate risk.
The big themes that will carry us into year-end are the ongoing pandemic, the domestic economy, China and the FOMC; on these topics there are more questions than answers at this point. Will the economy continue to recover or will new variants take the wind out of its sails? Will policy makers be able to offer targeted relief to those sectors of the economy that have not come close to recovering lost earnings without offering relief that is so broad that it leads to overheating? Will problems with China’s domestic economy lead to systemic issues for the global economy – for the record we think not –but could there be ramifications for certain industries? And finally, the FOMC’s November meeting looms large with the potential for an announcement on tapering asset purchases.
As we stated earlier in this missive, corporate credit is generally in solid shape but this is not a risk free asset class. Mistakes will be made by some management teams that become too aggressive amid an environment that is still rife with uncertainty and it is our job to do our best to avoid those issues for our client portfolios. We are still positioning our portfolio in a more defensive manner than the market as a whole and we do not see that changing in the near term. Please feel free to contact us with any comments, questions or concerns. Thank you for your business and continued interest.
This information is intended solely to report on investment strategies identified by Cincinnati Asset Management. Opinions and estimates offered constitute our judgment and are subject to change without notice, as are statements of financial market trends, which are based on current market conditions. This material is not intended as an offer or solicitation to buy, hold or sell any financial instrument. Fixed income securities may be sensitive to prevailing interest rates. When rates rise the value generally declines. Past performance is not a guarantee of future results. Gross of advisory fee performance does not reflect the deduction of investment advisory fees. Our advisory fees are disclosed in Form ADV Part 2A. Accounts managed through brokerage firm programs usually will include additional fees. Returns are calculated monthly in U.S. dollars and include reinvestment of dividends and interest. The index is unmanaged and does not take into account fees, expenses, and transaction costs. It is shown for comparative purposes and is based on information generally available to the public from sources believed to be reliable. No representation is made to its accuracy or completeness.
i Wells Fargo Securities, September 30 2021 “Credit Flows | Supply & Demand: 9/23-9/29”
ii Bloomberg, September 30 2021 “IG ANALYSIS: CNO FABN Debut Leads Docket; $90-$100bn October”
iii Credit Suisse, September 13 2021 “CS Credit Strategy Daily Comment”
iv The Wall Street Journal, September 22 2021 “Fed Tees Up taper and Signals Rate Rises Possible Next Year”
v Federal Reserve Statistical Release, September 2 2021 “H. 4. 1 statistical release”