2021 Q1 Investment Grade Quarterly
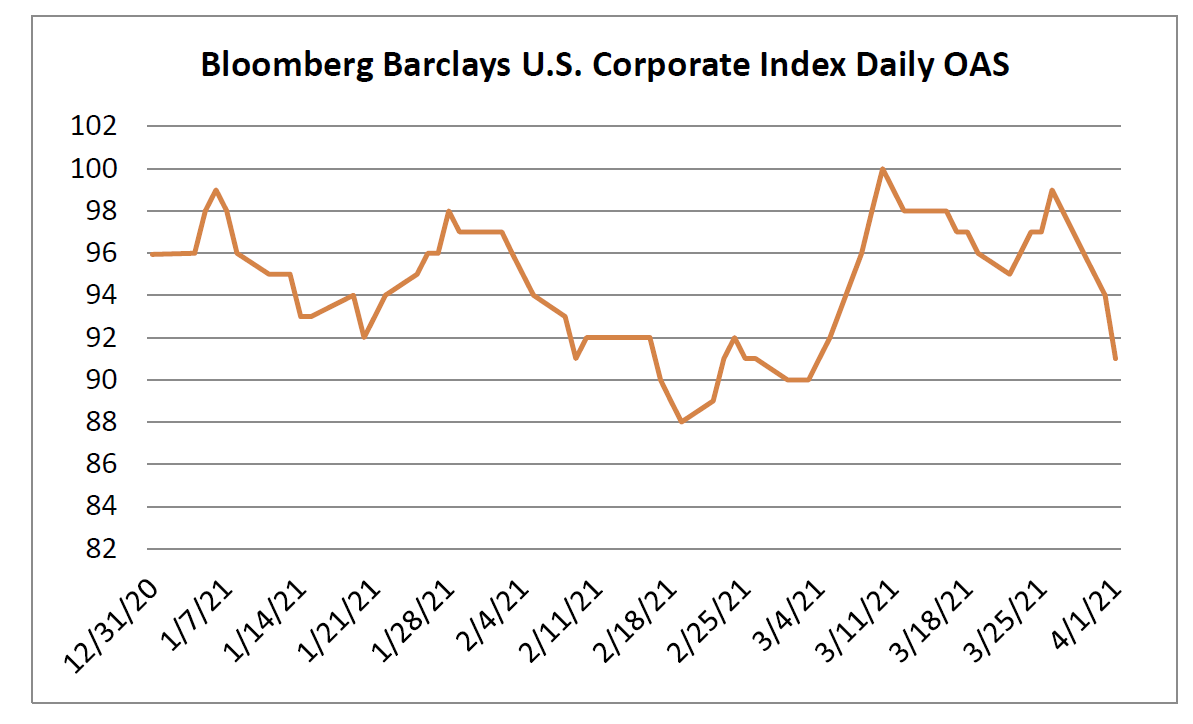
It was a challenging first quarter for corporate bonds as rising interest rates were a headwind for performance across the fixed income universe. Investment grade credit spreads were a bright spot, having shown resiliency during the quarter, but tighter spreads could not overcome volatile interest rates. The option adjusted spread (OAS) on the Bloomberg Barclays US Corporate Bond Index compressed 5 basis points during the quarter, opening at 96 and closing at 91. It was only a little more than a year ago when the global pandemic had roiled markets, sending the spread on the index all the way out to 373. The tone has improved substantially since last March and spreads are now tighter than their narrowest levels of last year when the index opened 2020 at an OAS of 93.
Higher Treasuries were the negative driver of performance for credit during the quarter. The 10yr Treasury opened 2021 at 0.91% and was volatile along the way before closing the quarter at 1.74%. This 83 basis point move in the 10yr over such a short time period was too much to overcome for coupon income and spread compression. The Corporate Index posted a total return of -4.65% during the first quarter. This compares to CAM’s gross quarterly total return of -3.50%.
First Quarter Recap
Excess return presents a picture of the performance of credit spread and coupon income, excluding the impact of Treasuries. The sector that posted the best excess returns to start the year was Energy. This should come as no surprise as oil prices were up over 20% during the quarter and Energy was the worst performing sector for the full year 2020. It was ripe for a rally. Packaging was the lone major industry to post a negative excess return during the quarter of just -0.05%. This is in line with the larger theme in the market currently that has made more cyclical sectors in vogue as the pandemic recovery trade was in full force. This has left some more stable and defensive industries as out of favor at the moment. The recovery trade theme has also led to outperformance for riskier BBB-rated credit versus higher quality A-rated credit. BBB-rated credit outperformed A-rated during the quarter to the tune of 85 basis points on a gross total return basis – a significant number to be sure. We will see, as the year plays out, if this reach for yield can sustain its outperformance over a longer time horizon. We believe that some of the move in cyclicals has been overdone and as a result the portfolio is positioned with a more defensive posture than the index.
Investing in a High Rate World
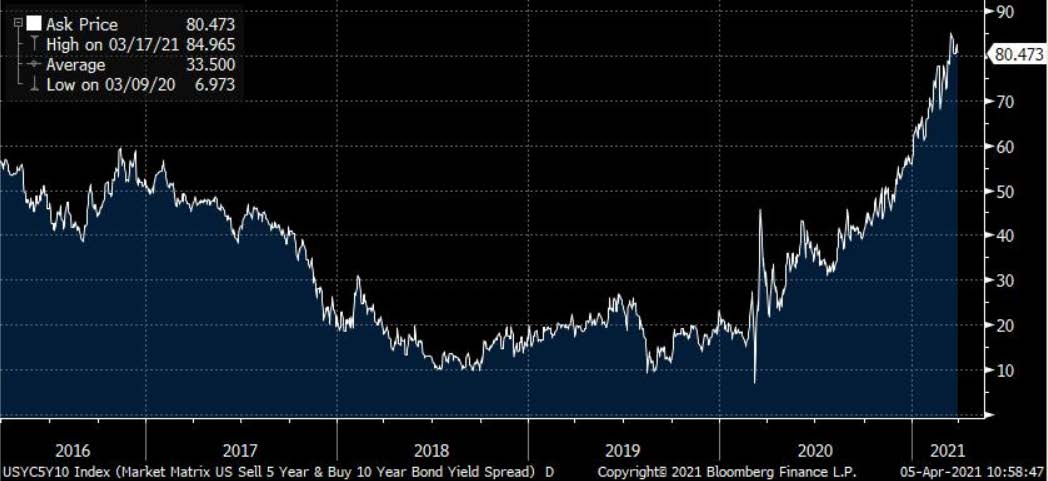
After the corporate index posted a cumulative gain of almost 25% over the previous two years through the end of 2020, most of it on the back of tighter spreads and lower rates, it is fair to expect a pull-back at some point. The current quarter’s performance can almost entirely be defined by Treasuries reclaiming some of the ground that they gave up during the pandemic. Recall that the 10yr Treasury closed as high as 1.88% in the early months of 2020 before falling as low as 0.51% in August of last year and now closing the first quarter of 2021 at 1.74%. But there is more to the story than a higher 10yr Treasury and a closer look at the Treasury curve reveals some more interesting details, particularly the spread between the 5yr and 10yr Treasury. As you can see from the below chart, the 5/10 Treasury curve has steepened substantially over the course of the past year.
CAM consistently positions the portfolio in maturities generally ranging from 5-10 years and there are several reasons that we have structured our investment grade program around this intermediate positioning. First, our customers will know precisely what they are going to get from us in that they can see the exact quantity of each individual company bond that they own and they can count on us to be positioned within a certain maturity band. This allows the client to more effectively manage other portions of their asset allocation accordingly without worrying that we might engage in interest rate speculation or a wholesale change in strategy. The second reason we have settled on this maturity positioning is that it exposes clients to less interest rate risk than the benchmark and far less interest rate risk than if we went further out the curve by purchasing 30yr bonds. We are good at credit work; building customized portfolios, populating them with individual credits based on our analysis of their credit worthiness and reaping those rewards over a 3-5 year time horizon. Our intermediate positioning allows our returns to be driven by credit spread compression and not by our ability to accurately time interest rates. The third and perhaps most important reason that we settled on this intermediate positioning as part of our core strategy has to do with the steepness of both the Treasury curve and the corporate credit curve from 5 to 10 years. Over long time periods this tends to be the steepest portion of both of those curves relative to the curve as a whole.i To provide some context, at quarter end, the 10/30 Treasury curve was 67 basis points; that is, the compensation afforded for selling a 10yr Treasury and buying a 30 year Treasury was an additional 67 basis points in yield, or 3.35bps of yield per year for each year of the 20 year maturity extension. If we compare this to the 5/10 curve at quarter end when that particular curve was 80 basis points, or 16 basis points of extra yield for each of the 5 years between 5 and 10yrs, you can see that the 5/10 curve is significantly more steep than the 10/30 curve. You are extracting much more compensation from selling a 5yr bond and extending to 10yrs than you would get from selling a 10yr bond and moving all the way out to 30 years. Not only is an investor being much better compensated for each additional year from 5/10 but they are taking substantially less interest rate risk by limiting their extension to just 10 years in lieu of 30 years. As you can see from the above chart, the 5/10 curve flattened all the way down to 7 basis points during the worst of the pandemic-related market dislocation but it has since steadily risen, and is now at its highest level since the 3rd quarter of 2014.
To say we are excited about this newfound steepness in the Treasury curve would be an understatement –we are ecstatic, as it allows us to do two things. First, it allows seasoned accounts (those who have been with us at least 3-5 years) to extract attractive compensation by selling their 5yr corporate bonds and using those proceeds to purchase bonds that mature in 8 to 10 years. For those accounts that have been with us for less time or for new accounts it provides an attractive entry point for new money that can take advantage of the roll-down afforded by the steep yield curve. The roll-down to which we refer is the aforementioned 16 basis points per year that a bond was receiving at quarter end for each year that it declined in maturity.
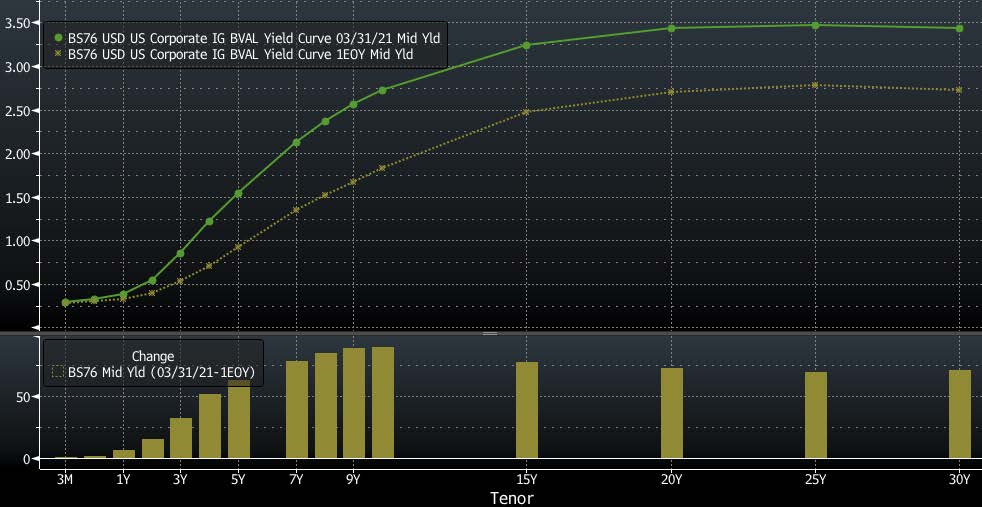
But the bond math doesn’t stop there. On top of the Treasury curve is another curve, the corporate credit curve. Since corporate bonds trade with spread on top of Treasuries they also have their own curve that varies with steepness over time. The shape of the corporate credit curve is more consistently upward sloping than the Treasury curve. Treasury curves, at times, can flatten or even invert. The corporate credit curve on the other hand is almost always upward sloping.ii It only rarely flattens or inverts on a temporary basis during times of extreme market stress or dislocation, and we are happy to take advantage of those fleeting opportunities when they do appear.
As you can see from the chart above, the yield curve for investment grade corporates shares some of the current qualities of the Treasury curve with a pronounced steepness in the belly of the curve and a much flatter slope beyond 10 years. The beauty of these curves is that, even in the unlikely event that Treasuries and credit spreads stay static over the next 5 years we can still generate a positive total return from coupon income and capital appreciation through the roll-down of bonds currently held. Additionally, the steepness afforded by curves currently offers us some protection from rising rates and/or wider credit spreads.
Our proven strategy seeks to provide clients with a transparent separately managed account that provides a return that is good as or better than the Bloomberg Barclays U.S. Corporate Index. We also want to get them there with less volatility through diminished interest rate risk and credit risk along the way. One of the reasons we outperformed the index by 115 basis points during the first quarter was by virtue of our intermediate positioning. Our portfolio ended the quarter with duration of 6.30 while the index had duration of 8.48.
Looking Ahead
Preservation of capital is at the forefront of our strategy so we hate to post a quarter with a negative total return and we know that our investors feel the same way. Thankfully, given the way that bond math works, and especially for investment grade rated credit, such impairments are typically temporary in nature. Take for example a bond that is trading at a discount to par –as time passes and it gets closer to its maturity date, its price gets closer to par, all else being equal. Discount bonds eventually recapture their value as time goes by – it is just a function of the way that the math works. As regular readers know, even in good times after we post a great quarter, we are loath to focus on such short term performance. Investment grade rated corporate credit is at its best when it is treated as a strategic long term allocation that is part of a well-diversified portfolio. In fact, one of the reasons to own this asset class is to aid in that goal of achieving diversification due to its low correlation with other asset classes and its often negative correlation with equities. Bottom line, if an investor is looking for income, diversification and capital preservation as well as a chance to keep up with and/or beat inflation, then investment grade credit is among the ideal asset classes for helping to achieve those goals. After a volatile first quarter we have a guarded optimism and believe there is an attractive opportunity set for our investment philosophy going forward. We thank you for your continued interest and for placing your trust and confidence in us to manage your money.
This information is intended solely to report on investment strategies identified by Cincinnati Asset Management. Opinions and estimates offered constitute our judgment and are subject to change without notice, as are statements of financial market trends, which are based on current market conditions. This material is not intended as an offer or solicitation to buy, hold or sell any financial instrument. Fixed income securities may be sensitive to prevailing interest rates. When rates rise the value generally declines. Past performance is not a guarantee of future results. Gross of advisory fee performance does not reflect the deduction of investment advisory fees. Our advisory fees are disclosed in Form ADV Part 2A. Accounts managed through brokerage firm programs usually will include additional fees. Returns are calculated monthly in U.S. dollars and include reinvestment of dividends and interest. The index is unmanaged and does not take into account fees, expenses, and transaction costs. It is shown for comparative purposes and is based on information generally available to the public from sources believed to be reliable. No representation is made to its accuracy or completeness.
i Federal Reserve Board, June 2006 “The U.S. Treasury Yield Curve: 1961 to the Present”
ii Robert C. Merton, May 1974 “On The Pricing of Corporate Debt: The Risk Structure of Interest Rates


